Attached files
| file | filename |
|---|---|
| 8-K - 8-K - COMFORT SYSTEMS USA INC | a12-26631_18k.htm |
Exhibit 99.1
|
|
Comfort Systems USA (NYSE: FIX) November 13, 2012 |
|
|
Disclosures Safe Harbor Certain statements and information in this presentation may constitute forward-looking statements within the meaning of the Private Securities Litigation Reform Act of 1995. The words “believe,” “expect,” “anticipate,” “plan,” “intend,” “foresee,” “should,” “would,” “could,” or other similar expressions are intended to identify forward-looking statements, which are generally not historic in nature. These forward-looking statements are based on the current expectations and beliefs of Comfort Systems USA, Inc. and its subsidiaries (collectively, the “Company”) concerning future developments and their effect on the Company. While the Company’s management believes that these forward-looking statements are reasonable as and when made, there can be no assurance that future developments affecting the Company will be those that it anticipates. All comments concerning the Company’s expectations for future revenues and operating results are based on the Company’s forecasts for its existing operations and do not include the potential impact of any future acquisitions. The Company’s forward-looking statements involve significant risks and uncertainties (some of which are beyond the Company’s control) and assumptions that could cause actual future results to differ materially from the Company’s historical experience and its present expectations or projections. Important factors that could cause actual results to differ materially from those in the forward-looking statements include, but are not limited to: the use of incorrect estimates for bidding a fixed-price contract; undertaking contractual commitments that exceed the Company’s labor resources; failing to perform contractual obligations efficiently enough to maintain profitability; national or regional weakness in construction activity and economic conditions; financial difficulties affecting projects, vendors, customers, or subcontractors; the Company’s backlog failing to translate into actual revenue or profits; difficulty in obtaining or increased costs associated with bonding and insurance; impairment to goodwill; errors in the Company’s percentage-of-completion method of accounting; the result of competition in the Company’s markets; the Company’s decentralized management structure; material failure to comply with varying state and local laws, regulations or requirements; debarment from bidding on or performing government contracts; shortages of labor and specialty building materials; retention of key management; seasonal fluctuations in the demand for HVAC systems; the imposition of past and future liability from environmental, safety, and health regulations including the inherent risk associated with self-insurance; adverse litigation results; and other risks detailed in our reports filed with the Securities and Exchange Commission. For additional information regarding known material factors that could cause the Company’s results to differ from its projected results, please see its filings with the SEC, including its Annual Report on Form 10-K, Quarterly Reports on Form 10-Q, and Current Reports on Form 8-K. Readers are cautioned not to place undue reliance on forward-looking statements, which speak only as of the date hereof. The Company undertakes no obligation to publicly update or revise any forward-looking statements after the date they are made, whether as a result of new information, future events, or otherwise. Non-GAAP Measures Certain measures in this presentation are not measures calculated in accordance with generally accepted accounting principles (GAAP). They should not be considered a replacement for GAAP results. Non-GAAP financial measures appearing in these slides are identified in the footnote. See the Appendices for a reconciliation of these non-GAAP measures to the most comparable GAAP financial measures. 2 |
|
|
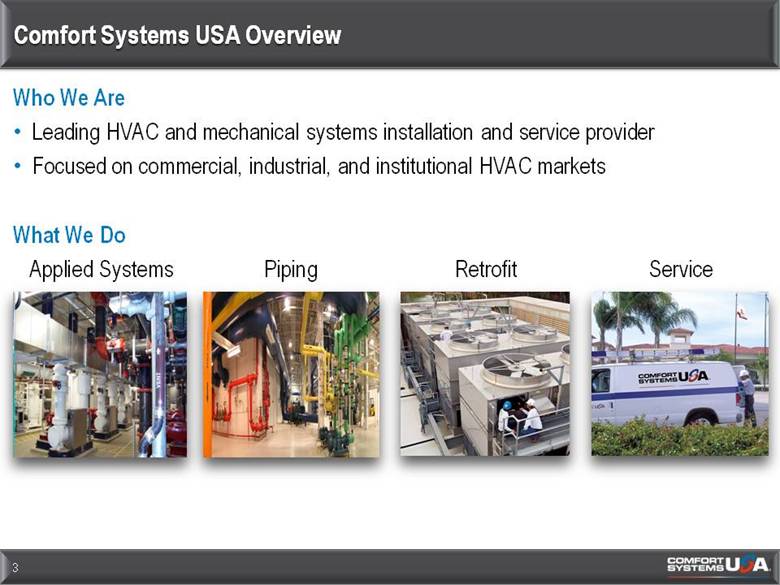
Comfort Systems USA Overview Who We Are Leading HVAC and mechanical systems installation and service provider Focused on commercial, industrial, and institutional HVAC markets What We Do Applied Systems Piping Retrofit Service 3 |
|
|
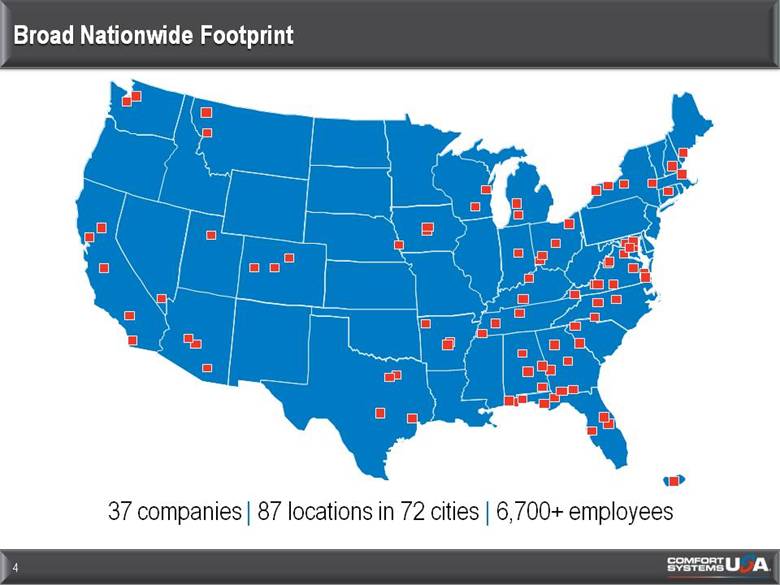
Broad Nationwide Footprint 4 37 companies | 87 locations in 72 cities | 6,700+ employees |
|
|
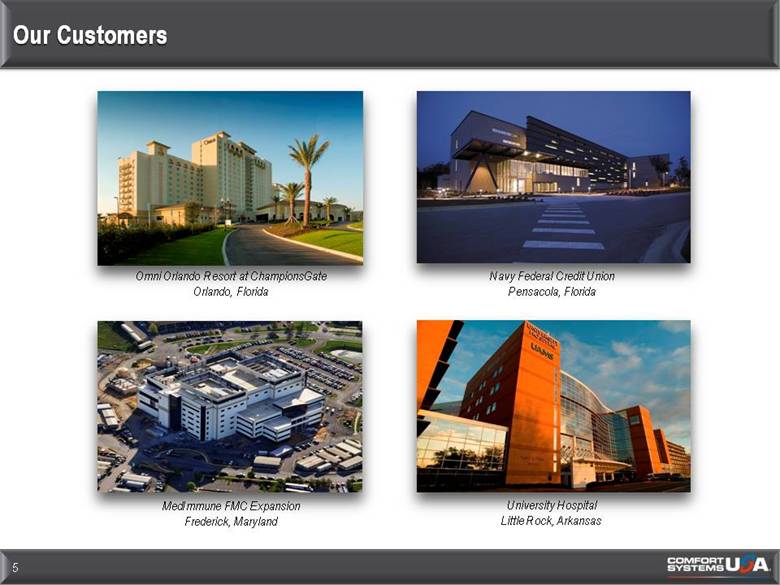
Our Customers 5 Omni Orlando Resort at ChampionsGate Orlando, Florida University Hospital Little Rock, Arkansas Navy Federal Credit Union Pensacola, Florida MedImmune FMC Expansion Frederick, Maryland |
|
|
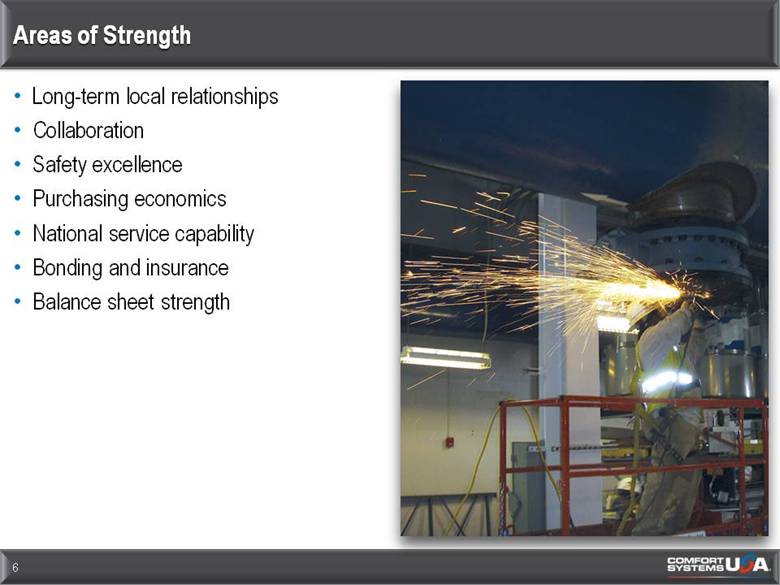
Areas of Strength Long-term local relationships Collaboration Safety excellence Purchasing economics National service capability Bonding and insurance Balance sheet strength 6 |
|
|
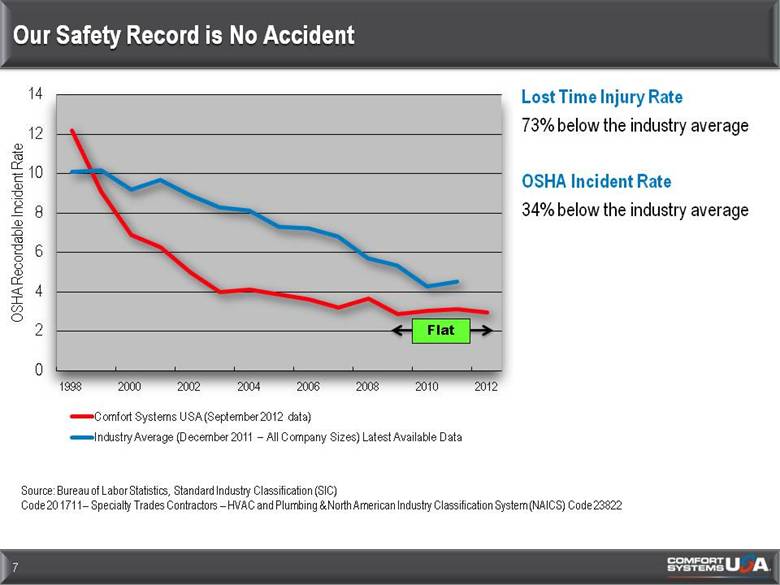
Our Safety Record is No Accident 7 Lost Time Injury Rate 73% below the industry average OSHA Incident Rate 34% below the industry average Flat Source: Bureau of Labor Statistics, Standard Industry Classification (SIC) Code 20 1711–Specialty Trades Contractors–HVAC and Plumbing & North American Industry Classification System (NAICS) Code 23822 |
|
|
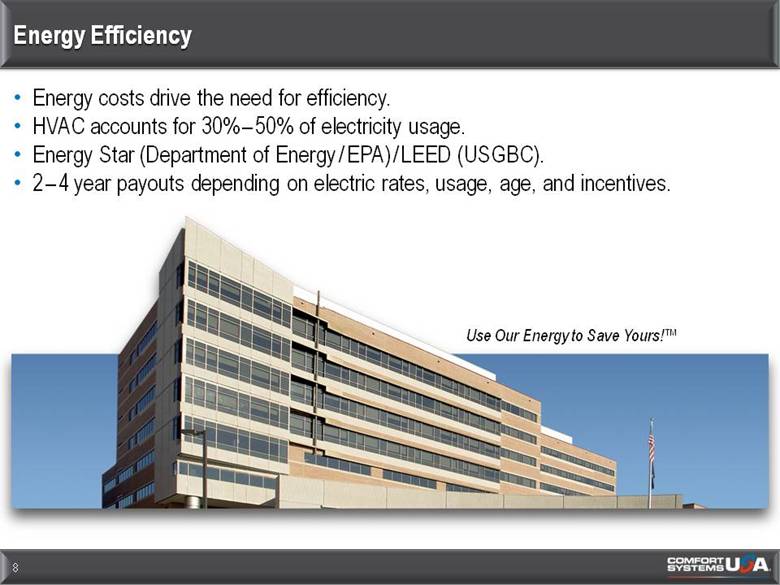
Energy Efficiency Energy costs drive the need for efficiency. HVAC accounts for 30%–50% of electricity usage. Energy Star (Department of Energy/EPA)/LEED (USGBC). 2–4 year payouts depending on electric rates, usage, age, and incentives. 8 Use Our Energy to Save Yours!™ |
|
|
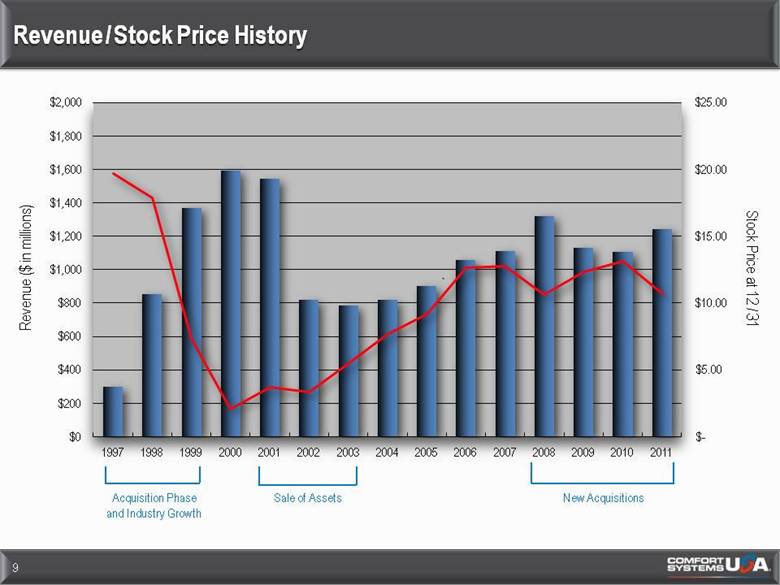
Revenue/Stock Price History 9 Revenue ($ in millions) Acquisition Phase and Industry Growth Sale of Assets New Acquisitions Stock Price at 12/31 |
|
|
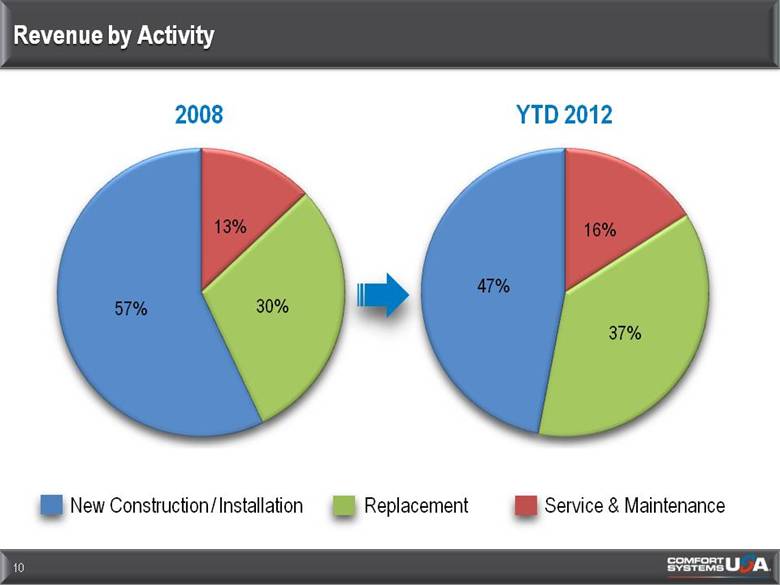
Revenue by Activity 10 New Construction/Installation Replacement Service & Maintenance 2008 YTD 2012 |
|
|
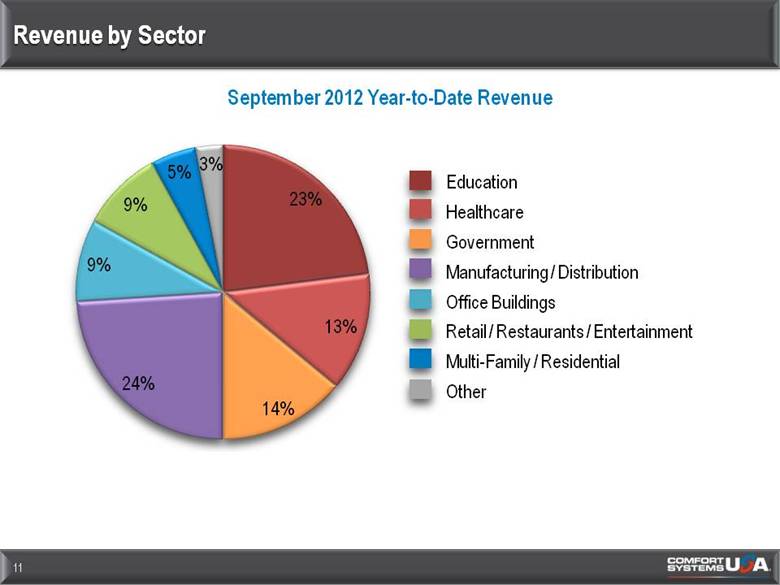
Revenue by Sector 11 Education Healthcare Government Manufacturing/Distribution Office Buildings Retail/Restaurants/Entertainment Multi-Family/Residential Other September 2012 Year-to-Date Revenue |
|
|
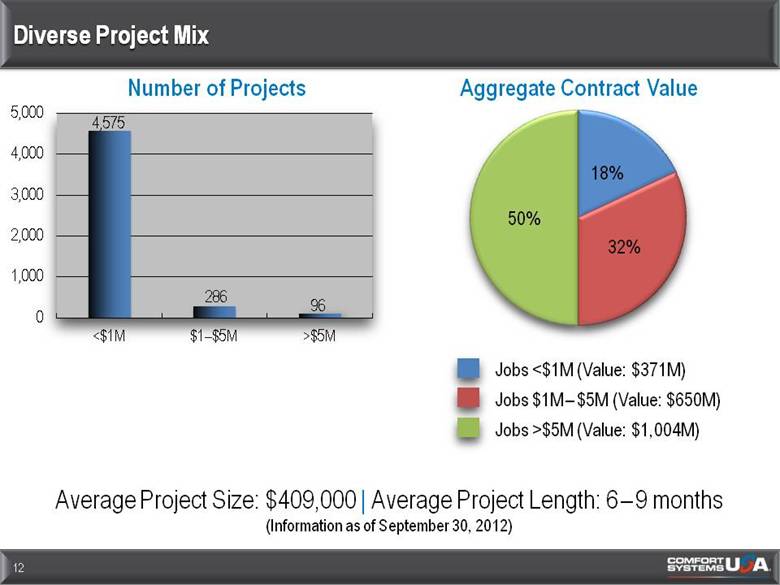
Diverse Project Mix 12 Average Project Size: $409,000 | Average Project Length: 6–9 months (Information as of September 30, 2012) Aggregate Contract Value Jobs <$1M (Value: $371M) Jobs $1M–$5M (Value: $650M) Jobs >$5M (Value: $1,004M) |
|
|
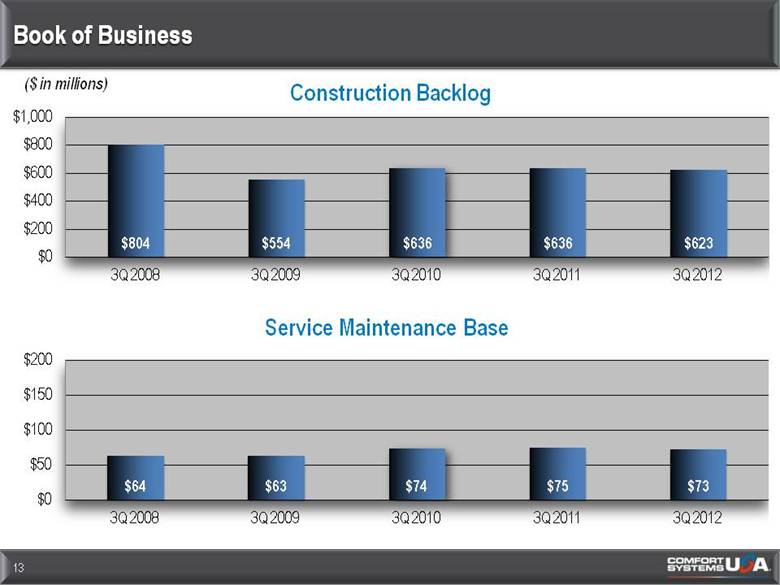
Book of Business 13 ($ in millions) |
|
|
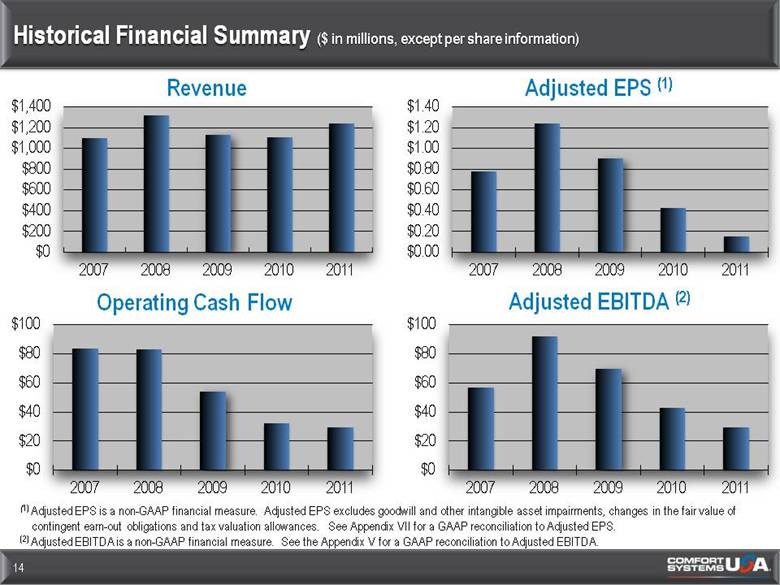
Historical Financial Summary ($ in millions, except per share information) 14 (1) Adjusted EPS is a non-GAAP financial measure. Adjusted EPS excludes goodwill and other intangible asset impairments, changes in the fair value of contingent earn-out obligations and tax valuation allowances. See Appendix VII for a GAAP reconciliation to Adjusted EPS. (2) Adjusted EBITDA is a non-GAAP financial measure. See the Appendix V for a GAAP reconciliation to Adjusted EBITDA. |
|
|
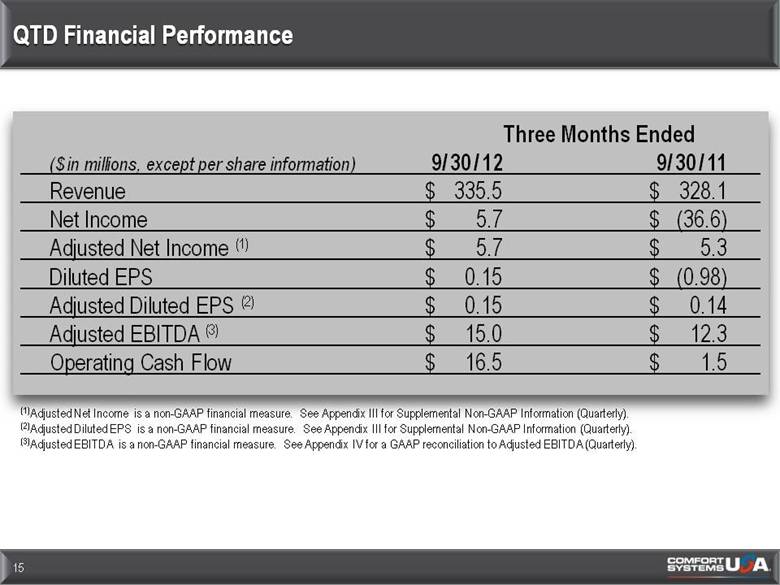
QTD Financial Performance 15 Three Months Ended ($ in millions, except per share information) 9/30/12 9/30/11 Revenue $ 335.5 $ 328.1 Net Income $ 5.7 $ (36.6) Adjusted Net Income (1) $ 5.7 $ 5.3 Diluted EPS $ 0.15 $ (0.98) Adjusted Diluted EPS (2) $ 0.15 $ 0.14 Adjusted EBITDA (3) $ 15.0 $ 12.3 Operating Cash Flow $ 16.5 $ 1.5 (1)Adjusted Net Income is a non-GAAP financial measure. See Appendix III for Supplemental Non-GAAP Information (Quarterly). (2)Adjusted Diluted EPS is a non-GAAP financial measure. See Appendix III for Supplemental Non-GAAP Information (Quarterly). (3)Adjusted EBITDA is a non-GAAP financial measure. See Appendix IV for a GAAP reconciliation to Adjusted EBITDA (Quarterly). |
|
|
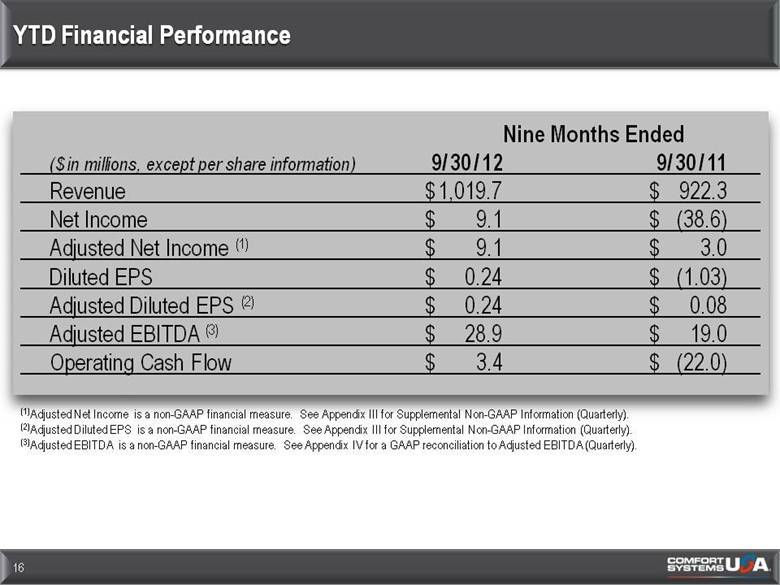
YTD Financial Performance 16 Nine Months Ended ($ in millions, except per share information) 9/30/12 9/30/11 Revenue $ 1,019.7 $ 922.3 Net Income $ 9.1 $ (38.6) Adjusted Net Income (1) $ 9.1 $ 3.0 Diluted EPS $ 0.24 $ (1.03) Adjusted Diluted EPS (2) $ 0.24 $ 0.08 Adjusted EBITDA (3) $ 28.9 $ 19.0 Operating Cash Flow $ 3.4 $ (22.0) (1)Adjusted Net Income is a non-GAAP financial measure. See Appendix III for Supplemental Non-GAAP Information (Quarterly). (2)Adjusted Diluted EPS is a non-GAAP financial measure. See Appendix III for Supplemental Non-GAAP Information (Quarterly). (3)Adjusted EBITDA is a non-GAAP financial measure. See Appendix IV for a GAAP reconciliation to Adjusted EBITDA (Quarterly). |
|
|
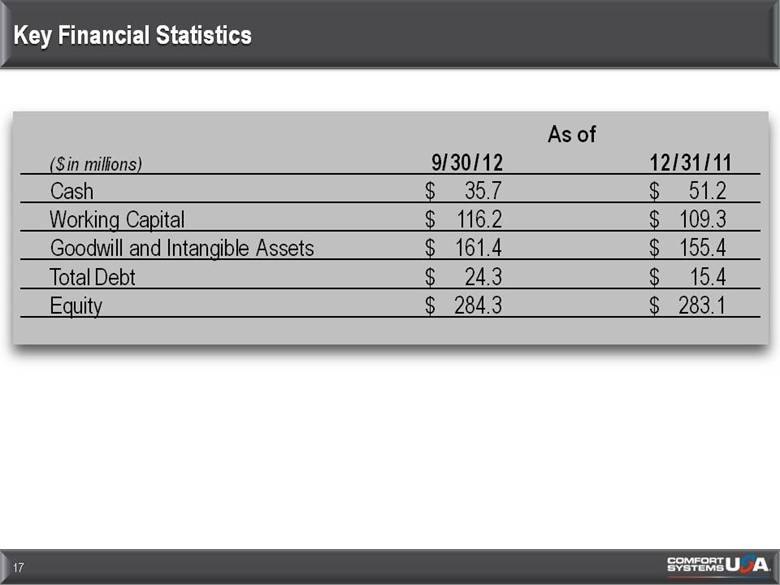
Key Financial Statistics 17 As of ($ in millions) 9/30/12 12/31/11 Cash $ 35.7 $ 51.2 Working Capital $ 116.2 $ 109.3 Goodwill and Intangible Assets $ 161.4 $ 155.4 Total Debt $ 24.3 $ 15.4 Equity $ 284.3 $ 283.1 |
|
|
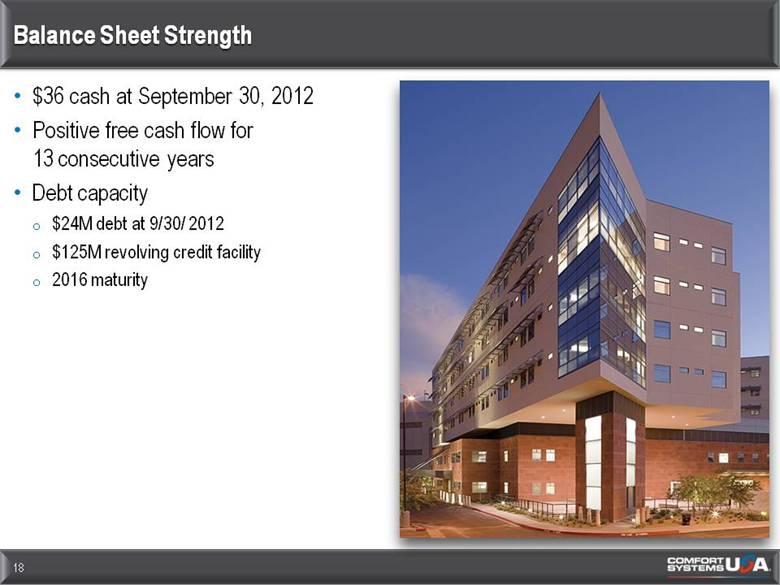
Balance Sheet Strength $36 cash at September 30, 2012 Positive free cash flow for 13 consecutive years Debt capacity $24M debt at 9/30/2012 $125M revolving credit facility 2016 maturity 18 |
|
|
Profile for Growth 19 Time Earnings Grow Service Innovate Acquire Service Commercial HVAC Grow Construction |

|
|
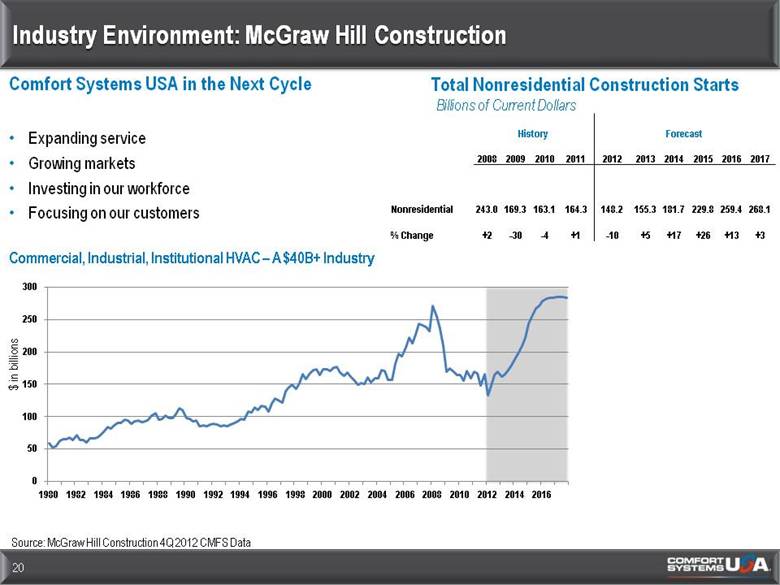
Industry Environment: McGraw Hill Construction 20 Source: McGraw Hill Construction 4Q 2012 CMFS Data History Forecast 2008 2009 2010 2011 2012 2013 2014 2015 2016 2017 Nonresidential 243.0 169.3 163.1 164.3 148.2 155.3 181.7 229.8 259.4 268.1 % Change +2 -30 -4 +1 -10 +5 +17 +26 +13 +3 Total Nonresidential Construction Starts Billions of Current Dollars Comfort Systems USA in the Next Cycle Expanding service Growing markets Investing in our workforce Focusing on our customers Commercial, Industrial, Institutional HVAC–A $40B+ Industry |
|
|
Appendices |
|
|
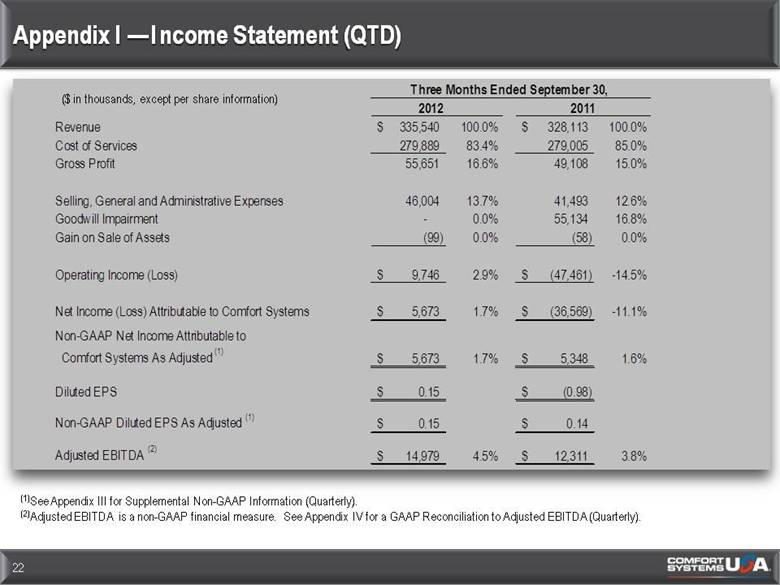
Appendix I —Income Statement (QTD) 22 ($ in thousands, except per share information) (1)See Appendix III for Supplemental Non-GAAP Information (Quarterly). (2)Adjusted EBITDA is a non-GAAP financial measure. See Appendix IV for a GAAP Reconciliation to Adjusted EBITDA (Quarterly). 2012 Revenue 335,540 $ 100.0% 328,113 $ 100.0% Cost of Services 279,889 83.4% 279,005 85.0% Gross Profit 55,651 16.6% 49,108 15.0% Selling, General and Administrative Expenses 46,004 13.7% 41,493 12.6% Goodwill Impairment - 0.0% 55,134 16.8% Gain on Sale of Assets (99) 0.0% (58) 0.0% Operating Income (Loss) 9,746 $ 2.9% (47,461) $ -14.5% Net Income (Loss) Attributable to Comfort Systems 5,673 $ 1.7% (36,569) $ -11.1% Non-GAAP Net Income Attributable to Comfort Systems As Adjusted (1) 5,673 $ 1.7% 5,348 $ 1.6% Diluted EPS 0.15 $ (0.98) $ Non-GAAP Diluted EPS As Adjusted (1) 0.15 $ 0.14 $ Adjusted EBITDA (2) 14,979 $ 4.5% 12,311 $ 3.8% 2011 Three Months Ended September 30, |
|
|
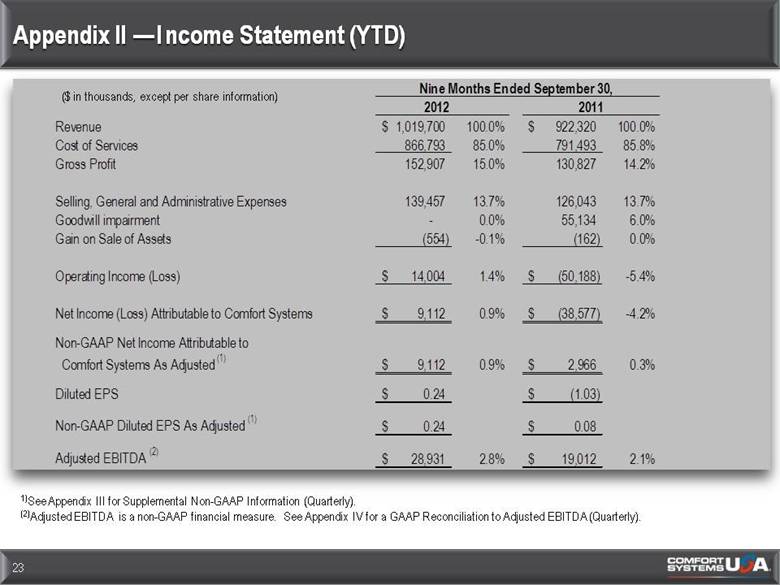
Appendix II —Income Statement (YTD) 23 ($ in thousands, except per share information) 1)See Appendix III for Supplemental Non-GAAP Information (Quarterly). (2)Adjusted EBITDA is a non-GAAP financial measure. See Appendix IV for a GAAP Reconciliation to Adjusted EBITDA (Quarterly). 2012 Revenue 1,019,700 $ 100.0% 922,320 $ 100.0% Cost of Services 866,793 85.0% 791,493 85.8% Gross Profit 152,907 15.0% 130,827 14.2% Selling, General and Administrative Expenses 139,457 13.7% 126,043 13.7% Goodwill impairment - 0.0% 55,134 6.0% Gain on Sale of Assets (554) -0.1% (162) 0.0% Operating Income (Loss) 14,004 $ 1.4% (50,188) $ -5.4% Net Income (Loss) Attributable to Comfort Systems 9,112 $ 0.9% (38,577) $ -4.2% Non-GAAP Net Income Attributable to Comfort Systems As Adjusted (1) 9,112 $ 0.9% 2,966 $ 0.3% Diluted EPS 0.24 $ (1.03) $ Non-GAAP Diluted EPS As Adjusted (1) 0.24 $ 0.08 $ Adjusted EBITDA (2) 28,931 $ 2.8% 19,012 $ 2.1% 2011 Nine Months Ended September 30, |
|
|
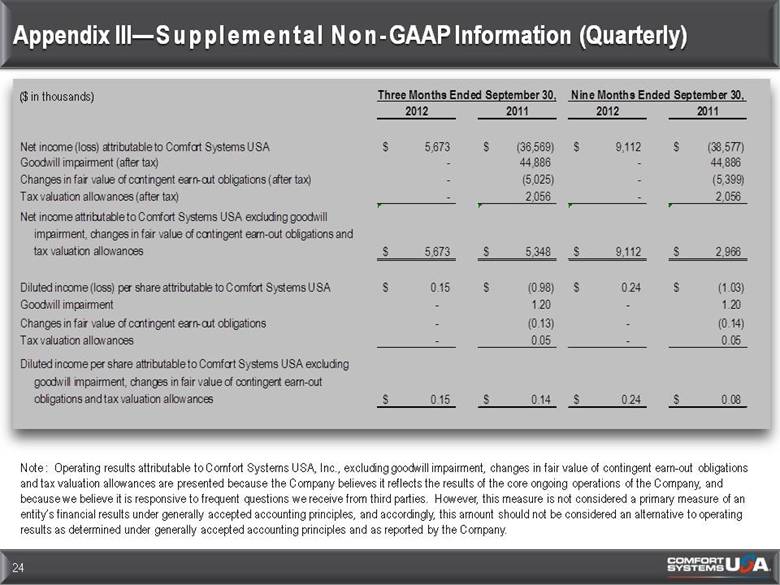
Appendix III—Supplemental Non-GAAP Information (Quarterly) 24 ($ in thousands) Note : Operating results attributable to Comfort Systems USA, Inc., excluding goodwill impairment, changes in fair value of contingent earn-out obligations and tax valuation allowances are presented because the Company believes it reflects the results of the core ongoing operations of the Company, and because we believe it is responsive to frequent questions we receive from third parties. However, this measure is not considered a primary measure of an entity’s financial results under generally accepted accounting principles, and accordingly, this amount should not be considered an alternative to operating results as determined under generally accepted accounting principles and as reported by the Company. Three Months Ended September 30, Nine Months Ended September 30, 2012 2011 2012 2011 Net income (loss) attributable to Comfort Systems USA 5,673 $ (36,569) $ 9,112 $ (38,577) $ Goodwill impairment (after tax) - 44,886 - 44,886 Changes in fair value of contingent earn-out obligations (after tax) - (5,025) - (5,399) Tax valuation allowances (after tax) - 2,056 - 2,056 Net income attributable to Comfort Systems USA excluding goodwill impairment, changes in fair value of contingent earn-out obligations and tax valuation allowances 5,673 $ 5,348 $ 9,112 $ 2,966 $ Diluted income (loss) per share attributable to Comfort Systems USA 0.15 $ (0.98) $ 0.24 $ (1.03) $ Goodwill impairment - 1.20 - 1.20 Changes in fair value of contingent earn-out obligations - (0.13) - (0.14) Tax valuation allowances - 0.05 - 0.05 Diluted income per share attributable to Comfort Systems USA excluding goodwill impairment, changes in fair value of contingent earn-out obligations and tax valuation allowances 0.15 $ 0.14 $ 0.24 $ 0.08 $ |
|
|
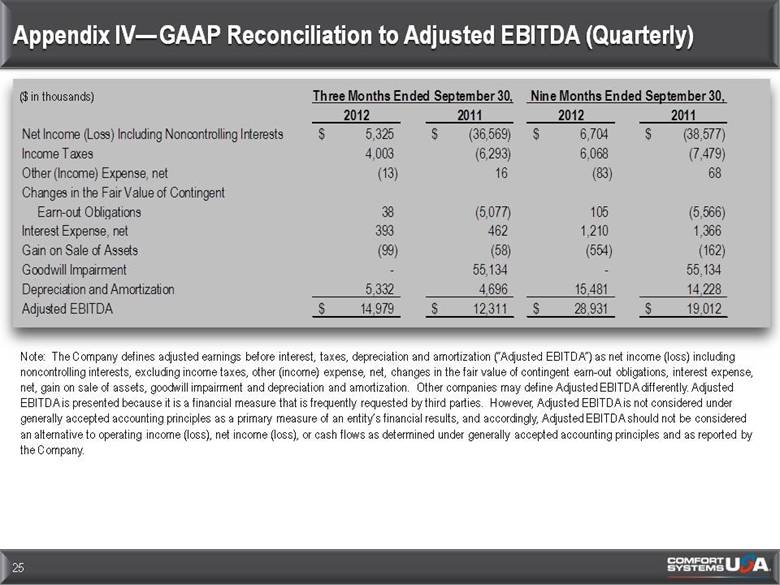
Appendix IV—GAAP Reconciliation to Adjusted EBITDA (Quarterly) 25 ($ in thousands) Note: The Company defines adjusted earnings before interest, taxes, depreciation and amortization (“Adjusted EBITDA”) as net income (loss) including noncontrolling interests, excluding income taxes, other (income) expense, net, changes in the fair value of contingent earn-out obligations, interest expense, net, gain on sale of assets, goodwill impairment and depreciation and amortization. Other companies may define Adjusted EBITDA differently. Adjusted EBITDA is presented because it is a financial measure that is frequently requested by third parties. However, Adjusted EBITDA is not considered under generally accepted accounting principles as a primary measure of an entity’s financial results, and accordingly, Adjusted EBITDA should not be considered an alternative to operating income (loss), net income (loss), or cash flows as determined under generally accepted accounting principles and as reported by the Company. Three Months Ended September 30, Nine Months Ended September 30, 2012 2011 2012 2011 Net Income (Loss) Including Noncontrolling Interests 5,325 $ (36,569) $ 6,704 $ (38,577) $ Income Taxes 4,003 (6,293) 6,068 (7,479) Other (Income) Expense, net (13) 16 (83) 68 Changes in the Fair Value of Contingent Earn-out Obligations 38 (5,077) 105 (5,566) Interest Expense, net 393 462 1,210 1,366 Gain on Sale of Assets (99) (58) (554) (162) Goodwill Impairment - 55,134 - 55,134 Depreciation and Amortization 5,332 4,696 15,481 14,228 Adjusted EBITDA 14,979 $ 12,311 $ 28,931 $ 19,012 $ |
|
|
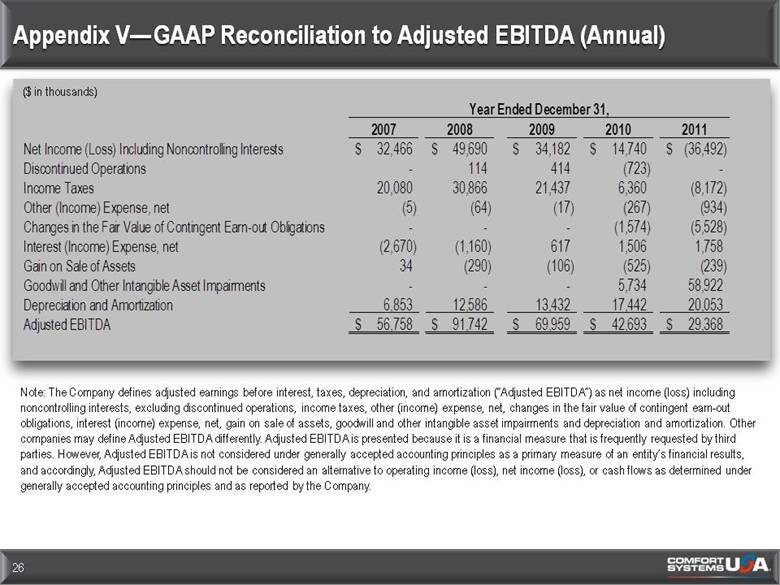
($ in thousands) Appendix V—GAAP Reconciliation to Adjusted EBITDA (Annual) 26 Note: The Company defines adjusted earnings before interest, taxes, depreciation, and amortization (“Adjusted EBITDA”) as net income (loss) including noncontrolling interests, excluding discontinued operations, income taxes, other (income) expense, net, changes in the fair value of contingent earn-out obligations, interest (income) expense, net, gain on sale of assets, goodwill and other intangible asset impairments and depreciation and amortization. Other companies may define Adjusted EBITDA differently. Adjusted EBITDA is presented because it is a financial measure that is frequently requested by third parties. However, Adjusted EBITDA is not considered under generally accepted accounting principles as a primary measure of an entity’s financial results, and accordingly, Adjusted EBITDA should not be considered an alternative to operating income (loss), net income (loss), or cash flows as determined under generally accepted accounting principles and as reported by the Company. 2007 2008 2009 2010 2011 Net Income (Loss) Including Noncontrolling Interests 32,466 $ 49,690 $ 34,182 $ 14,740 $ (36,492) $ Discontinued Operations - 114 414 (723) - Income Taxes 20,080 30,866 21,437 6,360 (8,172) Other (Income) Expense, net (5) (64) (17) (267) (934) Changes in the Fair Value of Contingent Earn-out Obligations - - - (1,574) (5,528) Interest (Income) Expense, net (2,670) (1,160) 617 1,506 1,758 Gain on Sale of Assets 34 (290) (106) (525) (239) Goodwill and Other Intangible Asset Impairments - - - 5,734 58,922 Depreciation and Amortization 6,853 12,586 13,432 17,442 20,053 Adjusted EBITDA 56,758 $ 91,742 $ 69,959 $ 42,693 $ 29,368 $ Year Ended December 31, |
|
|
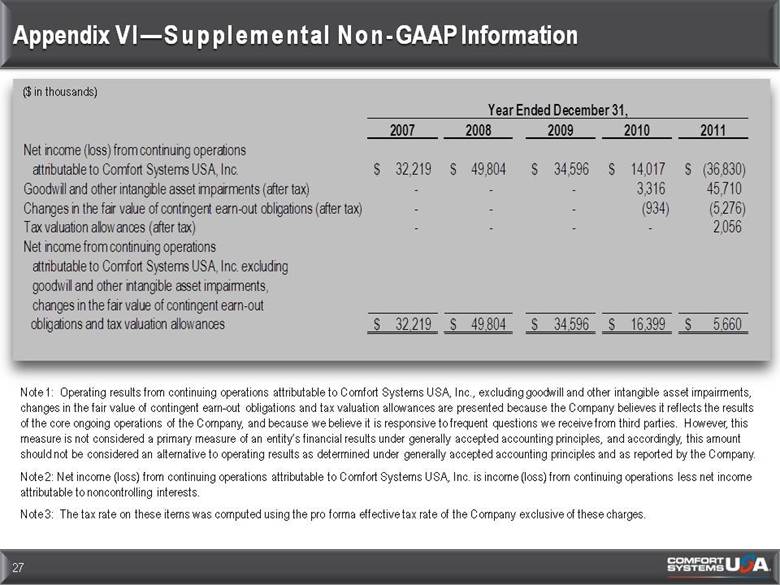
($ in thousands) Appendix VI—Supplemental Non-GAAP Information 27 Note 1: Operating results from continuing operations attributable to Comfort Systems USA, Inc., excluding goodwill and other intangible asset impairments, changes in the fair value of contingent earn-out obligations and tax valuation allowances are presented because the Company believes it reflects the results of the core ongoing operations of the Company, and because we believe it is responsive to frequent questions we receive from third parties. However, this measure is not considered a primary measure of an entity’s financial results under generally accepted accounting principles, and accordingly, this amount should not be considered an alternative to operating results as determined under generally accepted accounting principles and as reported by the Company. Note 2: Net income (loss) from continuing operations attributable to Comfort Systems USA, Inc. is income (loss) from continuing operations less net income attributable to noncontrolling interests. Note 3: The tax rate on these items was computed using the pro forma effective tax rate of the Company exclusive of these charges. 2007 2008 2009 2010 2011 Net income (loss) from continuing operations attributable to Comfort Systems USA, Inc. 32,219 $ 49,804 $ 34,596 $ 14,017 $ (36,830) $ Goodwill and other intangible asset impairments (after tax) - - - 3,316 45,710 Changes in the fair value of contingent earn-out obligations (after tax) - - - (934) (5,276) Tax valuation allowances (after tax) - - - - 2,056 Net income from continuing operations attributable to Comfort Systems USA, Inc. excluding goodwill and other intangible asset impairments, changes in the fair value of contingent earn-out obligations and tax valuation allowances 32,219 $ 49,804 $ 34,596 $ 16,399 $ 5,660 $ Year Ended December 31, |
|
|
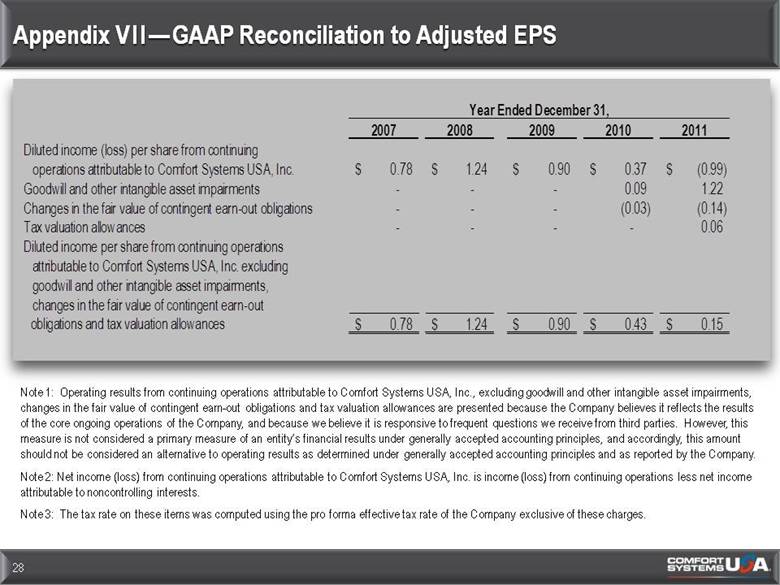
Appendix VII—GAAP Reconciliation to Adjusted EPS 28 Note 1: Operating results from continuing operations attributable to Comfort Systems USA, Inc., excluding goodwill and other intangible asset impairments, changes in the fair value of contingent earn-out obligations and tax valuation allowances are presented because the Company believes it reflects the results of the core ongoing operations of the Company, and because we believe it is responsive to frequent questions we receive from third parties. However, this measure is not considered a primary measure of an entity’s financial results under generally accepted accounting principles, and accordingly, this amount should not be considered an alternative to operating results as determined under generally accepted accounting principles and as reported by the Company. Note 2: Net income (loss) from continuing operations attributable to Comfort Systems USA, Inc. is income (loss) from continuing operations less net income attributable to noncontrolling interests. Note 3: The tax rate on these items was computed using the pro forma effective tax rate of the Company exclusive of these charges. 2007 2008 2009 2010 2011 Diluted income (loss) per share from continuing operations attributable to Comfort Systems USA, Inc. 0.78 $ 1.24 $ 0.90 $ 0.37 $ (0.99) $ Goodwill and other intangible asset impairments - - - 0.09 1.22 Changes in the fair value of contingent earn-out obligations - - - (0.03) (0.14) Tax valuation allowances - - - - 0.06 Diluted income per share from continuing operations attributable to Comfort Systems USA, Inc. excluding goodwill and other intangible asset impairments, changes in the fair value of contingent earn-out obligations and tax valuation allowances 0.78 $ 1.24 $ 0.90 $ 0.43 $ 0.15 $ Year Ended December 31, |
|
|
Contact 29 Bill George Executive Vice President and CFO 1-800-723-8431 bill.george@comfortsystemsusa.com www.comfortsystemsusa.com |