Attached files
| file | filename |
|---|---|
| 8-K - 8-K - CHINA FUND INC | v328007_8k.htm |
| Monthly Insight | |
| SEP 30, 2012 | The China Fund, Inc. (CHN) |
Investment Objective
The investment objective of the Fund is to achieve long term capital appreciation. The Fund seeks to achieve its objective through investment in the equity securities of companies and other entities with significant assets, investments, production activities, trading or other business interests in China or which derive a significant part of their revenue from China.
The Fund has an operating policy that the Fund will invest at least 80% of its assets in China companies. For this purpose, ‘China companies’ are (i) companies for which the principal securities trading market is in China; (ii) companies for which the principal securities trading market is outside of China or in companies organized outside of China, that in both cases derive at least 50% of their revenues from goods or services sold or produced, or have at least 50% of their assets in China; or (iii) companies organized in China.
Under the policy, China will mean the People’s Republic of China, including Hong Kong, and Taiwan. The Fund will provide its stockholders with at least 60 days’ prior notice of any change to this policy.
Performance Overview
| Performance History | 1 month | 3 months | YTD | 1 Year | 3 Years (p.a.) | 5 Years (p.a.) | 10 Years (p.a.) | Since Inception (p.a.) | ||||||||||||||||||||||||
| NAV (%) | 4.10 | 3.57 | 5.98 | 6.12 | 5.92 | -0.44 | 19.18 | 10.59 | ||||||||||||||||||||||||
| Market price (%) | 4.60 | 1.64 | 8.68 | 11.32 | 4.72 | 0.75 | 20.47 | 9.60 | ||||||||||||||||||||||||
| Benchmark (%) | 7.08 | 8.56 | 13.80 | 19.51 | 4.39 | -2.69 | 12.77 | N/A | ||||||||||||||||||||||||
| Performance History | 2011 | 2010 | 2009 | 2008 | 2007 | 2006 | 2005 | 2004 | ||||||||||||||||||||||||
| NAV (%) | -24.37 | 27.25 | 72.82 | -46.95 | 86.20 | 57.10 | 6.09 | 3.80 | ||||||||||||||||||||||||
| Market price (%) | -27.51 | 23.60 | 72.19 | -40.65 | 50.24 | 65.67 | -21.51 | -9.95 | ||||||||||||||||||||||||
| Benchmark (%) | -18.36 | 13.60 | 67.12 | -49.37 | 37.97 | 39.50 | 10.27 | 14.27 | ||||||||||||||||||||||||
Source : State Street Bank and Trust Company. Source for index data: MSCI as at September 30, 2012.
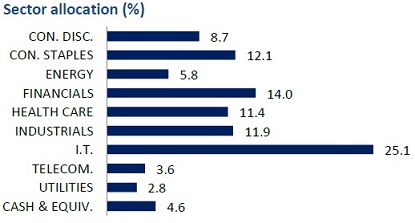
Portfolio Analysis
 |
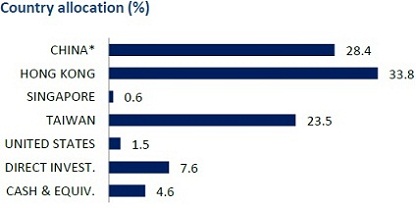 |
| Source : State Street Bank and Trust Company as at September 30, 2012. |
* China includes A-shares (4.2%), A-share equity linked securities (9.0%),
B-shares (0.9%) and H-shares (14.3%). |

The China Fund, Inc. (CHN)
Portfolio Analysis (continued)
| Top 10 Holdings | Sector | % | Direct Investments | Sector | % | |||||
| TAIWAN SEMICONDUCTOR MANUFACTURING CO., LTD. | I.T. | 5.6 | CHINA BRIGHT | HEALTH CARE | 4.4 | |||||
| CHINA BRIGHT | HEALTH CARE | 4.4 | ZONG SU FOODS | CON. STAPLES | 3.2 | |||||
| HAND ENTERPRISE SOLUTIONS CO., LTD. | I.T. | 4.2 | CHINA SILICON CORP., SERIES A PREFERRED | I.T. | 0.0 | |||||
| DIGITAL CHINA HOLDINGS, LTD. | I.T. | 3.8 | CHINA SILICON CORP., COMMON STOCK | I.T. | 0.0 | |||||
| TAIWAN FAMILYMART CO., LTD. | CON. DISC. | 3.7 | ||||||||
| CHINA MOBILE, LTD. | TELECOM | 3.6 | ||||||||
| CHINA MEDICAL SYSTEM HOLDINGS, LTD. | HEALTH CARE | 3.6 | ||||||||
| CHINA EVERBRIGHT INTERNATIONAL, LTD. | INDUSTRIALS | 3.5 | ||||||||
| ZONG SU FOODS | CON. STAPLES | 3.2 | ||||||||
| INDUSTRIAL & COMMERCIAL BANK OF CHINA | FINANCIALS | 3.1 | ||||||||
| Total | 38.7 | Total | 7.6 |
Source : State Street Bank and Trust Company as at September 30, 2012.
Fund Details
| NAV | $24.64 |
| Market price | $22.29 |
| Premium/Discount | -9.54% |
| Market cap | US$360.4m |
| Shares outstanding | 16,169,099 |
| Exchange listed | NYSE |
| Listing date | July 10, 1992 |
| Benchmark | MSCI Golden Dragon Index (Total Return) |
| Fund Manager | Christina Chung |
| Listed and direct | RCM Asia Pacific Limited |
| investment manager | |
Source : State Street Bank and Trust Company as at September 30, 2012.
Dividend History (10 years)
|
Declaration date |
Ex-dividend date |
Record date |
Payable date |
Dividend/Share |
Income |
Long-term Capital |
Short-term Capital | |||||||
| 8 Dec 2011 | 21 Dec 2011 | 23 Dec 2011 | 29 Dec 2011 | 2.99640 | 0.17420 | 2.82220 | 0.00000 | |||||||
| 8 Dec 2010 | 21 Dec 2010 | 24 Dec 2010 | 29 Dec 2010 | 2.27420 | 0.37460 | 1.89960 | 0.00000 | |||||||
| 9 Dec 2009 | 22 Dec 2009 | 24 Dec 2009 | 29 Dec 2009 | 0.25570 | 0.25570 | 0.00000 | 0.00000 | |||||||
| 8 Dec 2008 | 22 Dec 2008 | 24 Dec 2008 | 23 Jan 2009 | 5.81740 | 0.48130 | 5.33610 | 0.00000 | |||||||
| 7 Dec 2007 | 19 Dec 2007 | 21 Dec 2007 | 25 Jan 2008 | 12.12000 | 0.28000 | 9.00000 | 2.84000 | |||||||
| 8 Dec 2006 | 19 Dec 2006 | 21 Dec 2006 | 29 Dec 2006 | 4.01170 | 0.29960 | 2.73090 | 0.98120 | |||||||
| 9 Dec 2005 | 19 Dec 2005 | 21 Dec 2005 | 29 Dec 2005 | 2.51190 | 0.21720 | 2.29470 | 0.00000 | |||||||
| 13 Dec 2004 | 20 Dec 2004 | 22 Dec 2004 | 7 Jan 2005 | 3.57010 | 0.19630 | 3.26640 | 0.10740 | |||||||
| 19 Dec 2003 | 29 Dec 2003 | 31 Dec 2003 | 15 Jan 2004 | 1.78000 | 0.07000 | 0.67000 | 1.04000 | |||||||
| 17 Dec 2002 | 23 Dec 2002 | 26 Dec 2002 | 15 Jan 2003 | 0.21437 | 0.06397 | 0.00069 | 0.14971 |
Source : State Street Bank and Trust Company as at September 30, 2012.
| 2 |
The China Fund, Inc. (CHN)
The China Fund Inc. NAV Performance of US$10,000 since inception (with dividends reinvested at NAV price)
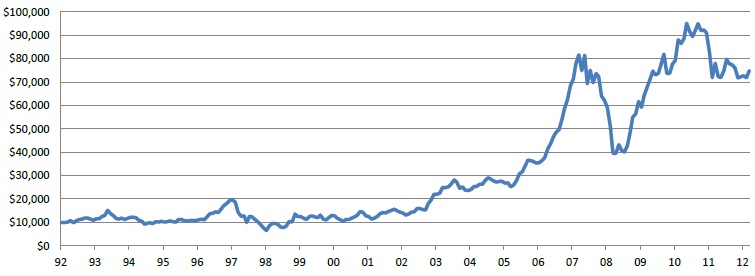
Past performance is not a guide to future returns.
Source : State Street Bank and Trust Company as at September 30, 2012.
China Fund Inc. Premium / Discount
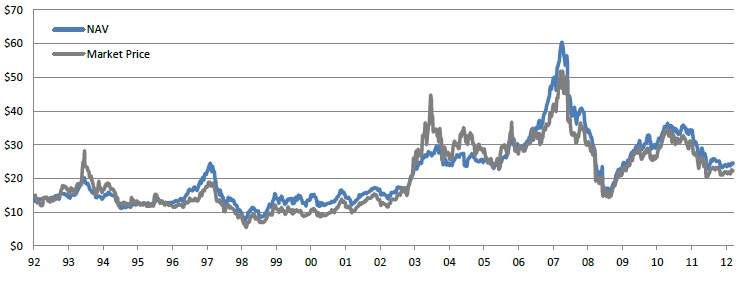
Past performance is not a guide to future returns.
Source : State Street Bank and Trust Company as at September 30, 2012.
| 3 |
The China Fund, Inc. (CHN)
Manager’s Commentary
Market review
The equity market remained quiet until the US Federal Reserve and the European Central Bank rolled out further rounds of quantitative easing in mid- September. Following the improved market sentiment, the Hong Kong equity market rose to a four-month high at third quarter’s end. During the month, most macroeconomic data showed an economic slowdown in China although there were some signs of stabilization. We believe that the market has already priced in most of the negative news. The property sector and high beta stocks outperformed the market in the month of September. The H shares market continued to be the laggard, due to the weak A-shares market that was hampered by fragile retail investor confidence and uncertainty in the upcoming government reshuffle.
The Taiwan stock market continued to see positive momentum in September, supported by QE3 by the US Federal Reserve, the launch of iPhone 5, as well as expectations for a tech sector recovery in Q4 2012. Trade data remained weak as exports decreased 4.2%, year on year, and imports decreased 7.6%, year on year. The unemployment rate edged up slightly in August to 4.29% compared to 4.25% in July. However, Industrial output unexpectedly rose by 1.9% year on year in August compared to a contraction in the previous month. On the policy front, mainland China signed a framework agreement with Taiwan to create a direct RMB clearing mechanism, a swap line for RMB and New Taiwan dollars, as well as a new offshore RMB spot rate in Taiwan, paving the way for Taiwan to become the second offshore RMB center after Hong Kong.
Fund review
In September, the Fund underperformed relative to the benchmark mainly as a result of stock selection in the industrial and health care sectors.
The main detractors during the month were Natural Beauty and China Medical System. The share price weakness of Natural Beauty was due to the business being affected by the economic slowdown in China. Consumers are cautious on discretionary products and services. On the other hand, there was no material news flow for China Medical System, other than the recall of one of its products. It is expected to have minimal impact on the company’s earnings, and the share price consolidated after the strong run in the past few months.
Outlook
Recent economic indicators suggest that the deceleration of the China economy has shown signs of stabilization. Coupling this with quantitative easing by central banks and relatively low market valuations, we believe that China equities should rebound in the short term.
We believe the Taiwan tech sector may see some near term support due to the positive sentiment from recent smartphone launches. However, over the long term, we continue to remain cautious on the competitiveness of Taiwan hardware equipment manufacturers due to the decreasing competitiveness and margin compression pressure from strong global downstream players. In the non-tech space, we see selected opportunities in the Taiwan banking sector, specifically companies which have competitive business models and solid balance sheets. We will keep monitoring the global PC cycle and the external sector of Taiwan. Overall we maintain our cautious view on the Taiwan market.
Source : RCM Asia Pacific Limited as at September 30, 2012.
| 4 |
The China Fund, Inc. (CHN)
Portfolio Holdings
| Percentage of | ||||||||||||||||||
| CUSIP | Security Description | Cost Base | Base MV | Shares | Net Assets | |||||||||||||
| 688910900 | Taiwan Semiconductor Manufacturing Co., Ltd. | 19,343,474.00 | 22,381,456.00 | 7,306,000 | 5.6 | |||||||||||||
| ACI007Y93 | China Bright | 14,969,436.00 | 17,457,154.00 | 14,665,617 | 4.4 | |||||||||||||
| B3VN92906 | HAND Enterprise Solutions Co., Ltd. | 1,793,494.00 | 16,844,287.00 | 6,369,715 | 4.2 | |||||||||||||
| 635186901 | Digital China Holdings, Ltd. | 17,914,700.00 | 15,307,237.00 | 9,603,000 | 3.8 | |||||||||||||
| 644094906 | Taiwan FamilyMart Co., Ltd. | 3,386,867.00 | 14,851,417.00 | 2,971,652 | 3.7 | |||||||||||||
| 607355906 | China Mobile, Ltd. | 13,583,976.00 | 14,207,234.00 | 1,278,000 | 3.6 | |||||||||||||
| B6WY99909 | China Medical System Holdings, Ltd. | 1,982,373.00 | 14,151,562.00 | 27,094,300 | 3.6 | |||||||||||||
| 663094902 | China Everbright International, Ltd. | 12,183,629.00 | 14,133,646.00 | 26,730,000 | 3.5 | |||||||||||||
| ACI0090H8 | Zong Su Foods | 15,000,034.00 | 12,691,657.00 | 2,677 | 3.2 | |||||||||||||
| B1G1QD902 | Industrial & Commercial Bank of China | 14,742,307.00 | 12,185,297.00 | 20,630,000 | 3.1 | |||||||||||||
| 685992000 | Sun Hung Kai Properties, Ltd. | 10,292,837.00 | 11,749,628.00 | 802,000 | 3.0 | |||||||||||||
| B00G0S903 | CNOOC, Ltd. | 11,883,847.00 | 11,360,046.00 | 5,547,000 | 2.9 | |||||||||||||
| 633393905 | Enn Energy Holdings, Ltd. | 744,584.00 | 11,301,965.00 | 2,680,000 | 2.8 | |||||||||||||
| B3ZVDV905 | Sinopharm Group Co., Ltd. | 6,363,867.00 | 9,760,020.00 | 3,051,600 | 2.4 | |||||||||||||
| 99ZMCS903 | Kweichow Moutai Co., Ltd. | 8,981,307.00 | 9,751,216.00 | 251,649 | 2.4 | |||||||||||||
| 670039007 | Uni-President Enterprises Corp. | 1,609,768.00 | 9,386,747.00 | 5,291,508 | 2.3 | |||||||||||||
| 629099904 | WT Microelectronics Co., Ltd. | 8,888,527.00 | 9,196,470.00 | 7,335,530 | 2.3 | |||||||||||||
| 674842901 | Ruentex Development Co., Ltd. | 3,423,335.00 | 8,361,496.00 | 4,416,301 | 2.1 | |||||||||||||
| B2R2ZC908 | CSR Corp., Ltd. | 9,248,041.00 | 8,079,334.00 | 12,212,000 | 2.0 | |||||||||||||
| B01CT3905 | Tencent Holdings, Ltd. | 6,391,568.00 | 8,003,947.00 | 234,200 | 2.0 | |||||||||||||
| 619376908 | China Resources Land, Ltd. | 5,946,869.00 | 7,568,545.00 | 3,436,000 | 1.9 | |||||||||||||
| 17307D352 | Wuliangye Yibin Co., Ltd. | 3,118,592.00 | 7,503,148.00 | 1,403,507 | 1.9 | |||||||||||||
| B1YMYT902 | Hiwin Technologies Corp. | 9,693,067.00 | 6,914,604.00 | 942,750 | 1.7 | |||||||||||||
| 634007900 | Kunlun Energy Co., Ltd. | 6,300,267.00 | 6,850,820.00 | 3,906,000 | 1.7 | |||||||||||||
| 913BMZ902 | Ping An Insurance (Group) Company of China, Ltd. | 6,811,327.00 | 6,692,780.00 | 1,012,355 | 1.7 | |||||||||||||
| 970LGE904 | Zhengzhou Yutong Bus Co., Ltd. | 7,126,648.00 | 6,503,340.00 | 1,894,588 | 1.7 | |||||||||||||
| 626073902 | Delta Electronics Inc. | 4,550,608.00 | 6,253,177.00 | 1,615,000 | 1.6 | |||||||||||||
| 635415904 | Epistar Corp. | 7,241,934.00 | 6,199,457.00 | 2,903,000 | 1.6 | |||||||||||||
| 34415V109 | Focus Media Holding, Ltd. | 5,976,531.00 | 5,860,226.00 | 250,437 | 1.5 | |||||||||||||
| 671815900 | Qingling Motors Co., Ltd. | 7,603,282.00 | 5,541,140.00 | 24,836,000 | 1.4 | |||||||||||||
| 651795908 | Natural Beauty Bio-Technology, Ltd. | 4,906,910.00 | 5,537,622.00 | 47,710,000 | 1.4 | |||||||||||||
| 959GRNII9 | Taiwan Life Insurance Co., Ltd. 4.0% 12/28/14 | 6,178,274.00 | 5,517,595.00 | 200,000,000 | 1.4 | |||||||||||||
| 643648900 | Shenzhen International Holdings, Ltd. | 4,727,447.00 | 5,263,056.00 | 77,000,000 | 1.3 | |||||||||||||
| 17313A533 | Gree Electric Appliances, Inc. | 5,451,623.00 | 5,226,263.00 | 1,549,900 | 1.3 | |||||||||||||
| 600245005 | ASM Pacific Technology, Ltd. | 5,467,670.00 | 4,856,970.00 | 410,700 | 1.2 | |||||||||||||
| B1JNK8908 | China Coal Energy Co., Ltd. | 6,860,736.00 | 4,835,625.00 | 5,296,000 | 1.2 | |||||||||||||
| 620267906 | Advantech Co., Ltd. | 4,104,779.00 | 4,686,851.00 | 1,284,000 | 1.2 | |||||||||||||
| 644806002 | Hutchison Whampoa, Ltd. | 4,088,916.00 | 4,384,502.00 | 453,000 | 1.1 | |||||||||||||
| 643055908 | Golden Meditech Co., Ltd. | 4,555,715.00 | 4,112,225.00 | 35,040,000 | 1.0 | |||||||||||||
| 626735906 | Hong Kong Exchanges and Clearing, Ltd. | 4,018,117.00 | 3,882,669.00 | 257,100 | 1.0 | |||||||||||||
| 665157905 | Comba Telecom Systems Holdings, Ltd. | 7,565,579.00 | 3,660,347.00 | 10,958,500 | 0.9 | |||||||||||||
| 604364901 | Yantai Changyu Pioneer Wine Co., Ltd. | 5,808,831.00 | 3,392,727.00 | 688,855 | 0.9 | |||||||||||||
| B633D9904 | Zhongsheng Group Holdings, Ltd. | 3,466,065.00 | 3,323,187.00 | 2,662,000 | 0.8 | |||||||||||||
| B05LP6908 | CDW Holding, Ltd. | 932,700.00 | 2,405,881.00 | 31,724,000 | 0.6 | |||||||||||||
| B4PTR3906 | Fook Woo Group Holdings, Ltd. | 7,974,083.00 | 2,236,262.00 | 25,314,000 | 0.6 | |||||||||||||
| 631349909 | Chaoda Modern Agriculture (Holdings), Ltd. | 9,287,936.00 | 0.00 | 26,651,357 | 0.0 | |||||||||||||
| B04W2V905 | FU JI Food & Catering Services | 4,246,696.00 | 0.00 | 5,462,000 | 0.0 | |||||||||||||
| 16899C939 | China Silicon Corp. Common Stock | 1,458,811.00 | 0.00 | 2,301,863 | 0.0 | |||||||||||||
| 169999935 | China Silicon Corp., Series A Preferred | 5,171,016.00 | 0.00 | 27,418 | 0.0 | |||||||||||||
Source : State Street Bank and Trust Company as at September 30, 2012.
| 5 |
The China Fund, Inc. (CHN)
The information contained herein has been obtained from sources believed to be reliable but RCM and its affiliates do not warrant the information to be accurate, complete or reliable. The opinions expressed herein are subject to change at any time and without notice. Past performance is not indicative of future results. This material is not intended as an offer or solicitation for the purchase or sale of any financial instrument. Investors should consider the investment objectives, risks, charges and expenses of any mutual fund carefully before investing. This and other information is contained in the fund’s annual and semiannual reports, proxy statement and other fund information, which may be obtained by contacting your financial advisor or visiting the fund’s website at www.chinafundinc.com. This information is unaudited and is intended for informational purposes only. It is presented only to provide information on investment strategies and opportunities. The Fund seeks to achieve its objective through investment in the equity securities of companies and other entities with significant assets, investments, production activities, trading or other business interests in China or which derive a significant part of their revenue from China. Investing in non-U.S. securities entails additional risks, including political and economic risk and the risk of currency fluctuations, as well as lower liquidity. These risks, which can result in greater price volatility, will generally be enhanced in less diversified funds that concentrate investments in a particular geographic region. The Fund is a closed-end exchange traded management investment company. This material is presented only to provide information and is not intended for trading purposes. Closed-end funds, unlike open-end funds, are not continuously offered. After the initial public offering, shares are sold on the open market through a stock exchange, where shares may trade at a premium or a discount. Holdings are subject to change daily.
| 6 |