Attached files
| file | filename |
|---|---|
| 8-K - 8-K - BankUnited, Inc. | a12-26863_18k.htm |
Exhibit 99.1
|
|
BankUnited, Inc. |
|
|
This presentation contains forward-looking statements within the meaning of the Private Securities Litigation Reform Act of 1995 that reflect the current views of BankUnited, Inc. (“BankUnited” or “BKU”) with respect to, among other things, future events and financial performance. BankUnited generally identifies forward-looking statements by terminology such as “outlook”, “believes,” “expects,” “potential,” “continues,” “may,” “will,” “could,” “should,” “seeks,” “approximately,” “predicts,” “intends,” “plans,” “estimates,” “anticipates” or the negative version of those words or other comparable words. Any forward-looking statements contained in this presentation are based on the current plans, estimates and expectations of BankUnited. This presentation may also contain forward-looking statements in connection with BankUnited’s acquisition of Herald National Bank (“Herald”). The inclusion of any forward-looking information regarding BankUnited or Herald should not be regarded as a representation that future plans, estimates or expectations contemplated herein will be achieved. Such forward-looking statements are subject to various risks and uncertainties and assumptions relating to BKU’s and Herald’s respective operations, financial results, financial condition, business prospects, growth, strategy and liquidity. If one or more of these or other risks or uncertainties materialize, or if the underlying assumptions prove to be incorrect, actual results may vary materially from those indicated in these statements. These factors should not be construed as exhaustive. BankUnited does not undertake any obligation to publicly update or review any forward-looking statement, whether as a result of new information, future developments or otherwise. A number of important factors could cause actual results to differ materially from those indicated by the forward-looking statements. Information on these factors can be found in the most recent Annual Report on Form 10-K of BKU, and in the Quarterly Reports on Form 10-Q of BKU, filed with the Securities and Exchange Commission (the “SEC”) and available at the SEC’s website (www.sec.gov). Forward-Looking Statements |
|
|
Overview of BankUnited Company Snapshot The largest traditional independent bank in Florida(1) Florida footprint: 96 branches in 15 counties $12.7 billion of assets $5.3 billion of gross loans $8.5 billion of total deposits $49.6 million of net income for the quarter ended September 30, 2012 As of September 30, 2012. BankUnited Orlando Herald 3 |
|
|
Clean Balance Sheet The BankUnited Value Proposition 4 |
|
|
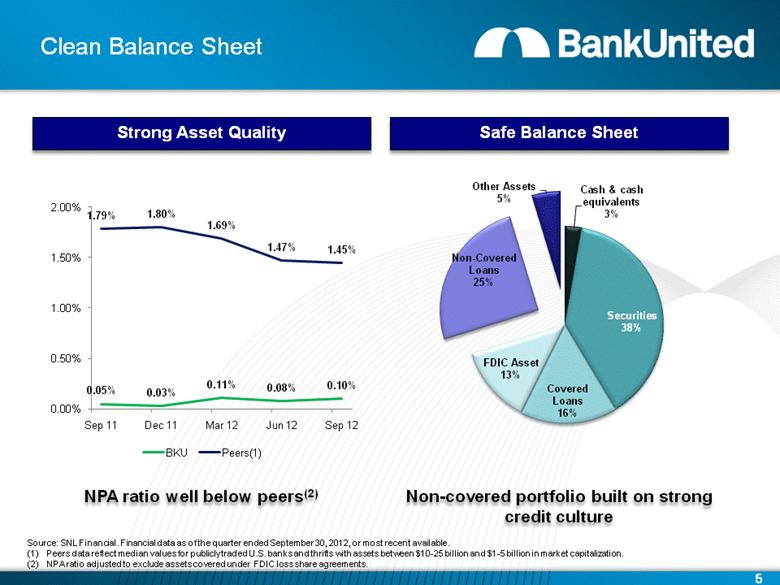
Clean Balance Sheet 5 Safe Balance Sheet Strong Asset Quality Source: SNL Financial. Financial data as of the quarter ended September 30, 2012, or most recent available. Peers data reflect median values for publicly traded U.S. banks and thrifts with assets between $10-25 billion and $1-5 billion in market capitalization. NPA ratio adjusted to exclude assets covered under FDIC loss share agreements. Non-covered portfolio built on strong credit culture NPA ratio well below peers(2) |
|
|
Clean Balance Sheet The BankUnited Value Proposition 6 Dynamic Growth Story – Fueled by Organic Growth |
|
|
Transformed Loan Portfolio $ in millions(1) Non-Covered Loans Legacy Loans and FDIC Asset $10.0 $7.9 $5.9 $5.1 UPB of Covered Loans and OREO ($BN) Balances are net of premiums, discounts, deferred fees and costs. 7 |
|
|
Our New Loan Growth has Outpaced Legacy Asset Runoff Passed Inflection Point in 3Q 2011 and Have Been Experiencing Net Loan Growth (1) ($ in billions) 8 Balances are net of premiums, discounts, deferred fees and costs. |
|
|
Transformed Deposit Base $ in billions Deposits December 31, 2009 December 31, 2010 December 31, 2011 September 30, 2012 Cost of Deposits (1) 2.18% 1.39% 0.90% 0.70% Demand Interest Checking Money Market / Savings Time Deposits Cost of deposits as of period end date. Excludes accretion of fair value adjustments on CDs and cost of interest rate swap against CD portfolio. $7.7 $7.2 $7.4 $8.5 9 |
|
|
Florida Consolidation Source: SNL Financial. Financial data as of the quarter ended September 30, 2012, or most recent available. Excludes covered loans and loans acquired from the Herald National Bank acquisition. Excludes covered loans. 10 Since the Acquisition, we have grown our Florida commercial bank franchise to approximately $2.0 billion(1) Average commercial loan portfolio for Florida banks is approximately $200 million(2) Our organic growth equivalent to 10 FL banks |
|
|
The Next Chapter: Beyond Florida 11 Opening in 2013: 299 Park Avenue 960 Avenue of the Americas 136 E 57th Street |
|
|
Clean Balance Sheet The BankUnited Value Proposition 12 Dynamic Growth Story – Fueled by Organic Growth Management Team with Strong Track Record |
|
|
Senior Executive Management Team 13 Senior Executive Previous Employers # Years in Industry John Kanas Chairman, President & CEO Capital One, North Fork 30+ John Bohlsen Chief Lending Officer Capital One, North Fork 25+ Rajinder Singh Chief Operating Officer WL Ross, Capital One, North Fork, FleetBoston 15+ Douglas Pauls Chief Financial Officer Commerce Bank 25+ Randy Melby Chief Risk Officer Washington Mutual, Wells Fargo, Norwest 25+ |
|
|
Clean Balance Sheet The BankUnited Value Proposition 14 Dynamic Growth Story – Fueled by Organic Growth Management Team with Strong Track Record Strong Performance and Capital Position |
|
|
How Do We Compare? Return on Avg Assets Return on Avg Equity Net Interest Margin Tier 1 Leverage 1.0% 1.6% 8.2% 11.4% 3.5% 5.4% 9.7% 12.9% (1) (1) (1) (1) Source: SNL Financial. Financial data as of the quarter ended September 30, 2012, or most recent available. Peers data reflect median values for publicly traded U.S. banks and thrifts with assets between $10-25 billion and $1-5 billion in market capitalization. 15 |
|
|
Clean Balance Sheet The BankUnited Value Proposition Dynamic Growth Story – Fueled by Organic Growth Management Team with Strong Track Record Strong Performance and Capital Position Healthy Regulatory Relations 16 |
|
|
Clean Balance Sheet The BankUnited Value Proposition Dynamic Growth Story – Fueled by Organic Growth Management Team with Strong Track Record Strong Performance and Capital Position Healthy Regulatory Relations The Dominant Florida Institution 17 |
|
|
Where are we headed? |
|
|
What We’ve Done Built a strong Florida-centric commercial bank on the framework of a failed thrift Became a consolidator of the Florida market one loan and one customer at a time Enhanced infrastructure to support the future growth of a healthy institution and comply with new regulatory standards Built a powerful brand in South Florida 19 |
|
|
Building Our Brand Four consecutive superior 5-star ratings from BauerFinancial Received Baa3 investment grade rating from Moody’s (October 2012) #1 on the South Florida Business Journal's list of the "Top 25 Community Banks“ (September 2012) Named among the top 20 most active lenders in the South Florida District of the Small Business Administration (July 2012) #2 financial institution in the $5 billion to $50 billion category (total assets) based on a combination of profitability, capitalization and asset quality (July 2012, Bank Director magazine) #2 on the South Florida Business Journal's list of the "Top Commercial Lenders and Brokers“ (March 2012, based on 2010 production) 20 |
|
|
Looking Ahead Continue focus on small business and middle market customers in Florida Further develop the consumer segment and diversify into select consumer asset classes Launch New York with a commercial focus Maintain trajectory of loan growth Continue focus on lowering cost of funds while growing deposits bank-wide Take advantage of industry consolidation in both markets 21 |
|
|
BankUnited, Inc. |