Attached files
| file | filename |
|---|---|
| 8-K - FORM 8-K - ASSOCIATED BANC-CORP | d441275d8k.htm |
| EX-99.2 - NEWS RELEASE DATED NOVEMBER 13, 2012 - ASSOCIATED BANC-CORP | d441275dex992.htm |
 Associated Banc-Corp
Investor Presentation
Bank of America Merrill Lynch
Banking & Financial Services Conference
November 14, 2012
Exhibit 99.1 |
 Forward-Looking Statements
Important
note
regarding
forward-looking
statements:
1
Statements made in this presentation which are not purely historical are forward-looking
statements, as defined in the Private Securities Litigation Reform Act of 1995. This includes
any statements regarding management’s plans, objectives, or goals for future operations,
products or services, and forecasts of its revenues, earnings, or other measures of
performance. Such forward-looking statements may be identified by the use of words
such as “believe”, “expect”, “anticipate”, “plan”,
“estimate”, “should”, “will”, “intend”, “outlook”,
or similar expressions. Forward-looking statements are based on current management
expectations and, by their nature, are subject to risks and uncertainties. Actual results may
differ materially from those contained in the forward-looking statements. Factors
which may cause actual results to differ materially from those contained in such
forward-looking statements include those identified in the company’s most recent Form
10-K and subsequent SEC filings. Such factors are incorporated herein by reference. |
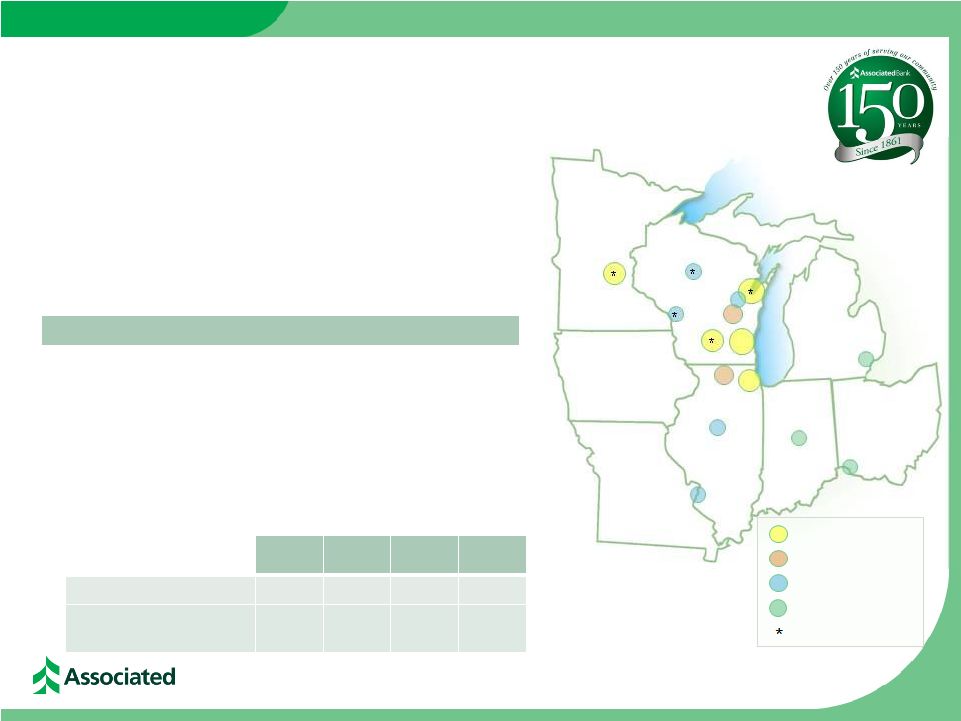 •
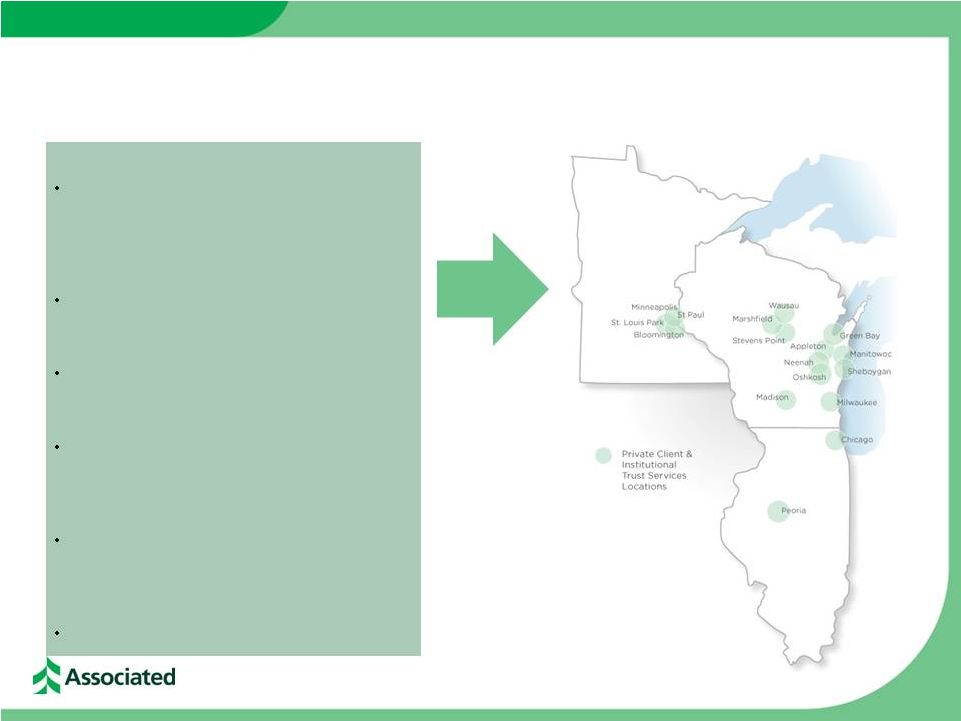
Top 50, publicly traded, U.S. bank holding company
•
$23 billion in assets; largest bank headquartered in Wisconsin
–
Over 250 banking offices serving over 150 communities
–
#1 mortgage originator in Wisconsin
–
#1
SBA
lender
in
Wisconsin
Leading Midwest Banking Franchise
1
3
FDIC market share data 6/30/12;
4
Experian State of Credit Survey 2012; FDIC market share data 6/30/12;
5
Source: U.S. BLS, State: Sept. 2012, US: Oct. 2012;
6
Source: FRB Chicago Midwest Manufacturing Index, Sept. 2012.
Operating in Attractive Midwest Markets
WI
MN
IL
U.S.
Unemployment
Rate
4
7.3%
5.8%
8.8%
7.9%
ASBC Deposits
($ in billions)
$11.5
$1.5
$3.7
$16.7
La Crosse
Green Bay
Peoria
Chicago
Madison
Rockford
Neenah
St. Louis
Milwaukee
Wausau
Appleton
Minneapolis
Indianapolis
Cincinnati
Detroit
2
2
1
•
5
of
the
top
10
cities
in
the
U.S
with
highest
credit
score
in
footprint
4
•
WI
&
MN
continue
to
show
above
average
employment
levels
5
•
Midwest
Manufacturing
output
is
up
8.5%
YoY
(vs.
3.5%
nationally)
6
•
Midwest
Machinery
output
is
up
8.1%
YoY
(vs.
3.7%
nationally)
6
Based on 2011 number of funded mortgage loans per HMDA data; ² Based on 2011 FY number of funded SBA loans;
>$1bn
deposits
>$500m
deposits
>$200m
deposits
Commercial
offices
Top
10
credit
score
4
3
3
3 |
 Third
Quarter 2012 Highlights •
Net income available to common shareholders of $45 million or $0.26 per
share •
Return on Tier 1 Common Equity of 9.7%, compared to 7.8% a year ago
Solid Quarterly Performance
Net Income
&
ROT1CE
Loan Growth
Net Interest Income
&
Net Interest Margin
•
Total loans of $15.0 billion were up $267 million, or 2% from the end of the prior
quarter –
Loan balances have increased by $1.5 billion, or 11%, from a year ago
Capital
•
Capital ratios remain very strong with a Tier 1 Common Equity ratio of
12.01% •
Current
capital
levels
are
well
in
excess
of
“well-capitalized”
regulatory
benchmarks
•
Existing capital levels are already above proposed Basel III capital levels
Deposit Growth
•
Average deposits increased by $565 million, or 4%, during the quarter
–
Deposit balances are up $1.2 billion, or 8%, from a year ago
•
Net interest income increased by $2 million from the second quarter to $156
million –
Net interest margin of 3.26%
3 |
 •
Continue to examine options for acquisitions while maintaining discipline in
pricing of any transaction •
Branch consolidation transactions with cost take-out opportunities provide
greater value in current environment •
Focused on transactions with lower tangible book value dilution and
shorter-term earn back period Capital Management Priorities and Plans
•
Focus remains on funding organic loan growth across the footprint
•
Supporting business growth initiatives and ongoing capital investments
4
1) Funding Organic Growth
2) Paying a Competitive Dividend
4) Buybacks and Redemptions
•
Completed the redemption of all $180 million of outstanding Trust preferred
securities in the past 45 days •
Announced $125 million share repurchase program to strategically
return capital to shareholders
3) Non-organic Growth Opportunities
•
Increasing quarterly dividend to $0.08/share, effective December
15
–
60% higher dividend than previous $0.05/share |
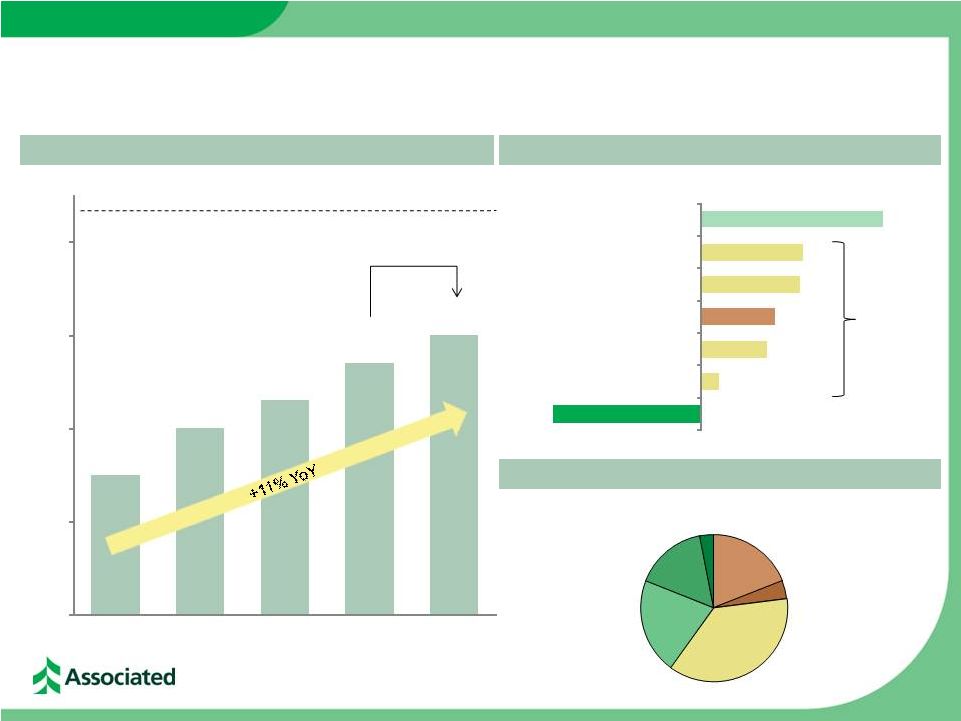 Loan
Portfolio Growth and Composition Total Loans of $15.0 billion at September 30,
2012 3Q 2012 Net Loan Growth of $267 million
Total Loans ($ in billions)
+2% QoQ
Peak Loans (4Q 2008) $16.3 billion
Loan Mix –
3Q 2012
($ balances in millions)
* General commercial loan growth presented here is net of (i.e. reduced by) $75
million Home Equity & Installment
Commercial Real Estate*
Residential Mortgage
Power & Utilities
Oil & Gas
Mortgage Warehouse
General Commercial Loans*
Total
Commercial
Loans
+3% QoQ
of loans which were migrated from investor CRE to owner-occupied during
Q3. * CRE growth shown above is inclusive of the $75 million that was
migrated as referenced above. 5
($101)
$12
$45
$50
$67
$69
$125
$13.5
$14.0
$14.3
$14.7
$15.0
$12.0
$13.0
$14.0
$15.0
$16.0
3Q 2011
4Q 2011
1Q 2012
2Q 2012
3Q 2012
CRE Investor
19%
Construction
4%
Commercial
& Business
Lending
37%
Res Mtg
21%
Home Equity
16%
Consumer
3% |
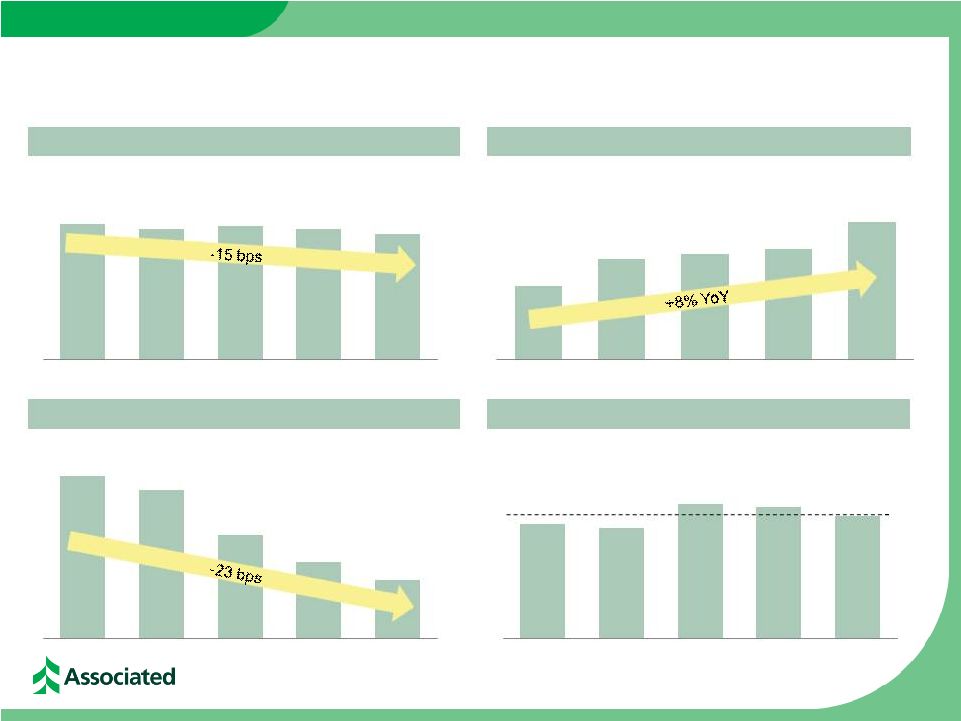 Managing the Cost of Funds & Margin
Yield on Interest-earning Assets
Cost of Interest-bearing Deposits
Average Deposits
Net Interest Margin
($ balances in billions)
6
FY2011:
3.26%
3.88%
3.81%
3.85%
3.80%
3.73%
$14.4
$14.9
$15.0
$15.1
$15.6
0.56%
0.53%
0.43%
0.37%
0.33%
3Q 2011
4Q 2011
1Q 2012
2Q 2012
3Q 2012
3.23%
3.21%
3.31%
3.30%
3.26%
3Q 2011
4Q 2011
1Q 2012
2Q 2012
3Q 2012
3Q 2011
4Q 2011
1Q 2012
2Q 2012
3Q 2012
3Q 2011
4Q 2011
1Q 2012
2Q 2012
3Q 2012 |
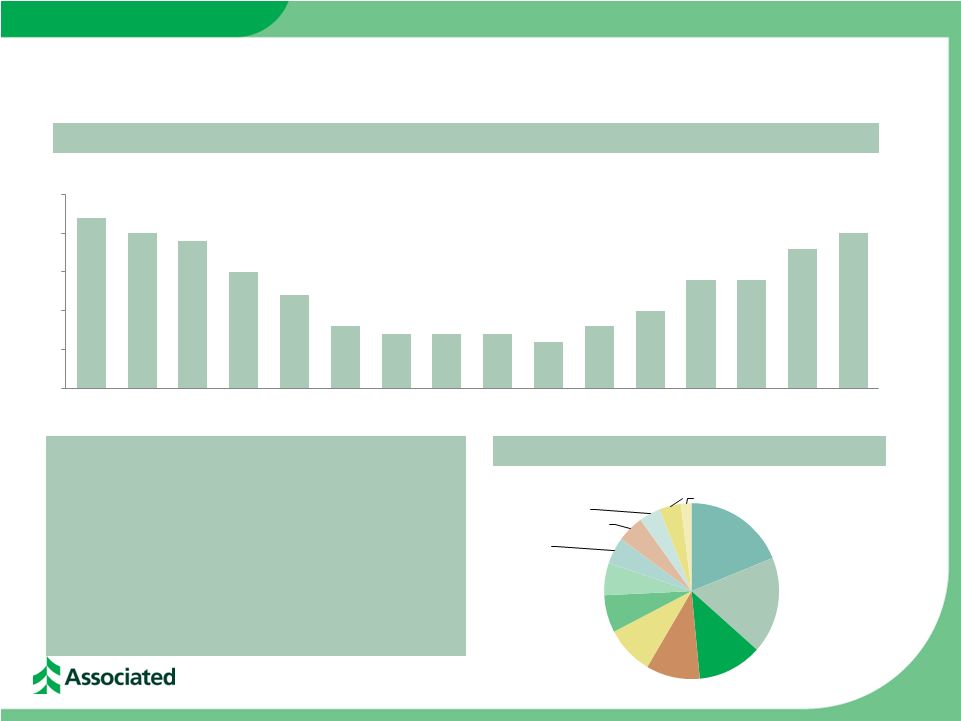 Rebuilding Commercial & Business Lending Portfolio
($ in billions)
7
Highlights
•
Over the past two years we have restored our C&I
lending efforts
•
Competitive disruptions in our markets continue to
provide opportunity for growth into 2013 •
Manufacturing sector remains the cornerstone of our
C&I lending efforts
•
Specialized lending portfolios continue to grow from a
small base
$5.7
$5.5
$5.4
$5.0
$4.7
$4.3
$4.2
$4.2
$4.2
$4.1
$4.3
$4.5
$4.9
$4.9
$5.3
$5.5
$3.5
$4.0
$4.5
$5.0
$5.5
$6.0
4Q
2008
1Q
2009
2Q
2009
3Q
2009
4Q
2009
1Q
2010
2Q
2010
3Q
2010
4Q
2010
1Q
2011
2Q
2011
3Q
2011
4Q
2011
1Q
2012
2Q
2012
3Q
2012
Manufacturing
19%
Other 18%
Finance and
Insurance 12%
Wholesale
Trade 10%
Real
Estate
9%
Retail Trade
7%
Oil & Gas 6%
Health Care and
Social Assistance
5%
Power &
Utilities 5%
Professional,
Scientific, and
Technical Services
4%
Rental and
Leasing Services
4%
Transportation and
Warehousing 2%
CB&L
Loans
by
Industry
–
3Q
2012
Commercial & Business Lending Loans |
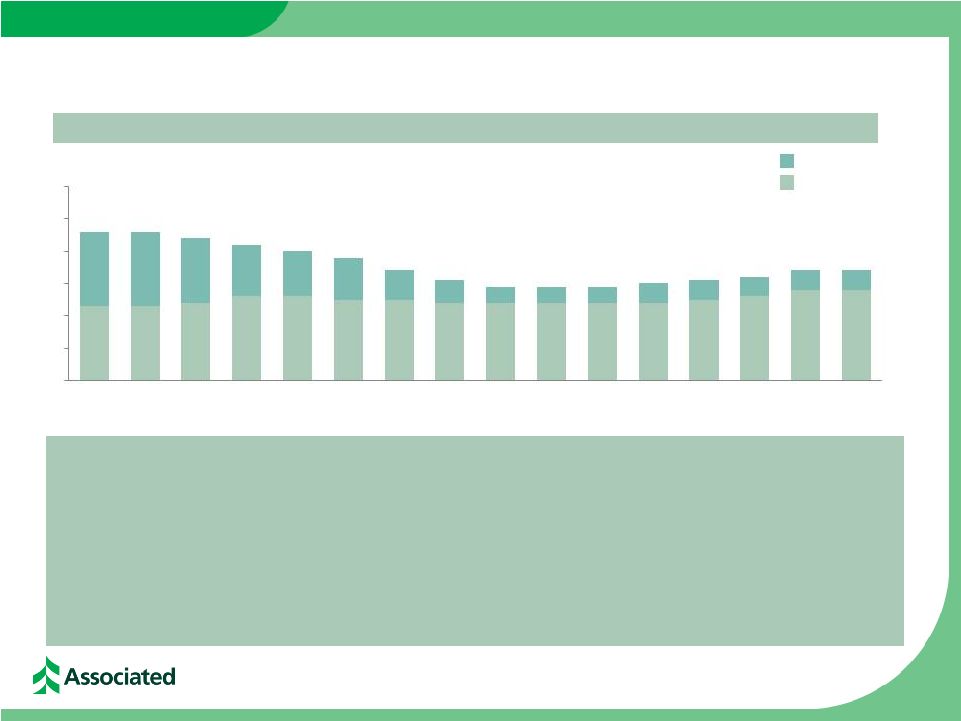 Rebuilding Commercial Real Estate Lending Portfolio
($ in billions)
Highlights
•
Over
the
past
several
years
we
have
refocused
our
CRE
efforts
to
emphasize
in-footprint
and
lower
risk
asset
classes
•
Commercial
real
estate
lending
balances
bottomed
out
in
2010
and
have
grown
by
$500
million
since
early
2011,
•
We see continued opportunity to grow commercial real estate in the Upper Midwest
given current market and pricing •
We have added commercial real estate LPO teams in Michigan, Indiana, and Ohio to
provide better regional Commercial Real Estate Lending Loans
8
Construction
CRE
$4.6
$4.6
$4.4
$4.2
$4.0
$3.8
$3.4
$3.1
$2.9
$2.9
$2.9
$3.0
$3.1
$3.2
$3.4
$3.4
$0.0
$1.0
$2.0
$3.0
$4.0
$5.0
$6.0
4Q
2008
1Q
2009
2Q
2009
3Q
2009
4Q
2009
1Q
2010
2Q
2010
3Q
2010
4Q
2010
1Q
2011
2Q
2011
3Q
2011
4Q
2011
1Q
2012
2Q
2012
3Q
2012
however they remain $1.2 billion below peak at 4Q 2008
dynamics
diversification to the portfolio |
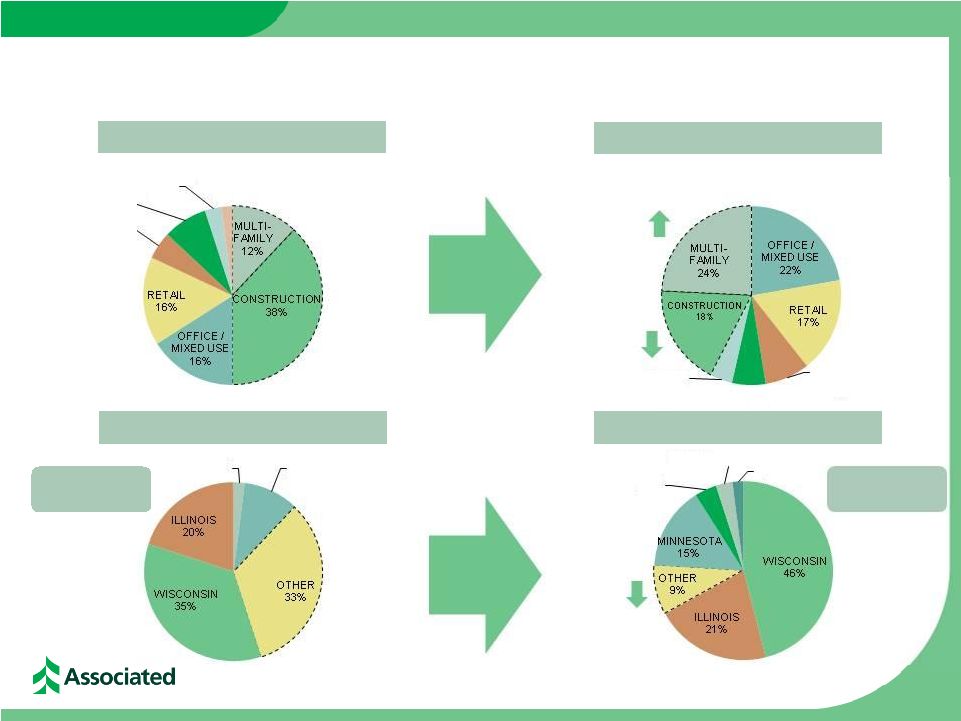 Refocused Commercial Real Estate Activities
9
CRE
/
Construction
–
3Q
2009
CRE
/
Construction
–
3Q
2012
CRE
/
Construction
–
3Q
2009
CRE
/
Construction
–
3Q
2012
67%
“In-footprint”
INDUSTRIAL
5%
OTHER
8%
HOTEL /
MOTEL
3%
SINGLE
FAMILY /
CONDO
2%
INDUSTRIAL
OTHER
HOTEL /
MOTEL
4%
8%
6%
OHIO
4%
MISSOURI
3%
INDIANA
2%
91%
“In-footprint”
MISSOURI
2%
MINNESOTA
10% |
 Enhanced Private Client & Institutional Services
10
Hired new Director of Trust (based in
Milwaukee) & Director of Private Banking
(based in Chicago) in order to drive business
growth
New hire strategy focused on team lift-outs
across the footprint (Minneapolis & Chicago)
Created dedicated Private Banking credit team
led by an experienced credit manager
Product and service enhancements for affluent
client base and specialty niches (law &
accounting firm partners)
Strengthening cross-line partnerships between
Trust, Private Banking, Insurance & Commercial
Banking
Over $6.2 billion of assets under management
Highlights |
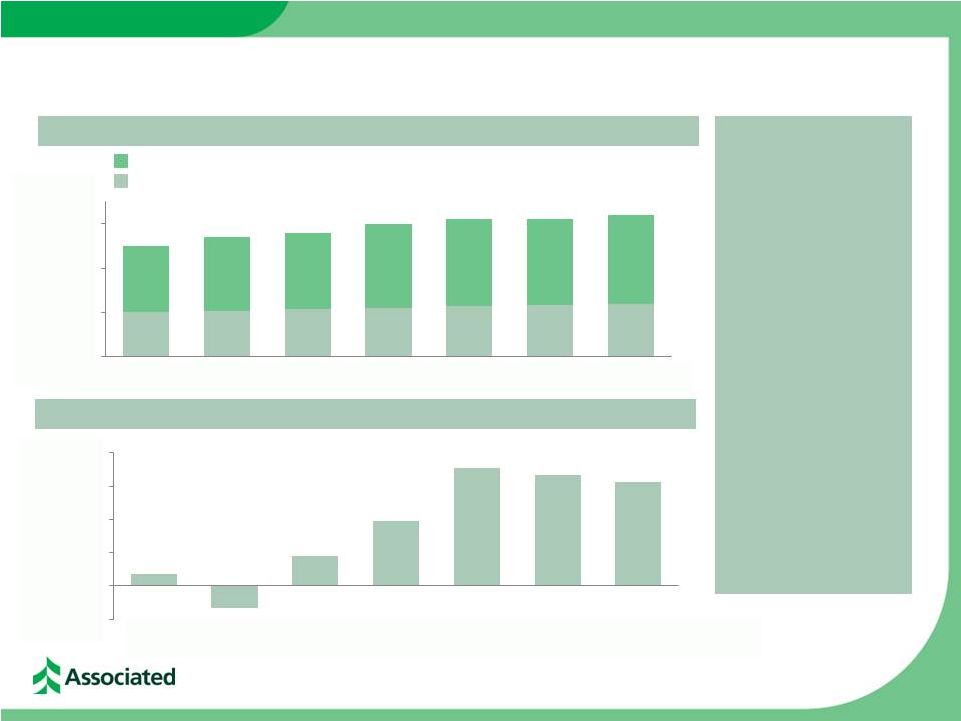 Strong Mortgage Banking Business
11
Residential Mortgage Loan Portfolio
($ in billions)
Net Mortgage Banking Revenues
($ in millions)
Highlights
•
•
•
•
15-year fixed
Hybrid ARMs (3/5/7)
$2.5
$2.7
$2.8
$3.0
$3.1
$3.1
$3.2
$0.0
$1.0
$2.0
$3.0
1Q 2011
2Q 2011
3Q 2011
4Q 2011
1Q 2012
2Q 2012
3Q 2012
$2
-$3
$5
$10
$18
$17
$16
-$5
$0
$5
$10
$15
$20
1Q 2011
2Q 2011
3Q 2011
4Q 2011
1Q 2012
2Q 2012
3Q 2012
Opened new channels
and expanded into
additional markets
Retaining primarily
hybrid ARMs on balance
sheet as well as ~$1.2
billion of 15-year fixed
product
Selling substantially all
30-year production
Associated remains the
#1 mortgage lender in
Wisconsin (by units &
dollar volume) |
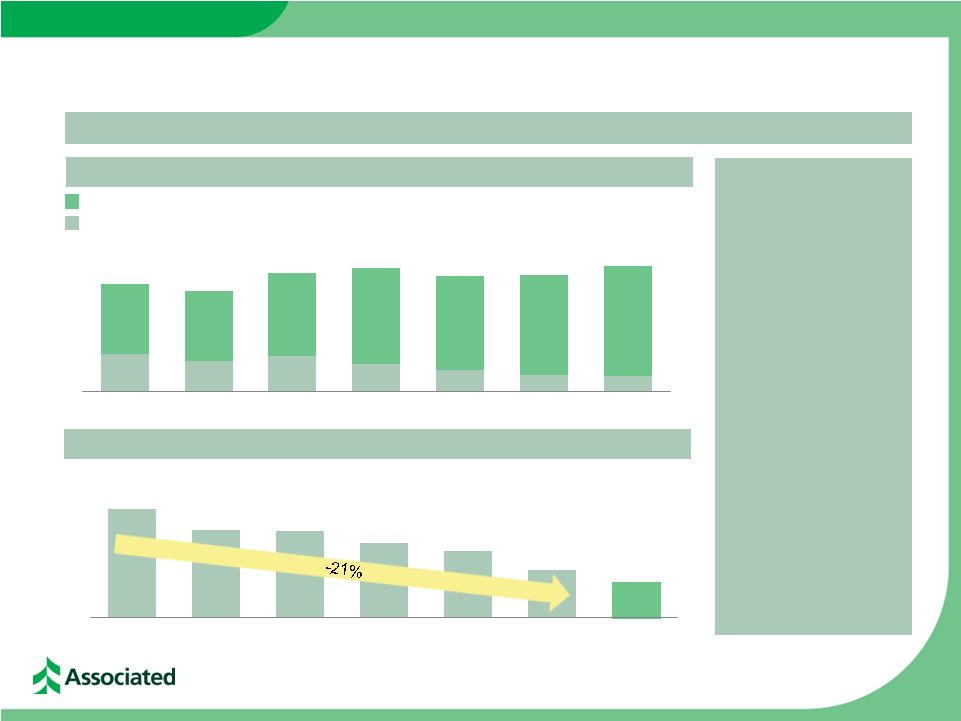 Refinement of Branch Strategy
12
($ in billions)
Non-maturity deposits
Time Deposits
Increasing Deposit Base while Optimizing Traditional Retail Network
Total Deposits & Customer Funding
$15.0
$14.0
$16.6
$17.2
$16.1
$16.3
$17.5
2Q 2007
2Q 2008
2Q 2009
2Q 2010
2Q 2011
2Q 2012
3Q 2012
Number of Branches
315
293
291
279
270
250
238
2Q 2007
2Q 2008
2Q 2009
2Q 2010
2Q 2011
2Q 2012
Pro
forma
-
Highlights
•
Deposits & customer
funding have grown by
$2.5 billion since 2007
•
At the same time, the
total branch count has
been reduced by over
20%
•
Announced plans to
consolidate an
additional 12 branches
in early 2013
•
Planned reformatting of
4 additional full-service
branches to lower cost
delivery channels
•
Focused on continually
evaluating efficiencies
of the branch network
and reviewing branch
delivery channels
|
 Footprint Update
13
Example small-format teller line
Continuing To Invest In Our Branches While Optimizing Our Network
Completed the remodel,
relocation, or new
construction of over 30
branches in 2011
50 remodels planned in
2012; completed ~40
branches YTD 2012
YTD 2012 PPE expense
of $59 million includes
ongoing investments in
franchise
Consolidated 21
branches in 1H2012 and
sold three additional
outlying branches in
Jan. 2012
Example in-store remodel
Example small-format teller line
Example traditional remodel
Highlights
Consolidating HQ in
downtown Green Bay
Consolidating Chicago
commercial teams |
 Continued Improvement in Credit Quality Indicators
($ in millions)
3Q 2011
4Q 2011
1Q 2012
2Q 2012
3Q 2012
Potential problem loans
$ 660
$ 566
$ 480
$ 410
$ 404
Nonaccruals
$ 403
$ 357
$ 327
$ 318
$ 278
Provision for loan losses
$ 4
$ 1
$ 0
$ 0
$ 0
Net charge offs
$ 30
$ 23
$ 22
$ 24
$ 18
ALLL/Total loans
2.96%
2.70%
2.50%
2.26%
2.11%
ALLL/Nonaccruals
99.09%
105.99%
108.93%
104.65%
113.29%
NPA/Assets
2.03%
1.82%
1.65%
1.62%
1.38%
Nonaccruals/Loans
2.99%
2.54%
2.29%
2.16%
1.86%
NCOs / Avg Loans
0.90%
0.64%
0.61%
0.65%
0.47%
14 |
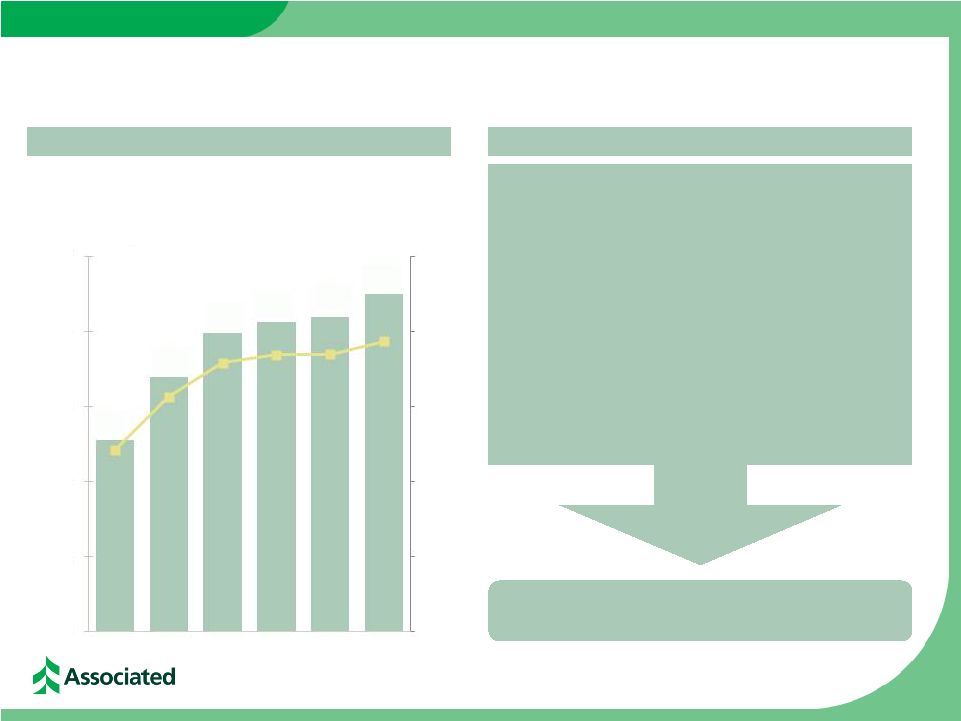 Why
Associated 15
Net Income
Available to
Common
($ in millions)
Return on Tier 1
Common Equity
Reasons to Invest
Net Income Available to Common & ROT1CE
Management Team Focused on Creating
Long-Term Shareholder Value
•
Leading Midwest Bank Operating in
Attractive Markets
•
Core Organic Growth Opportunity
•
Disciplined Deposit Pricing & Stable Margin
•
Improving Credit Quality
•
Strong Capital Profile Above Basel III
Expectations & Opportunities for Capital
Deployment
•
Improving Earnings Profile
$26
$34
$40
$41
$42
$45
6.1%
7.8%
9.0%
9.2%
9.3%
9.7%
0.00%
2.50%
5.00%
7.50%
10.00%
12.50%
$0
$10
$20
$30
$40
$50
2Q 2011
3Q 2011
4Q 2011
1Q 2012
2Q 2012
3Q 2012 |
 Associated
Banc-Corp will be the most admired Midwestern financial services company, distinguished by
sound, value-added financial solutions with personal service for our customers, built upon a
strong commitment to our colleagues and the communities we serve, resulting in exceptional value
for our shareholders. |
 Appendix
17 |
 18
3Q 2011
4Q 2011
1Q 2012
2Q 2012
3Q 2012
ASBC Capital Ratios
TCE /TA
8.77%
8.84%
9.01%
8.99%
8.91%
Leverage Ratio
9.62%
9.81%
10.03%
9.95%
9.99%
Tier 1 Common Ratio
12.44%
12.24%
12.49%
12.04%
12.01%
Tier 1 Ratio
14.35%
14.08%
14.33%
13.64%
13.57%
Total Capital Ratio
15.81%
15.53%
15.78%
15.08%
15.00%
ABNA Capital Ratios
Leverage Ratio
10.35%
10.56%
10.70%
10.85%
10.65%
Tier 1 Ratio
15.57%
15.23%
15.40%
14.92%
14.69%
Total Capital Ratio
16.84%
16.50%
16.67%
16.18%
15.95%
Maintaining a Strong Capital Profile |
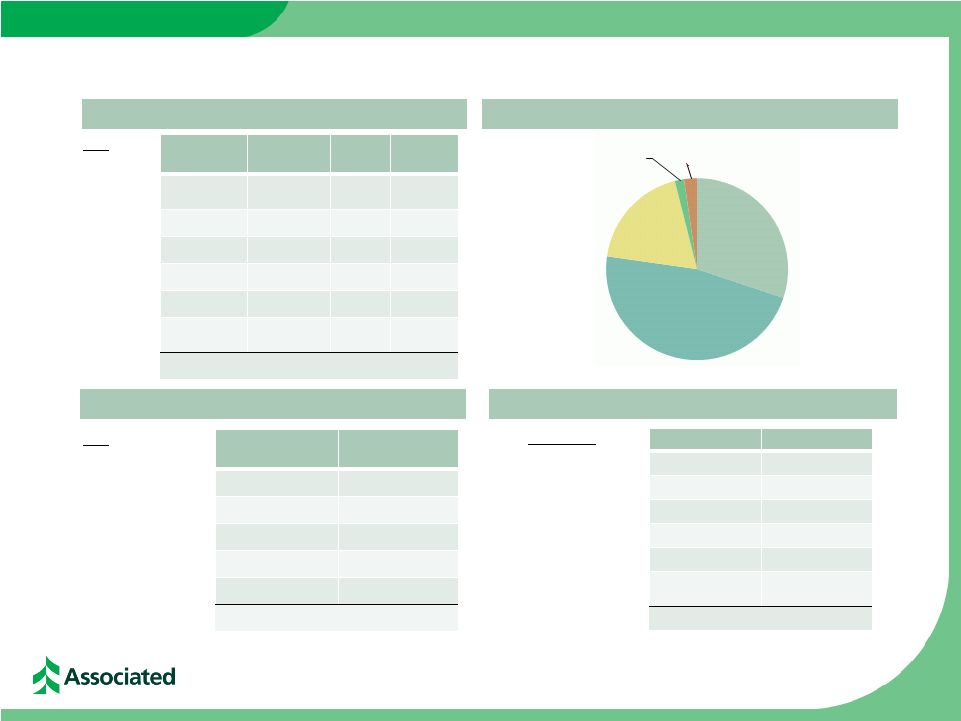 High
Quality Investment Securities Portfolio Market Value Composition –
September 30, 2012
Investment Portfolio –
September 30, 2012
Portfolio Composition Ratings –
September 30, 2012
Risk –
Weighted Profile –
September 30, 2012
Credit Rating
Mkt Value (000’s)
% of Total
Govt & Agency
$ 3,559,632
79%
AAA
14,728
---
AA
778,184
17%
A
136,415
3%
BAA1, BAA2 & BAA3
14,237
---
BA1 & Lower and
Non-rated
14,725
---
TOTAL
$4,517,921
100%
Type
Mkt Value
(000’s)
% of Total
0% RWA
$ 80,684
2%
20% RWA
4,160,596
92%
50% RWA
25,855
1%
=>100% RWA
92,200
2%
Not subject to RW
158,586
3%
TOTAL
$4,517,921
100%
Type
Bk Value
(000’s)
Mkt Value
(000’s)
TEY
(%)
Duration
(Yrs)
Govt &
Agencies
$ 1,010
$ 1,011
0.30
1.88
MBS
2,043,149
2,134,182
3.37
2.47
CMOs
1,338,377
1,356,338
2.66
1.25
CMBS
71,965
74,725
2.70
7.37
Municipals
801,180
848,894
5.50
4.67
Corporates &
Other
101,525
102,771
1.79
1.12
TOTAL AFS
$4,357,206
$4,517,921
3.50
2.41
19
CMOs
30%
MBS
47%
Municipals
19%
CMBS
2%
Corporates
2% |
 20
Consumer Loan Portfolios by Geography
(as of September 30, 2012)
Residential Mortgage Loans by State
Home Equity Loans by State
Approximately half of home equity
portfolio is in first-lien position
WISCONSIN
51%
ILLINOIS 32%
MINNESOTA
10%
MISSOURI
4%
OTHER 3%
WISCONSIN 71%
ILLINOIS 16%
MINNESOTA
11%
OTHER 2% |
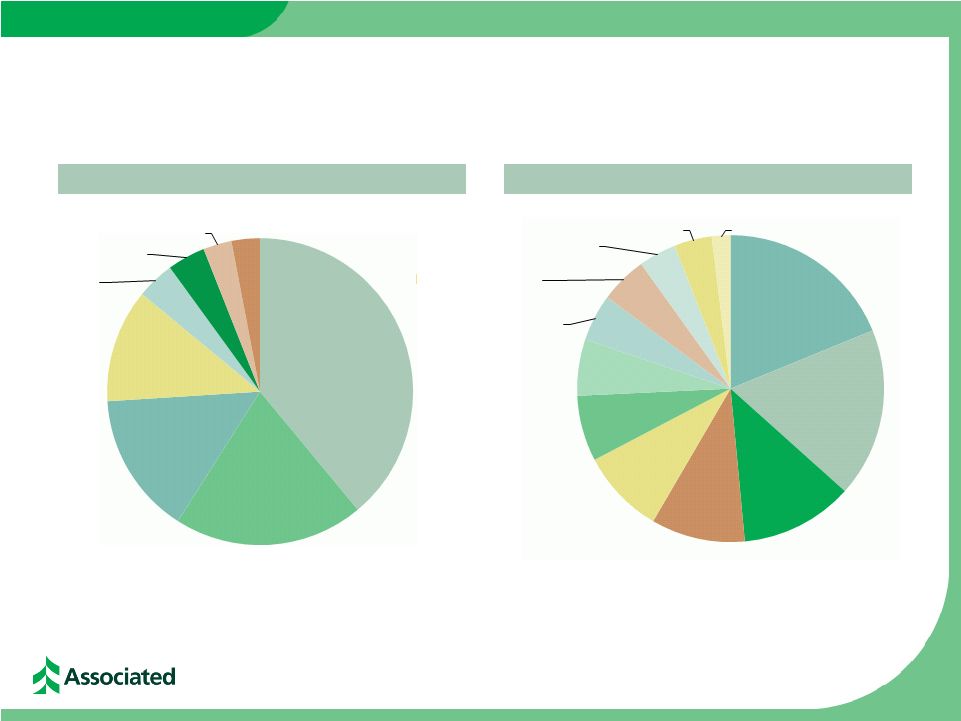 21
Commercial & Business Lending Loans
(as of September 30, 2012)
Commercial & Business Lending Loans by State
Commercial & Business Lending Loans by Industry
NEW YORK
4%
TEXAS 4%
NORTH
CAROLINA
3%
CALIFORNIA
3%
Health Care and
Social Assistance
5%
Power & Utilities 5%
Professional,
Scientific, and
Technical Services
4%
Rental and Leasing
Services 4%
Transportation and
Warehousing 2%
WISCONSIN
39%
ILLINOIS 20%
MINNESOTA
15%
OTHER 12%
Manufacturing 19%
Other 18%
Finance and
Insurance
12%
Wholesale
Trade 10%
Real Estate
9%
Retail Trade 7%
Oil & Gas 6% |
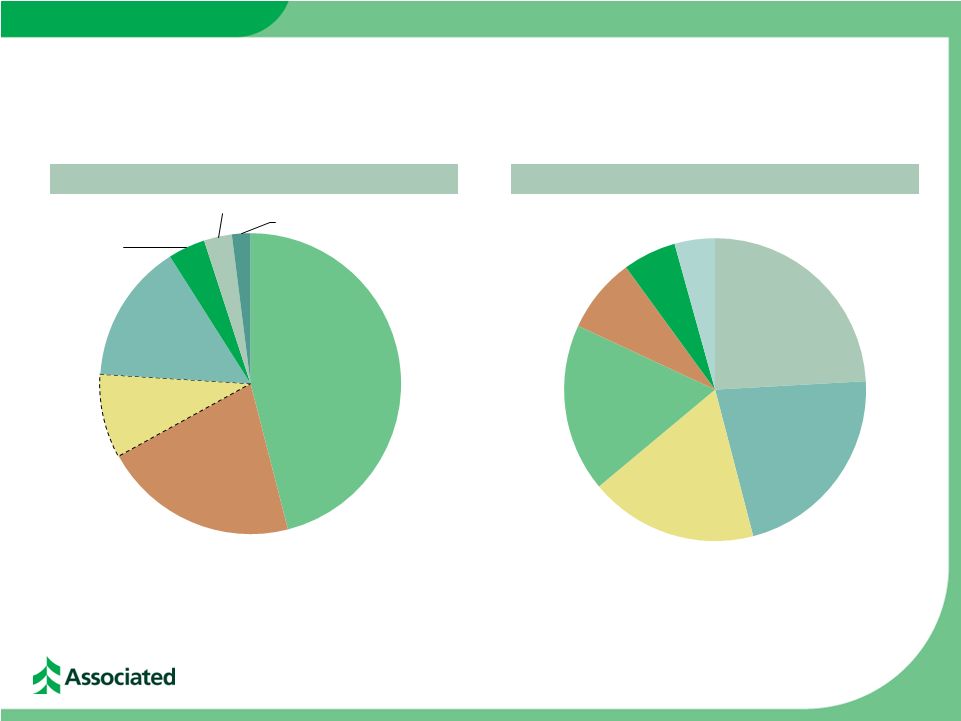 Commercial Real Estate Lending Loans
(as of September 30, 2012)
22
WISCONSIN
46%
ILLINOIS
21%
OTHER
9%
MINNESOTA
15%
OHIO
4%
MISSOURI
3%
INDIANA
2%
MULTI
FAMILY 24%
OFFICE/MIXED USE
22%
RETAIL 18%
CONSTRUCTION
18%
INDUSTRIAL 8%
OTHER 6%
HOTEL/MOTEL 4%
Commercial Real Estate Lending Loans by State
Commercial Real Estate Lending Loans by Collateral
- |