Attached files
| file | filename |
|---|---|
| 8-K - CURRENT REPORT - AMERICAN ELECTRIC POWER CO INC | d438470d8k.htm |
 47th EEI
Financial Conference
Handout
Phoenix, AZ
November 12-13, 2012
Exhibit 99.1 |
 2
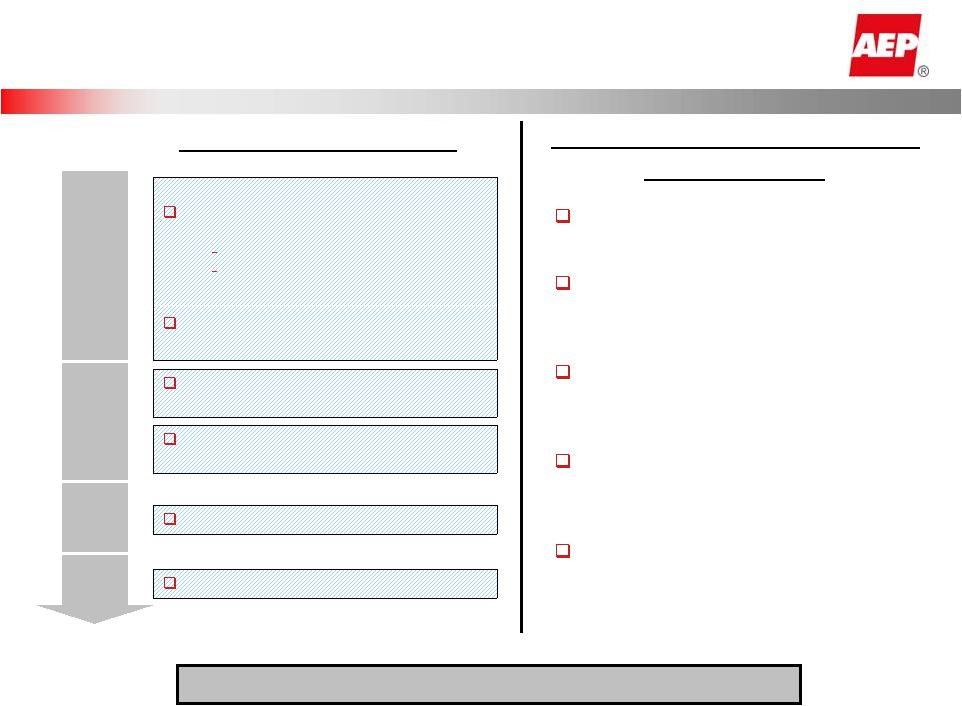
Investor Relations Contacts
Chuck Zebula
Treasurer
SVP Investor Relations
614-716-2800
cezebula@aep.com
“Safe Harbor”
Statement under the Private
Securities Litigation Reform Act of 1995
Bette Jo Rozsa
Managing Director
Investor Relations
614-716-2840
bjrozsa@aep.com
Julie Sherwood
Director
Investor Relations
614-716-2663
jasherwood@aep.com
Sara Macioch
Analyst
Investor Relations
614-716-2835
semacioch@aep.com
This presentation contains forward-looking statements within the meaning of Section 21E of the
Securities Exchange Act of 1934. Although AEP and each of its Registrant Subsidiaries
believe that their expectations are based on reasonable assumptions, any such statements may be
influenced by factors that could cause actual outcomes and results to be materially different
from those projected. Among the factors that could cause actual results to differ materially from those in the forward-looking statements are: the economic climate and growth in, or
contraction within, our service territory and changes in market demand and demographic patterns,
inflationary or deflationary interest rate trends, volatility in the financial markets, particularly
developments affecting the availability of capital on reasonable terms and developments impairing our
ability to finance new capital projects and refinance existing debt at attractive rates, the
availability and cost of funds to finance working capital and capital needs, particularly during
periods when the time lag between incurring costs and recovery is long and the costs are
material, electric load, customer growth and the impact of retail competition, particularly in Ohio,
weather conditions, including storms, and our ability to recover significant storm restoration
costs through applicable rate mechanisms, available sources and costs of, and transportation for,
fuels and the creditworthiness and performance of fuel suppliers and transporters,
availability of necessary generating capacity and the performance of our generating plants, our
ability to resolve cost-related issues regarding I&M’s Donald C. Cook Nuclear Plant Unit 1
restoration and outage through warranty, insurance and the regulatory process, our ability to
recover increases in fuel and other energy costs through regulated or competitive electric rates,
our ability to build or acquire generating capacity, and transmission line facilities (including our
ability to obtain any necessary regulatory approvals and permits) when needed at acceptable
prices and terms and to recover those costs (including the costs of projects that are cancelled)
through applicable rate cases or competitive rates, new legislation, litigation and government
regulation including oversight of nuclear generation, energy commodity trading and new or heightened
requirements for reduced emissions of sulfur, nitrogen, mercury, carbon, soot or particulate
matter and other substances or additional regulation of fly ash and similar combustion products that could impact the continued operation and cost recovery of our plants and
related assets, evolving public perception of the risks associated with fuels used before,
during and after the generation of electricity, including nuclear fuel, a reduction in the federal
statutory tax rate could result in an accelerated return of deferred federal income taxes to
customers, timing and resolution of pending and future rate cases, negotiations and other
regulatory decisions including rate or other recovery of new investments in generation, distribution
and transmission service and environmental compliance, resolution of litigation, our ability
to constrain operation and maintenance costs, our ability to develop and execute a strategy
based on a view regarding prices of electricity, coal, natural gas and other energy-related
commodities, , prices and demand for power that we generate and sell at wholesale, changes in
technology, particularly with respect to new, developing or alternative sources of generation,
our ability to recover through rates or market prices any remaining unrecovered investment in
generating units that may be retired before the end of their previously projected useful lives,
volatility and changes in markets for electricity, natural gas, and other energy-related
commodities, changes in utility regulation, including the implementation of ESPs and the transition to
market and expected legal separation for generation in Ohio and the allocation of costs within
regional transmission organizations, including PJM and SPP, our ability to successfully manage
negotiations with stakeholders and obtain regulatory approval to terminate or amend the
Interconnection Agreement, changes in the creditworthiness of the counterparties with whom we
have contractual arrangements, including participants in the energy trading market, actions of rating
agencies, including changes in the ratings of our debt, the impact of volatility in the capital
markets on the value of the investments held by our pension, other postretirement benefit plans, captive insurance entity and nuclear decommissioning trust and the impact on future
funding requirements, accounting pronouncements periodically issued by accounting standard-setting
bodies and other risks and unforeseen events, including wars, the effects of terrorism
(including increased security costs), embargoes, cyber security threats and other catastrophic events.
|
 3
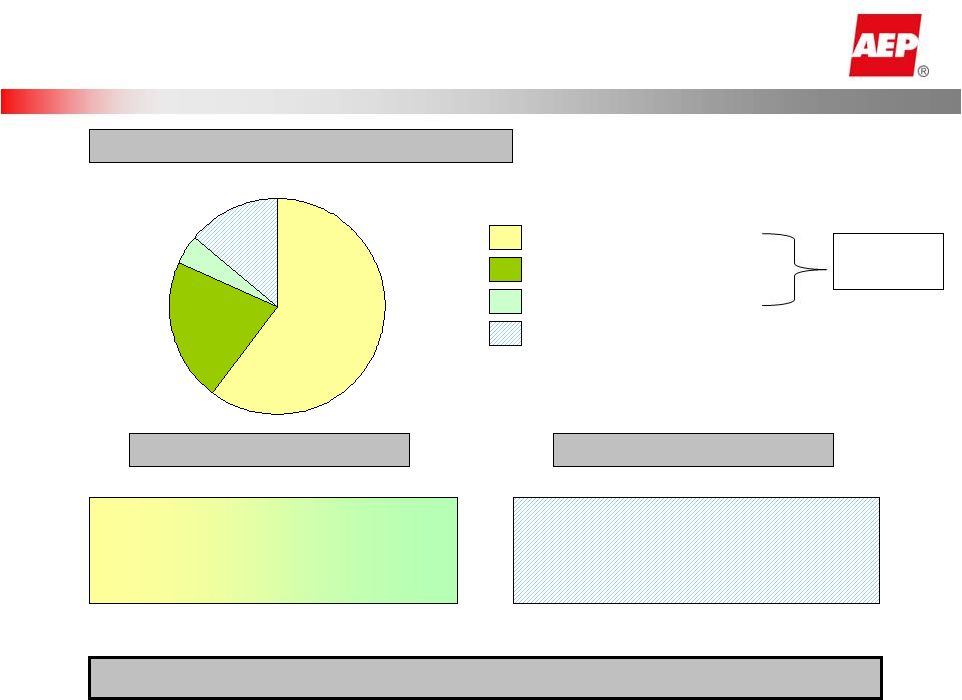
$2.4B,
4%
$33.1B,
61%
$7.6B,
14%
$11.7B,
21%
Projected YE 2014, TOTAL ASSETS
Prudently invest capital for customers
Allocate capital with ROE emphasis
Platform grows earnings 4-6%
Build competitive platform
Manage risks to match regulated profile
Well-positioned generation assets
86% of AEP’s assets are rate regulated
Competitive Objectives
Vertically Integrated Utilities
Competitive Segment
Transcos and Joint Ventures
Wires Only Utilities
86% Rate
Regulated
Regulated Objectives
Framing up the Business: Segment Assets |
 4
$1.3
$2.6
$4.1
$5.3
$0.4
$0.8
$1.0
$1.3
$0.9
$1.7
$2.3
$2.1
$4.3
$6.8
$8.9
$0.4
$0
$1
$2
$3
$4
$5
$6
$7
$8
$9
$10
2012E
2013E
2014E
2015E
Regulated Business Growth
Cumulative Change in Regulated Net PP&E
Vertically Integrated Utilities
D and G rate adjustments via base
rate cases with certain tracker
mechanisms for environmental and
reliability investments. T Rate
recovery via trackers in TN, VA, MI.
Others in base rates. ROEs range
from 10.0% to 10.9%.
Transcos
Transcos: Rate recovery via
FERC formula rates. ROEs
11.49% (PJM) / 11.20% (SPP)
Note: 2012 annual regulated depreciation is $1.1B; Transmission
JV investments, other than
Transource, are not reflected above as the ventures are not consolidated on
AEP’s financial statements
2011 Net Regulated PP&E = $32B
6.3% CAGR in Net Regulated PP&E
Wires Companies
TX Wires and Ohio Power Wires.
Rate recovery via trackers or
TCOS in OH and TX. ROEs
range from 9.96% to 11.49%.
Growth in regulated PP&E supports overall earnings growth of 4-6%
|
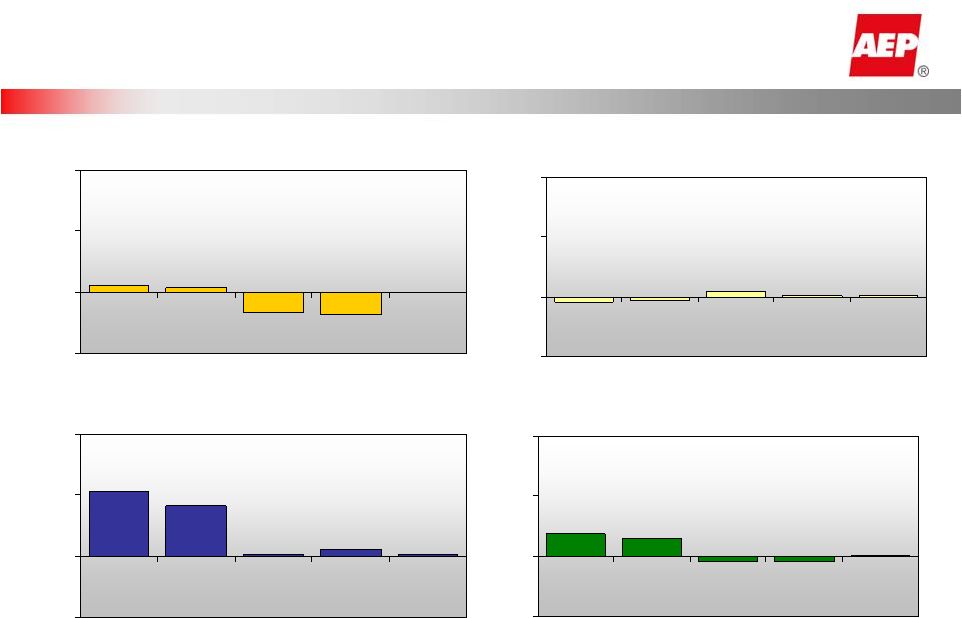 5
0.1%
-0.4%
-0.4%
1.5%
1.9%
-5%
0%
5%
10%
2010A
2011A
YTD12
2012E
2013E
0.6%
0.4%
-1.7%
-1.9%
0.0%
-5%
0%
5%
10%
2010A
2011A
YTD12
2012E
2013E
-0.4%
-0.3%
0.5%
0.1%
0.1%
-5%
0%
5%
10%
2010A
2011A
YTD12
2012E
2013E
5.3%
4.1%
0.2%
0.6%
0.2%
-5%
0%
5%
10%
2010A
2011A
YTD12
2012E
2013E
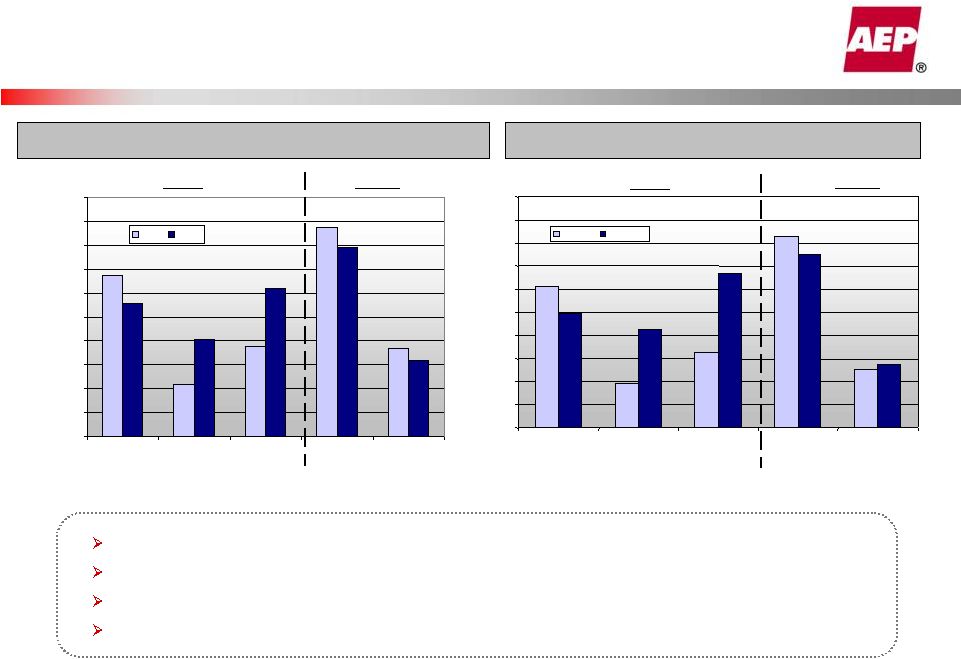
AEP Residential Normalized GWh Sales
%Change vs. Prior Year
AEP Commercial Normalized GWh Sales
%Change vs. Prior Year
AEP Industrial Normalized GWh Sales
%Change vs. Prior Year
AEP Total Normalized GWh Sales
%Change vs. Prior Year
Note: Charts reflect connected load and exclude firm wholesale load & Buckeye
Power backup load. Normalized Retail Load Trends |
 6
O&M Discipline
Organizational and process
optimization evaluation, including five
‘deep dive’
areas of focus
–
Finance & Accounting
–
Information Technology
–
Procurement/Supply Chain
–
Generation
–
Organizational Effectiveness
Benefits evaluation to align AEP’s
benefits with other companies in the
sector
Analysis complete in the fourth
quarter of 2012 including
development of an integrated plan
and a roadmap for implementation
Management will discuss the results
with the financial community in the
first quarter of 2013
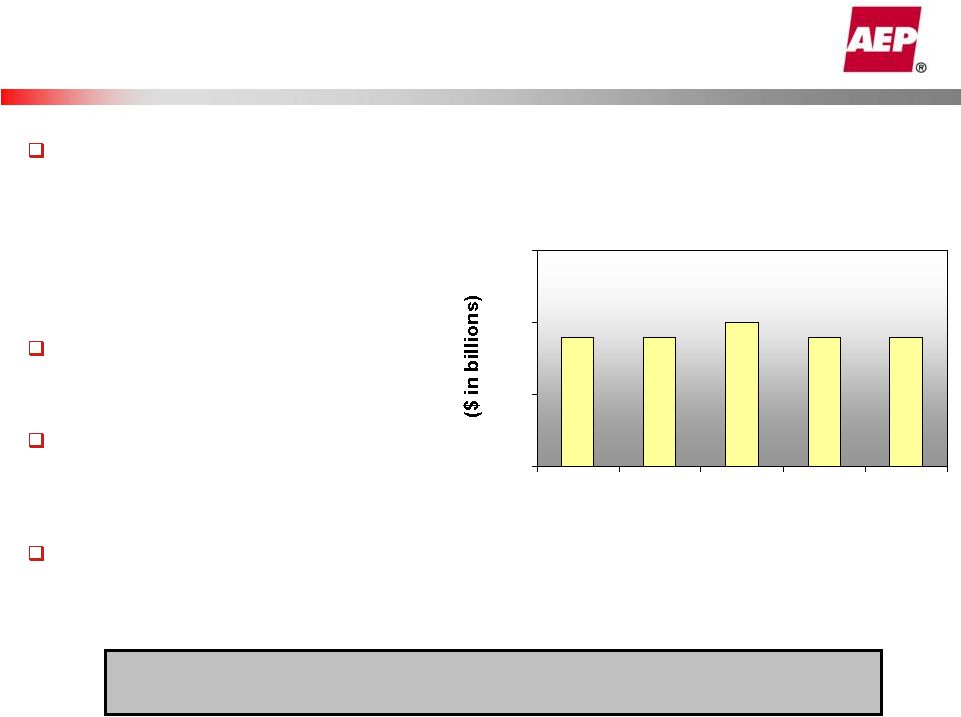
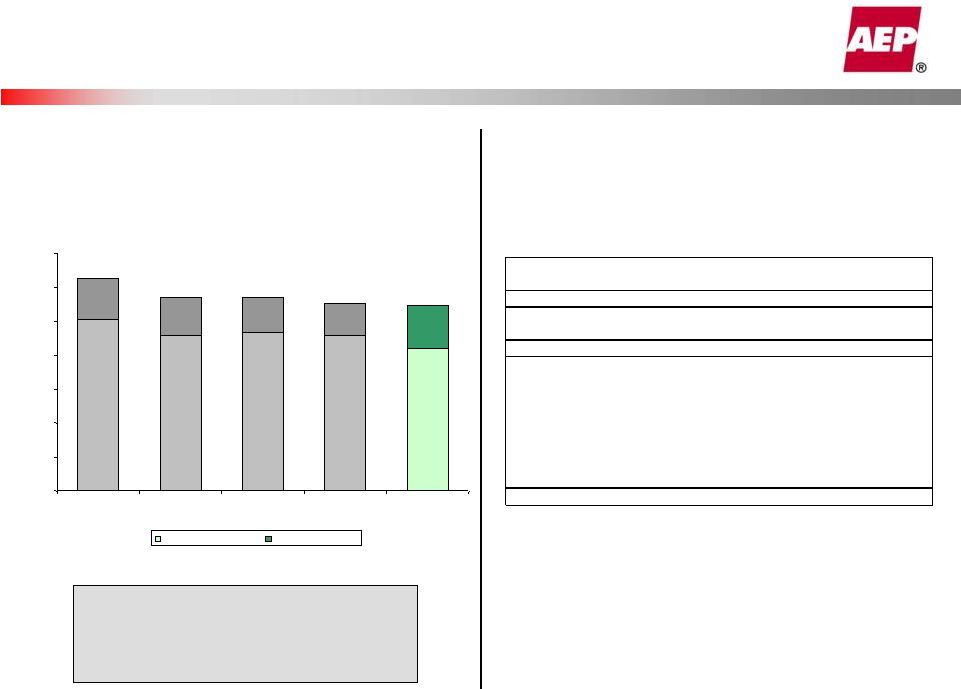
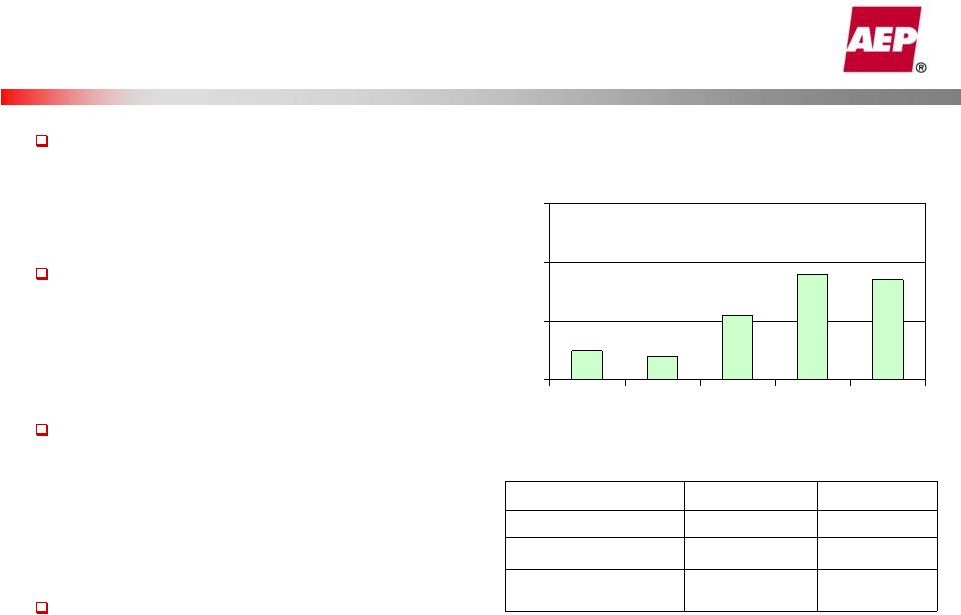
Utility Operations O&M
$3.4
$3.4
$3.5
$2.5
$3.0
$3.5
$4.0
2009A
2010A
2011A
2012E
2013E
Utility Operations O&M expected to remain essentially flat from
2012 to 2013
2012/2013 O&M range
of $3.3 -
3.4B |
 7
Pending Rate Changes
SWEPCO –
Louisiana: Formula Rate Plan
Filed a request for a 4 year extension of its formula rate update plan, to
include years 2011-
2014. This would encompass recovery for Stall and Turk.
Status:
Docket U-32220;
Staff testimony will be filed November 9, 2012,
Company rebuttal due November 20, hearings scheduled for November 28-
29, and approval is expected in January 2013.
$ in millions
Company
I&M - Indiana
Request
Intervenor Testimony
Rate increase
$140.4
$28
Rate base/investment
$2,391.6
$2,324.5
Return on equity
11.15%
9.20%
Equity component
42.67%
41.956%
Status:
Docket No. 44075. Case filed on September 23, 2011. Hearing on
Case in Chief held February 20 - March 2, 2012. Intervenor testimony filed April
27, 2012. Rebuttal testimony filed May 25, 2012. Hearing held in June 2012.
Anticipate order in 2012.
$ in millions
SWEPCO -
Texas
Company Request
Intervenor/Staff
Testimony
Rate increase
$83.1
n/a
Rate base/investment
$1,199.3
Return on equity
11.25%
Equity component
49.10%
Status:
Docket No. 40443. Case filed on July 27, 2012. Intervenor testimony
due December 10, 2012. Staff testimony due December 17, 2012. Hearing
begins February 3, 2013. Order expected in May 2013, with rates going into
effect retroactive to January 29, 2013. |
 8
Transmission Investment Opportunities
Transmission Operations
Capital/JV Equity and EPS Forecast
Transcos
–
11.49% (PJM) / 11.20% (SPP)
ETT
–
9.96%
Prairie
Wind
–
12.8%
2013 Transco
Capital/JV
Contributions
-
$601M
($ in millions)
Authorized ROEs
Ohio, $308
Other
Transcos, $7
Oklahoma,
$100
Joint
Ventures,
$58
Indiana/
Michigan,
$128
Remain on-track to meet investment goals
$432
$601
$716
$718
$0.08
$0.28
$0.14
$0.35
$0
$100
$200
$300
$400
$500
$600
$700
$800
2012E
2013E
2014E
2015E
$0.00
$0.05
$0.10
$0.15
$0.20
$0.25
$0.30
$0.35
$0.40
$0.45
$0.50
Transco Capital/JV Equity Contributions
EPS Contribution |
 9
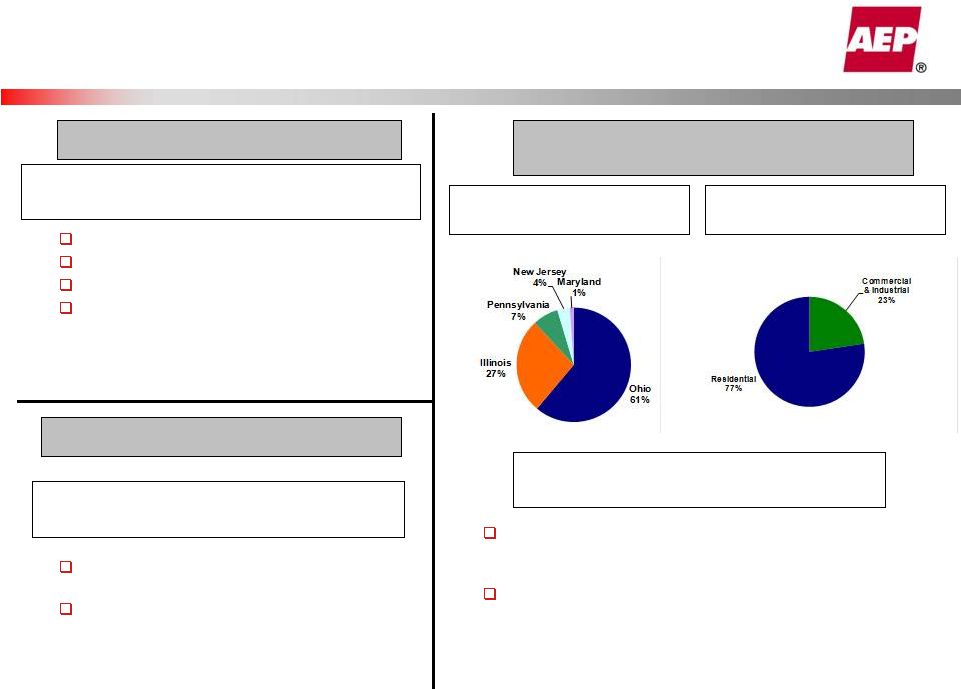
YTD Sept 2012 Billed Load
(4,793 GWh)
Off-System Sales & Competitive Business
Update
Competitive Retail
(included in Generation & Marketing Segment)
River Operations
Off-System Sales
Sept 30, 2012 Customers
(148,000 customers)
Recent results challenged by economy,
drought and river conditions
Management focused on export
opportunities (coal), and fleeting
infrastructure improvements
CRES
Capacity
Revenues:
$50
–
70M
Trading & Marketing: $45 –
55M
Physical volumes: 35 –
37 GWh
Future results dependent on natural gas
price/heat rate expansion
Retail marketing continues to focus on efforts in Ohio and
our
PJM
footprint
–
to
date,
over
61%
of
competitive
retail
sales volumes are in Ohio
Since October 2011, retail sales under contract increased
by over 60%, up to nearly 14 million MWh
2012 vs. 2013
estimated
growth
of
$0.02
-
$0.04/share
2012 vs. 2013
estimated
decline
of
$(0.03)
-
$(0.05)/share
2012 vs. 2013
estimated
growth
of
$0.01
-
$0.03/share |
 10
2012 vs. 2013 Earnings Drivers
Retail Gross Margin:
Normalized Retail Load
(0.04)
(0.06)
Weather
(0.03)
(0.03)
Ohio Customer Switching and Capacity
(2)
( ? )
( ? )
Rate Changes
0.42
0.44
Off-System Sales Margin
(0.05)
(0.03)
Utility O&M Expense
(0.04)
(0.02)
Depreciation Expense
(0.15)
(0.14)
AFUDC and Effective Tax Rate
(0.23)
(0.22)
Interest Expense
0.08
0.09
Transmission Operations
0.06
0.06
River Operations
0.02
0.04
Generation and Marketing
0.01
0.03
EPS Based on 487MM Shares
(1) Preliminary EPS range reflects approximate ranges for key drivers. Not intended
to be a complete year-over-year reconciliation. (2) Unfavorable Ohio
switching impact expected for 2013 vs. 2012; assumption to be provided at 1Q13 analyst meeting
42% switched; 6% in queue as of September 2012
Primarily SWEPCO (Turk), Ohio, Indiana and APCo related rate activity
Preliminary EPS Range
(1)
Comments
East and Ohio down 0.3%; West and Texas up 0.8%
Normal weather assumption
Recovery from drought-impacted operations in 2012
Growth in Competitive Retail
Lower CRES payments and trading; increased physical sales
Includes new operations and effect of repositioning effort
Higher base depreciation; Ohio units depreciated to retirement date
Primarily due to Turk In-Service in December 2012
Debt retirements
Growth in ETT and Transcos |
 11
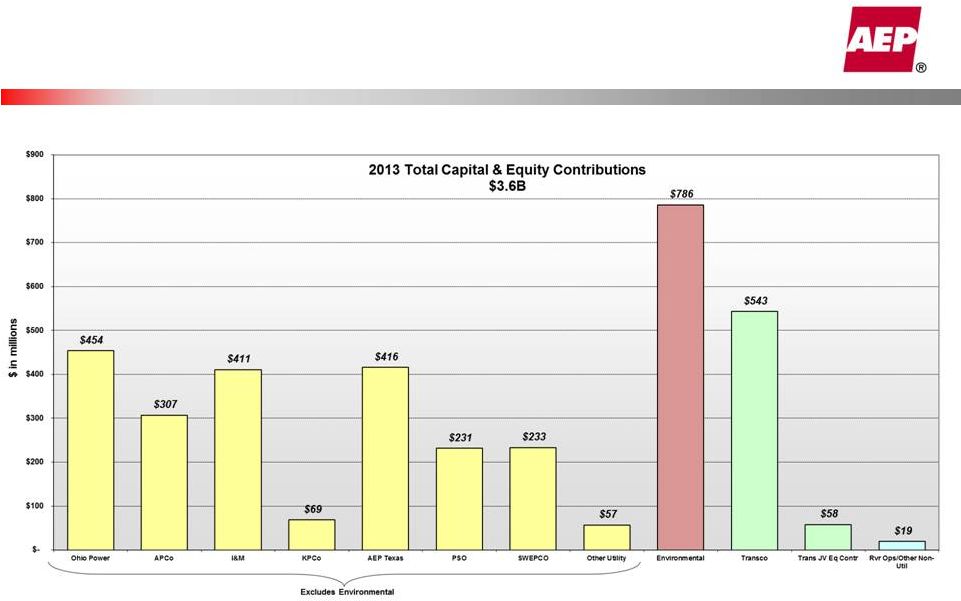
2012 and 2013 Capital & Equity
Contributions
2012: $3.1B
2013: $3.6B
$ in millions |
 12
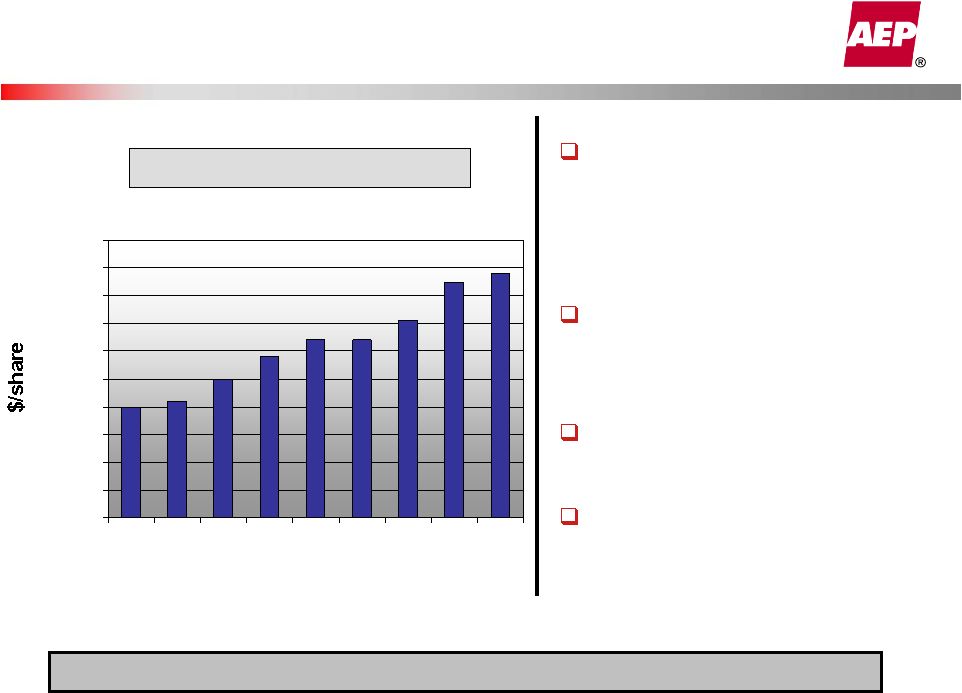
Dividend History and Policy
$1.88
$1.85
$1.71
$1.64
$1.64
$1.58
$1.40
$1.42
$1.50
$1.00
$1.10
$1.20
$1.30
$1.40
$1.50
$1.60
$1.70
$1.80
$1.90
$2.00
2004
2005
2006
2007
2008
2009
2010
2011
2012
Dividend history since 2004
Dividend statistics
-
Current yield -
4.5%
-
Current
quarterly
payment
-
$0.47/share
-
Current
payout
ratio
-
about
60%
-
Growth of 3.8% per annum since 2004
-
Paid 409 consecutive quarters
Recent dividend increases
-
June 2010 –
2.4% increase
-
December
2010
–
9.5%
increase
-
December
2011
–
2.2%
increase
Dividend level supported by
regulated operations earnings
Consolidated dividend payout
ratio target of 50-60%
AEP
is
committed
to
dividend
component
of
total
shareholder
return |
 13
Preliminary 2013 Cash Flows
Ohio distribution deferred assets ($300M)
and WV ENEC balance ($400M)
Credit facility established at the parent
level to fund Ohio Power maturities
during the corporate separation transition
Dividend Reinvestment Plan expected to
produce $100M
Balance sheet remains stable at mid-50%
debt to capitalization ratio
$ in millions
2013E
Cash from Operations
3,800
Cash from Securitization
700
Capital & JV Equity Contributions
(3,600)
Other Investing Activities
(215)
Common Dividends
(915)
Excess (Required) Capital
(230)
Financing ($ in millions)
2013E
Excess (Required) Capital
(230)
Debt Maturities (Senior Notes, PCRBs)
(1,649)
Securitzation Amortizations
(300)
Change in STD/Change in Cash
0
Interim Credit Facility*
1,000
Equity Issuances (DRP)
100
Debt Capital Market Needs (New) **
(1,079)
* Interim credit facility range $1.0 - $1.2B (see slide 15)
** New Debt Capital Market Needs for 2013 will be refined based
on timing, form and approval of corporate separation and asset
transfers |
 14
0.0%
10.0%
20.0%
30.0%
40.0%
50.0%
60.0%
70.0%
2008A
2009A
2010A
2011A
3Q2012
Short/Long Term Debt
Securitization Debt
Capitalization & Liquidity
Liquidity Summary (09/30/2012)
62.5%
57.2%
57.0%
55.3%
54.6%
Total Debt / Total Capitalization
Balance sheet remains
stable at mid-50% debt to
capitalization ratio
Liquidity Summary
(unaudited)
Actual
($ in millions)
Amount
Maturity
Revolving Credit Facility
1,750
$
Jul-16
Revolving Credit Facility
1,500
Jun-15
Total Credit Facilities
3,250
Plus
Cash & Cash Equivalents
443
Less
Commercial Paper Outstanding
(520)
Letters of credit issued
(132)
Net available Liquidity
3,041
$
|
 15
Ohio Power Recapitalization
(1)
Senior note retirements include the 2013 maturities of $750M, potential to call an
additional $225M of senior notes, intercompany note of $200M and 2014
maturity of $225M. (2)
AEP
plans
to
fund
the
retirements
with
a
combination
of
a
sizeable
term
loan
($1.0
-
$1.2B),
securitization
proceeds, short-term debt and/or cash on hand. The term loan will be
paid with proceeds from permanent financing for AEP Generation
Resources. (3)
Pollution control bond retirements include 2013 mandatory tenders and the
potential to call additional bonds. (4)
$296M of pollution control bonds will remain at Ohio Power but become the
financial responsibility of AEP Generation Resources.
(5)
Further reduction of unsecured debt outstanding may occur once securitization of
the deferred fuel balance from ESP1 occurs (current balance of $536M at
9/30/12). Outstanding Debt
9/30/2012
Debt
Retirements
Ohio Power
Company
Senior Notes
3,350
(1,400)
(1,2)
1,950
Pollution Control Bonds
518
(222)
(2,3)
296
(4)
Debt Outstanding
3,868
2,246
(5) |
 16
Securitization Update
Legislation was signed into law in March 2012 with both
the WV Commission and Consumer Advocate office
support for securitization for the large deferred fuel
balances at Appalachian Power.
In June, all parties settled on approximately $312M as
the deferred ENEC balance; however, there are other
items that are included in the application for a total of
approximately $415M, exclusive of financing costs.
The filing for the Financing Order was made in August
2012 and we expect to issue the securitization bonds in
the
1
st
quarter
2013.
In December 2011, the governor signed a bill that allows
Ohio’s electric utilities to utilize securitization as a financing
tool for certain utility assets. AEP Ohio has two separate
securitization opportunities.
Distribution Regulatory Assets
–
In December 2011, the PUCO ordered OPCo to implement
a new rider, the Deferred Asset Recovery Rider (DARR), to
collect certain distribution-related deferred costs, which
meet the requirements for securitization under the new law.
–
OPCo filed its financing application with the PUCO in July
2012 requesting an issuance amount of up to $320M. We
expect
to
issue
the
securitization
bonds
in
the
1
st
quarter
2013.
Deferred
Fuel Regulatory Asset
–
The deferred fuel balance from the 2009-2011 ESP is
currently
being
collected
from
September
2012
–
August
2018.
–
This asset also meets the requirements for securitization,
once a final, nonappealable order is obtained, which we
anticipate in the second half of 2013.
–
The September 30, 2012 deferral balance was $536M.
West Virginia
Ohio |
 17
Liability Management (parent debt)
On
December
14,
2012,
AEP,
Inc.
will
repay
the
full
$242,775,000
outstanding
principal balance of its 5.25% Series D Senior Notes (CUSIP: 025537AE1), issued
on May 20, 2003 with a maturity of June 1, 2015 together with accrued
interest and a make-whole premium.
On
December
19,
2012,
AEP,
Inc.
will
repay
the
full
$315,000,000
outstanding
principal balance of its 8.75% Junior Subordinated Debentures (CUSIP: 02557T208),
issued March 20, 2008 with a maturity of March 1, 2063 together with accrued
interest and a make-whole premium.
AEP plans to repay the premium and notes outstanding with typical financings
available to the company ---
such as those available as short-term (commercial
paper and credit facilities) and long-term markets (senior notes at AEP
parent). In the fourth quarter of 2012, pre-tax expenses for the
transaction are expected to be approximately $50M. For 2013 and 2014,
the pre-tax interest savings is expected to be greater than $30M in each
year. |
 18
Credit Metrics
* Moody’s/S&P/Fitch ** Includes securitization debt
Trailing Twelve Months 09/30/2012
FFO Interest
Coverage
FFO to Debt
GAAP Debt to
Capitalization
Credit
Ratings*
American Electric Power Company
4.75
19.9%
54.6%
Baa2/BBB/BBB
Appalachian Power Company
3.41
12.6%
56.0%
Baa2/BBB/BBB
Indiana Michigan Power Company
4.79
21.7%
53.8%
Baa2/BBB/BBB
Kentucky Power Company
3.70
18.1%
53.5%
Baa2/BBB/BBB
Ohio Power Company
5.37
24.7%
45.4%
Baa1/BBB/A-
Public Service Company of Oklahoma
7.34
35.7%
50.3%
Baa1/BBB/BBB+
Southwestern Electric Power Company
5.02
24.3%
50.7%
Baa3/BBB/BBB
AEP Texas Central Company
4.90
24.4%
82.4%**
Baa2/BBB/A-
AEP Texas North Company
5.26
21.9%
55.3%
Baa2/BBB/A- |
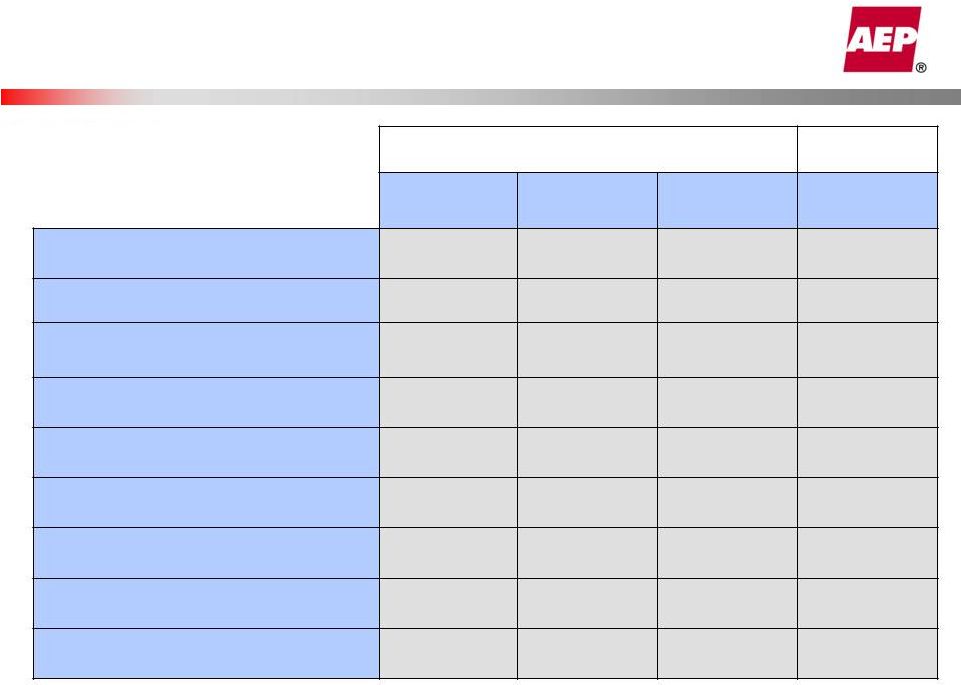
  19
Diversification Supports System Results
Jurisdiction
Authorized Rate
Base
Authorized ROE
9/30/12 Pro-forma Earned
ROE
AEP Ohio - Distribution
$1,912MM
10.20%
AEP Ohio - Transmission
$952MM
11.49%
APCo-Virginia
$2,172MM
10.90%
APCo-West Virginia
$2,428MM
10.00%
KPCo-Kentucky
$995MM
10.50%
11.20%
I&M-Indiana
$2,000MM
10.50%
I&M-Michigan
$663MM
10.20%
PSO-Oklahoma
$1,706MM
10.15%
14.01%
SWEPCO-Louisiana
$649MM
10.57%
SWEPCO-Arkansas
$612MM
10.25%
SWEPCO-Texas
$665MM
10.33%
TCC-Texas
$1,566MM
9.96%
13.62%
TNC-Texas
$530MM
9.96%
12.47%
* - AEP Ohio ROE represents G, T, and D operations
Note: Pro-forma Earned ROEs adjust GAAP results by eliminating any material
nonrecurring items, represent a 12-month rolling calculation and
are not weather normalized 10.23% *
9.49%
7.73%
11.70% |
 20
AEP Ohio Regulatory Update
Capacity order received July 2, 2012;
rehearing order received October 17, 2012
ESP 1 fuel deferral (PIRR) order received
August 1, 2012; rehearing order received
October 3, 2012
ESP 2 order received August 8, 2012
Corporate separation order received
October 17, 2012
Rehearings for ESP and corporate separation
orders in process
Corporate separation filings at the FERC
made October 31, 2012 |
 21
Corporate Separation Next Steps
Six filings made at FERC
on
October 31, 2012
Three FERC Section 203 Applications
Three FERC Section 205 Applications
Comments due November 30 and
December 17, 2012
Q4
2012
Post
Q4
2012
1/1/2014
Final Settlements and FERC Orders
Corporate Separation of Ohio Power
generation assets
Approval of Power Supply Agreement
between AEP Generation Resources and
Ohio Power
Approval of Power Coordination
Agreement among APCo, I&M and KPCo
(FRR and off-system sales)
Bridge Agreement (interim agreement to
address legacy off-system sales and FRR
obligations)
Transfer of Amos Unit 3 and Mitchell
Generating Facilities to APCo and KPCo
Summary of Key Requests in
FERC Filings:
Approximate Timeline
FERC Settlement Process with State
Commissions and Stakeholders
Execute process, achieve timeline
Corporate Separation rehearing process
complete at PUCO
Target
Q2/Q3
2013
Implementation |
 Corporate Separation Transition
Competitive
Operations
Ohio
Power
Current: 2012 -
2013
Transition:
1Q 2014 to May 2015
Market:
post May 2015
Ohio generation remains in four-
company pool
Capacity Order Received
$188.88/MW-day
ESP 2 Order Received
Corporate Separation Order
received (PUCO)
Corporate
Separation filings at FERC
Mid 2013; Delivery begins under
initial 10% of load SSO auction
Grow Retail Business
Hedge Generation
Anticipated FERC approval of
corporate separation effective
1/1/2014 *
Pool agreement modified or
terminated *
Subsequent SSO auctions: 60%
of load on June 1, 2014 and 100%
of load on January 1, 2015
Remaining SSO load served by
AEP Generation Resources *
Ohio generation separated *
Serve remaining OPCo SSO load
via affiliate agreement *
Generation Resources receives
$188.88/MW-day capacity plus
Rate Stability Rider revenue from
Ohio Power
All capacity and energy
available for competitive
operations
SSO for remaining Ohio
Power customers at
auction price for
capacity and energy
* Subject to FERC approval
22 |
 23
MATS Environmental Investments &
Retirements
Projected Plant Retirements through 2016
Potential Environmental Investments
ACI –
Activated Carbon Injection
DSI –
Dry Sorbent Injection
FGD –
Flue Gas Desulfurization
SCR –
Selective Catalytic Reduction
Operating
Company
Plant
MW
Expected
Retirement
Operating
Company
Plant
MW
Expected
Retirement
APCo
Glen Lyn 5
95
2015
AEP Ohio
Conesville 3
165
2012
Glen Lyn 6
240
2015
Muskingum River 1-4
840
2015
Clinch River 3
235
2015
Picway 5
100
2015
Sporn 1
150
2015
Sporn 2-4
300
2015
Sporn 3
150
2015
Kammer 1-3
630
2015
Kanawha River 1
200
2015
Beckjord
53
2015
Kanawha River 2
200
2015
Total MW
2,088
Total MW
1,270
KPCo
Big Sandy 1
278
2015
I&M
Tanners Creek 1
145
2015
Tanners Creek 2
145
2015
SWEPCO
Welsh 2
528
2014
Tanners Creek 3
205
2015
Total MW
495
PSO
Northeastern 4
465
2016
Total Retirements
5,124MW
=
Operating
Company
Plant
MW
Potential Type of
retrofit
Operating
Company
Plant
MW
Potential Type of
retrofit
AEP Ohio*
Conesville 5
400
ACI, DSI
PSO
Oklaunion
101
FGD upgrade, ACI
Conesville 6
400
ACI, DSI
Northeastern 3****
470
ACI, DSI, Baghouse
Muskingum River 5**
578
Refuel with Natural Gas
SWEPCO
Welsh 1
528
ACI, DSI
APCO
Clinch River 1***
242
Refuel with Natural Gas
Welsh 3
528
ACI, DSI
Clinch River 2***
242
Refuel with Natural Gas
Pirkey
580
FGD Upgrade
Dolet Hills
262
ACI, Baghouse
I&M
Tanners Creek 4
500
DSI, ACI
Flint Creek****
264
FGD, ACI
Rockport****
1,310
FGD, SCR
TNC
Oklaunion
377
FGD upgrade, ACI
KPCO
Big Sandy 2
800
under evaluation
Grand Total MW
7,582
* Assumes investment is able to clear the market
** Existing Coal Plant 585MW
*** Existing Coal Plant 235MW
**** Case on file, subject to regulatory approval |
 24
37.6%
87.5%
36.5%
22.0%
67.3%
62.0%
31.7%
78.9%
40.6%
55.8%
0.0%
10.0%
20.0%
30.0%
40.0%
50.0%
60.0%
70.0%
80.0%
90.0%
100.0%
East Coal
East Gas
East Combined
Cycle
West Coal
West Gas
3Q11
3Q12
61.2%
82.7%
42.4%
25.3%
32.7%
19.0%
27.4%
74.9%
49.2%
66.9%
0.0%
10.0%
20.0%
30.0%
40.0%
50.0%
60.0%
70.0%
80.0%
90.0%
100.0%
East Coal
East Gas
East Combined
Cycle
West Coal
West Gas
YTD11
YTD12
Coal to Gas Switching
Overall generation from natural gas has increased over 50 percent
year-to-date East combined cycle statistics include the addition of
the Dresden Plant, which came on line in February 2012 45 days system
average coal inventory at September 30, 2012 Coal fully hedged for
2012; approximately 92% hedged for 2013 West
West
East
East
3rd Quarter 2011 vs. 2012 Capacity Factor
YTD 2011 vs. 2012 Capacity Factor |
 25
Capacity Profile
AEP Generation Resources
Fleet Characteristics post 2014
ADVANTAGE
–
River served,
controlled coal and combined cycle
gas represent about 75% of
portfolio
COAL, CONTROLLED
Gavin
2,640
Cardinal
595
Zimmer
330
52%
Stuart
600
OVEC
434
Conesville 4
340
Conesville 5,6 (scrubber only)
800
13%
NATURAL GAS
Lawrenceburg
1,186
Waterford
840
23%
Darby
507
Muskingum River
578
12%
Hydro (Racine)
26
8,876
Combined Cycle, Baseload
Combustion Turbine/Steam, Peaking
River Served, Baseload
Rail/Truck Served, Intermediate
Coal Controlled
Coal Uncontrolled
MR5 Gas Conversion
Gas
Renewables
To Be Transferred
To Be Retired |
 26
Pension & OPEB Estimates
Investment returns for our pension plan are
positive for the year, with gains in both the
equity and fixed income segments. OPEB
funds also show positive returns year to date.
AEP made a discretionary contribution of $100
million to the pension plan during the third
quarter of 2012 and plans to make an
additional $100 million discretionary
contribution in 2013.
We expect combined pension and OPEB costs
(O&M and capital) to increase by about $85M
from 2012 to 2013, depending on investment
results and interest rate changes during the
fourth quarter of 2012 and subject to results of
the benefits evaluation.
Estimates for costs and contributions are very
sensitive to changes in interest rates and
investment returns between now and year-end.
Pension Liability Funding
75%
74%
81%
88%
87%
70%
80%
90%
100%
2008
2009
2010
2011
3Q2012
2012
2013E
Pension Discount Rate
4.55%
4.10%
OPEB Discount Rate
4.75%
4.25%
Assumed Long Term
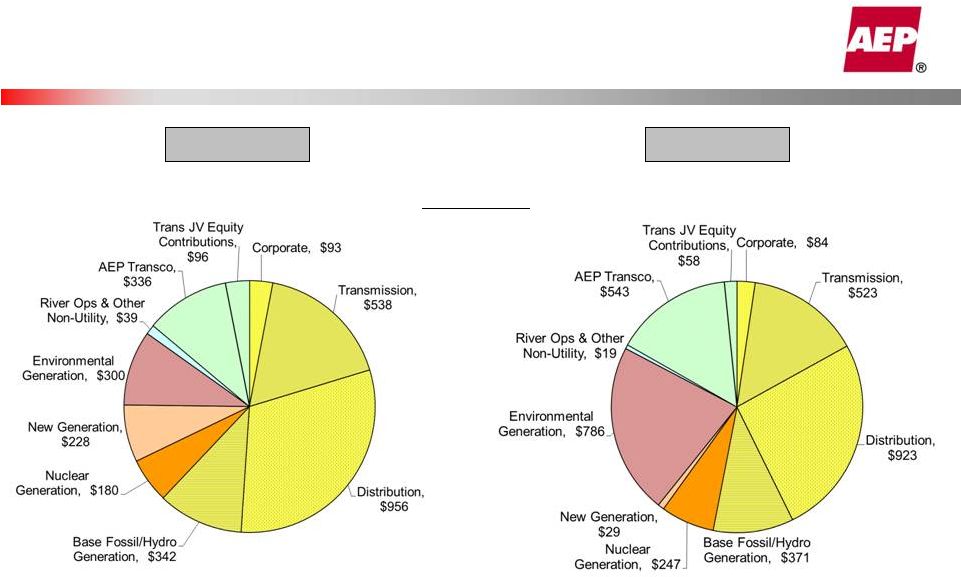
Rate of Return on Assets
7.25%
TBD |
 27
2013 AEP System Capital |
 28
East & West Normalized Retail Load Trends
East & West Normalized Retail Load Trends
-0.3%
-1.4%
-1.2%
0.7%
1.7%
-5%
0%
5%
10%
2010A
2011A
YTD12
2012E
2013E
East System Total Normalized GWh Sales
%Change vs. Prior Year
R: -0.3%
C: -
0.4%
I: -0.4%
0.8%
1.2%
1.0%
2.8%
2.1%
-5%
0%
5%
10%
2010A
2011A
YTD12
2012E
2013E
West System Total Normalized GWh Sales
%Change vs. Prior Year
R: 0.3%
C: 0.6%
I: 1.8%
Drivers
Weak customer growth
Aggressive DSM mandates
Coal mine curtailed production/closures
Aluminum pot line reductions
Growth in Shale Gas
Drivers
Demographic and Job Growth
Oil & Gas Expansions
Growth in Shale Gas
Auto plant shut down
Note: Charts reflect connected load and exclude firm wholesale load & Buckeye
Power backup load |
 29
East Normalized Retail Load Trends
East Normalized Retail Load Trends
1.2%
3.2%
-2.1%
-2.4%
-2.7%
-5%
0%
5%
10%
2010A
2011A
YTD12
2012E
2013E
3.0%
0.2%
0.0%
-0.1%
-1.2%
-5%
0%
5%
10%
2010A
2011A
YTD12
2012E
2013E
AEP Ohio Normalized GWh Sales
%Change vs. Prior Year
I&M Normalized GWh Sales
%Change vs. Prior Year
R: -0.1%
C: 0.0%
I: 2.3%
R: 0.3%
C: -0.6%
I: -6.0%
R: -2.0%
C: -
1.2%
I: -0.5%
2.8%
0.1%
-0.7%
-1.7%
1.9%
-5%
0%
5%
10%
2010A
2011A
YTD12
2012E
2013E
R: 0.1%
C: 0.1%
I: 7.0%
APCo/Wheeling Normalized GWh Sales
%Change vs. Prior Year
1.4%
-2.6%
0.8%
-3.8%
-3.4%
-5%
0%
5%
10%
2010A
2011A
YTD12
2012E
2013E
Kentucky Power Normalized GWh Sales
%Change vs. Prior Year
R: -1.2%
C: 1.7%
I: 2.0%
Note: Charts reflect connected load and exclude firm wholesale load & Buckeye
Power backup load |
 30
1.2%
-0.2%
1.9%
1.4%
-0.2%
-5%
0%
5%
10%
2010A
2011A
YTD12
2012E
2013E
West Normalized Retail Load Trends
West Normalized Retail Load Trends
4.9%
5.1%
0.3%
1.6%
0.4%
-5%
0%
5%
10%
2010A
2011A
YTD12
2012E
2013E
1.0%
1.7%
1.7%
3.2%
1.0%
-5%
0%
5%
10%
2010A
2011A
YTD12
2012E
2013E
PSO Normalized GWh Sales
%Change vs. Prior Year
SWEPCO Normalized GWh Sales
%Change vs. Prior Year
AEP Texas Normalized GWh Sales
%Change vs. Prior Year
R: -0.2%
C: -
0.7%
I: 0.1%
R: 1.2%
C: 1.7%
I: 1.8%
R: 0.1%
C: 0.5%
I: 3.1%
Note: Charts reflect connected load and exclude firm wholesale load
Note: 2010 increase due to economic recovery, 2011 due to acquisition of
VEMCO |