Attached files
| file | filename |
|---|---|
| 8-K - FORM 8-K - ION GEOPHYSICAL CORP | a8-k.htm |
| EX-99.1 - PRESS RELEASE - ION GEOPHYSICAL CORP | pressrelease.htm |
confcallpresentation
ION Earnings Call – Q3 2012 Earnings Call Presentation November 9, 2012

Earnings Call Introduction Corporate Participants & Contact Information CONTACT INFORMATION If you have technical problems during the call, please contact DRG&L at 713 529 6600. If you would like to listen to a replay of today's call, it will be available via webcast in the Investor Relations section of the Company's website - www.iongeo.com for approximately 12 months. BRIAN HANSON President and Chief Executive Officer GREG HEINLEIN Senior Vice President and Chief Financial Officer 2

Earnings Call Introduction FORWARD-LOOKING STATEMENTS The information included herein contains forward-looking statements within the meaning of Section 27A of the Securities Act of 1933 and Section 21E of the Securities Exchange Act of 1934. Actual results may vary fundamentally from those described in these forward-looking statements. All forward-looking statements reflect numerous assumptions and involve a number of risks and uncertainties. These risks and uncertainties include risk factors that are disclosed by ION from time to time in its filings with the Securities and Exchange Commission. 3
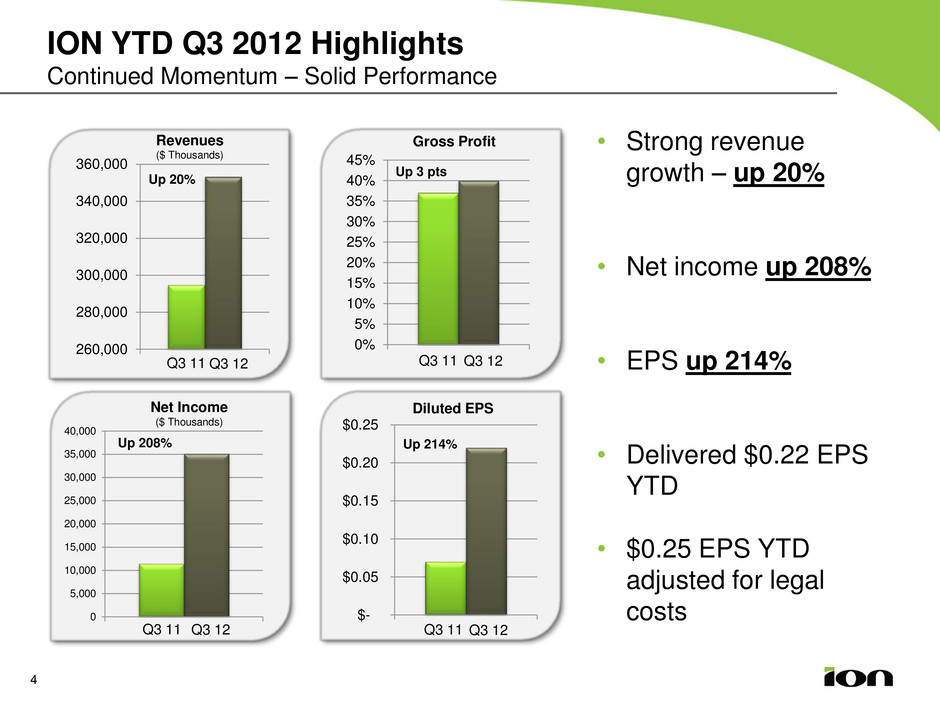
ION YTD Q3 2012 Highlights Continued Momentum – Solid Performance 4 260,000 280,000 300,000 320,000 340,000 360,000 Revenues ($ Thousands) Q3 11 Q3 12 0% 5% 10% 15% 20% 25% 30% 35% 40% 45% Gross Profit Q3 11 Q3 12 Up 20% $- $0.05 $0.10 $0.15 $0.20 $0.25 Diluted EPS Q3 11 Q3 12 0 5,000 10,000 15,000 20,000 25,000 30,000 35,000 40,000 Net Income ($ Thousands) Q3 11 Q3 12 • Strong revenue growth – up 20% • Net income up 208% • EPS up 214% • Delivered $0.22 EPS YTD • $0.25 EPS YTD adjusted for legal costs Up 214% Up 208% Up 3 pts
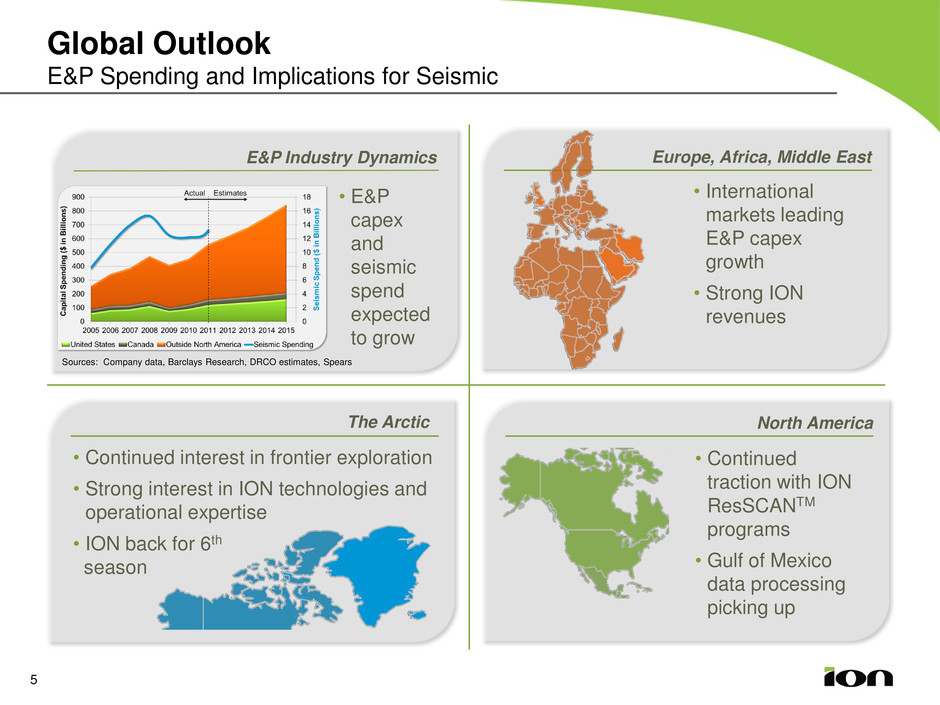
Global Outlook E&P Spending and Implications for Seismic 5 North America • Continued traction with ION ResSCANTM programs • Gulf of Mexico data processing picking up The Arctic • Continued interest in frontier exploration • Strong interest in ION technologies and operational expertise • ION back for 6th season Europe, Africa, Middle East • International markets leading E&P capex growth • Strong ION revenues E&P Industry Dynamics • E&P capex and seismic spend expected to grow Sources: Company data, Barclays Research, DRCO estimates, Spears
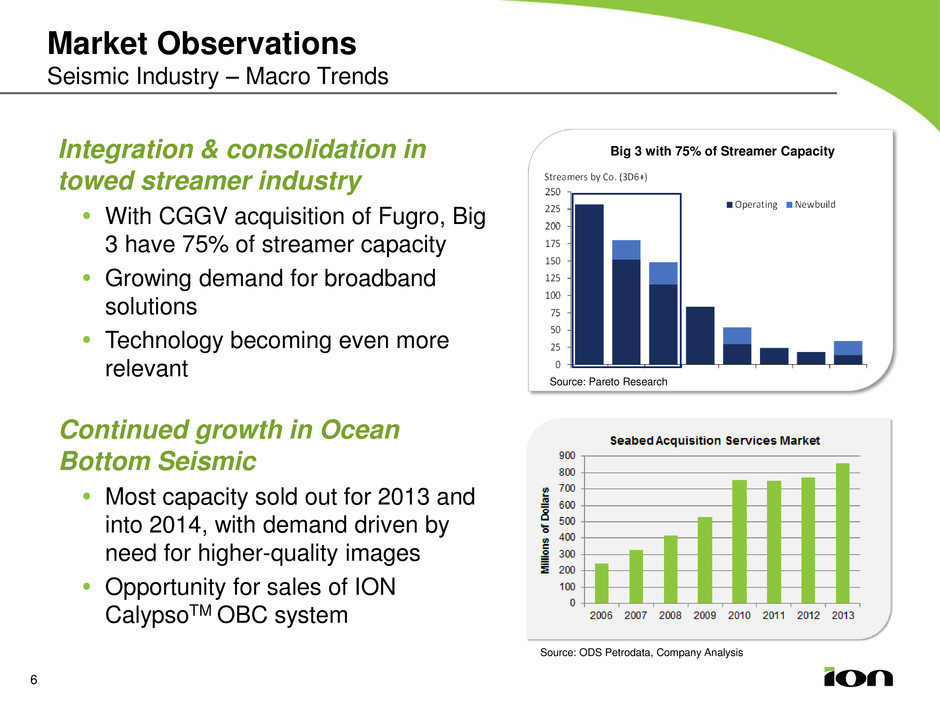
Market Observations Seismic Industry – Macro Trends Integration & consolidation in towed streamer industry With CGGV acquisition of Fugro, Big 3 have 75% of streamer capacity Growing demand for broadband solutions Technology becoming even more relevant Continued growth in Ocean Bottom Seismic Most capacity sold out for 2013 and into 2014, with demand driven by need for higher-quality images Opportunity for sales of ION CalypsoTM OBC system 6 Source: ODS Petrodata, Company Analysis Big 3 with 75% of Streamer Capacity Source: Pareto Research

Market Observations International Data Processing Robust Buoyant data processing market Demand up – Gulf of Mexico and Internationally – Europe, Africa, Middle East Record revenues in Q3 – 6th sequential quarterly revenue improvement Ended Q3 with record data processing backlog WiBandTM technology gaining momentum, with four commercial projects underway 7 Conventional Image WiBand Image WiBand Projects
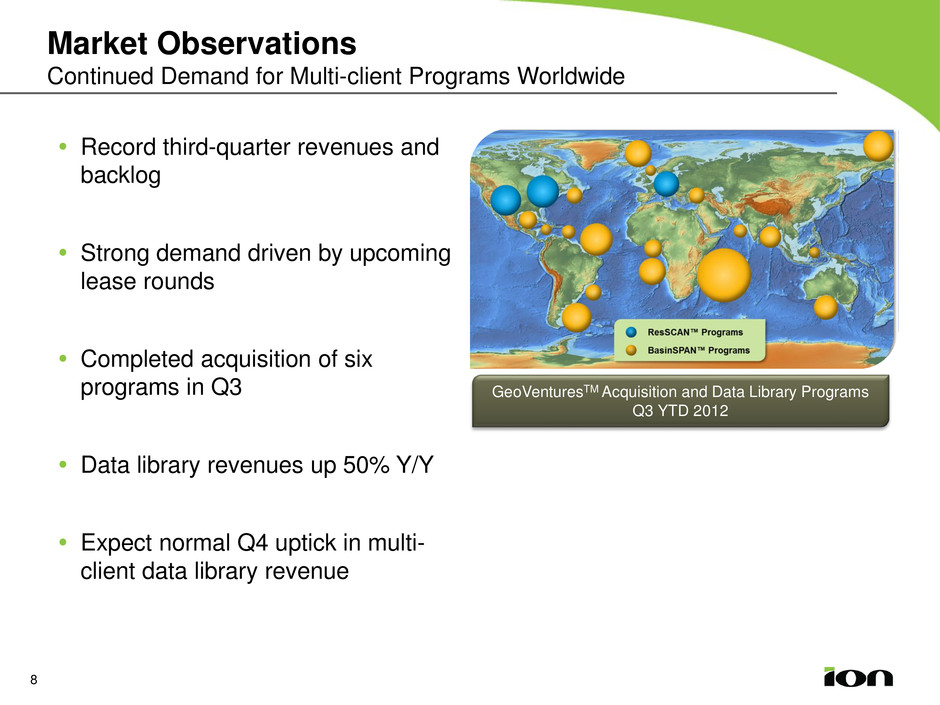
Market Observations Continued Demand for Multi-client Programs Worldwide 8 Record third-quarter revenues and backlog Strong demand driven by upcoming lease rounds Completed acquisition of six programs in Q3 Data library revenues up 50% Y/Y Expect normal Q4 uptick in multi- client data library revenue GeoVenturesTM Acquisition and Data Library Programs Q3 YTD 2012
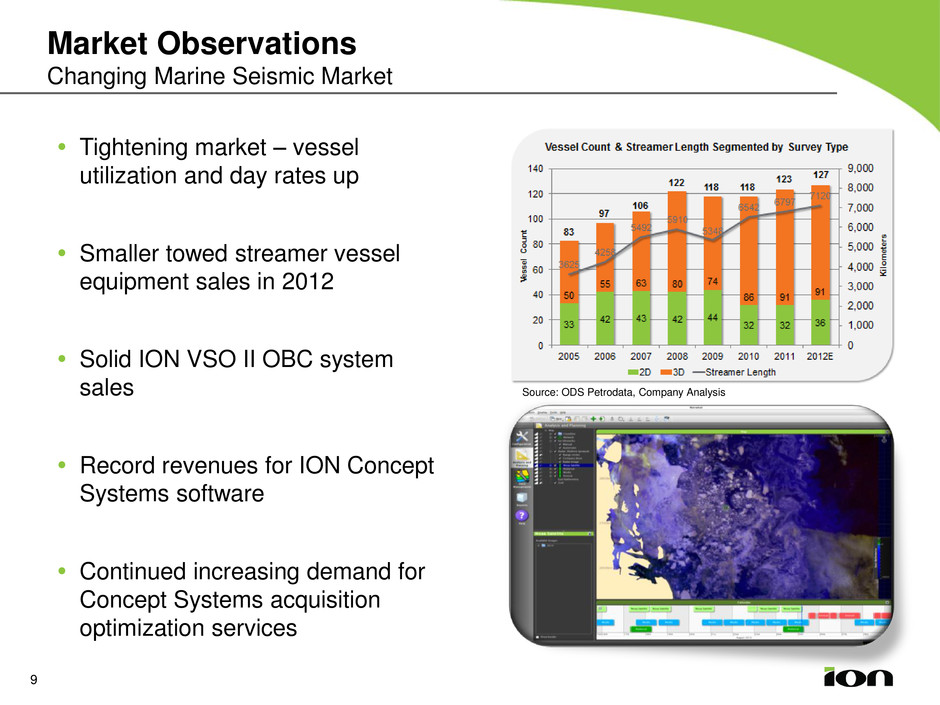
Market Observations Changing Marine Seismic Market 9 Tightening market – vessel utilization and day rates up Smaller towed streamer vessel equipment sales in 2012 Solid ION VSO II OBC system sales Record revenues for ION Concept Systems software Continued increasing demand for Concept Systems acquisition optimization services Source: ODS Petrodata, Company Analysis

Summary Industry remains robust ION growth in line with industry growth International activity is strong Well positioned to grow 10
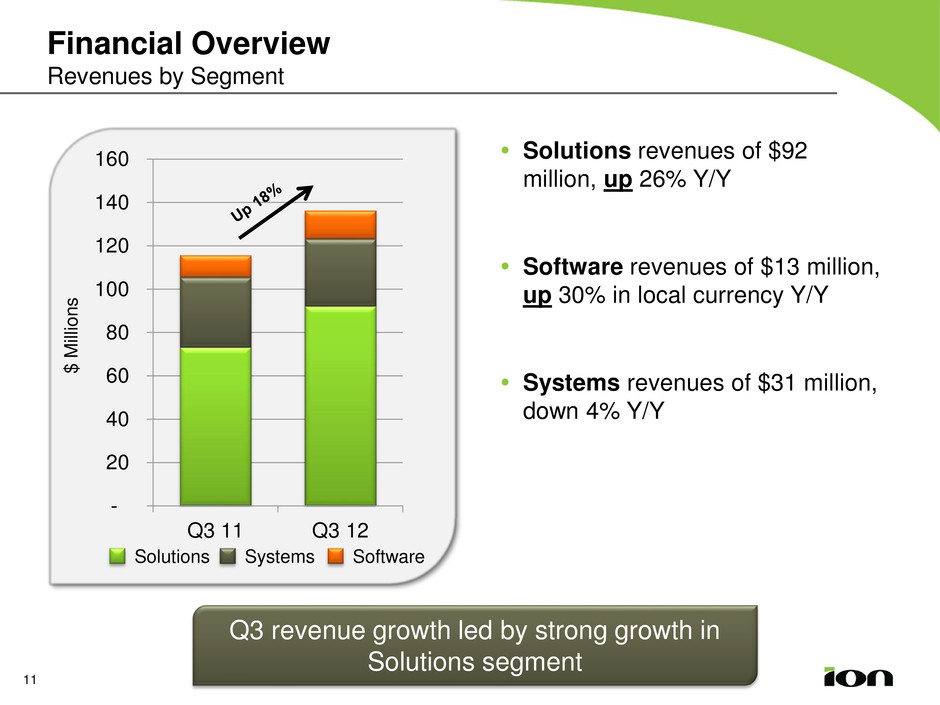
- 20 40 60 80 100 120 140 160 Q3 11 Q3 12 Software Systems Solutions $ M illion s 11 Solutions revenues of $92 million, up 26% Y/Y Software revenues of $13 million, up 30% in local currency Y/Y Systems revenues of $31 million, down 4% Y/Y Q3 revenue growth led by strong growth in Solutions segment Financial Overview Revenues by Segment
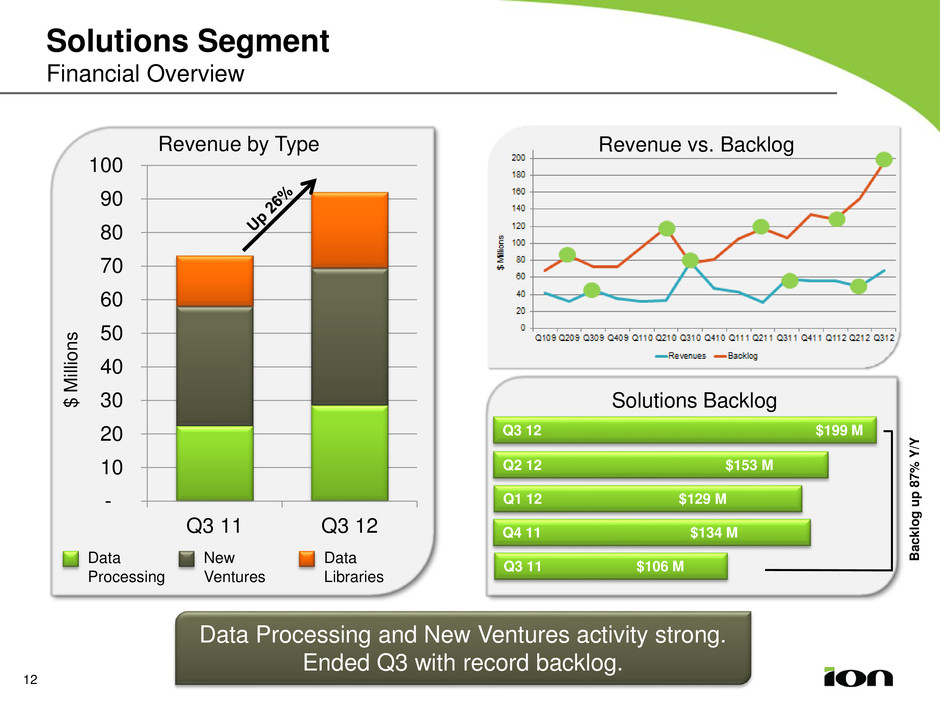
Solutions Segment Financial Overview - 10 20 30 40 50 60 70 80 90 100 Q3 11 Q3 12 Revenue by Type Solutions Backlog $ M illion s Q4 11 $134 M Data Processing Data Libraries New Ventures Q3 12 $199 M 12 Q3 11 $106 M Q1 12 $129 M Data Processing and New Ventures activity strong. Ended Q3 with record backlog. Bac k lo g u p 8 7 % Y /Y Q2 12 $153 M Revenue vs. Backlog
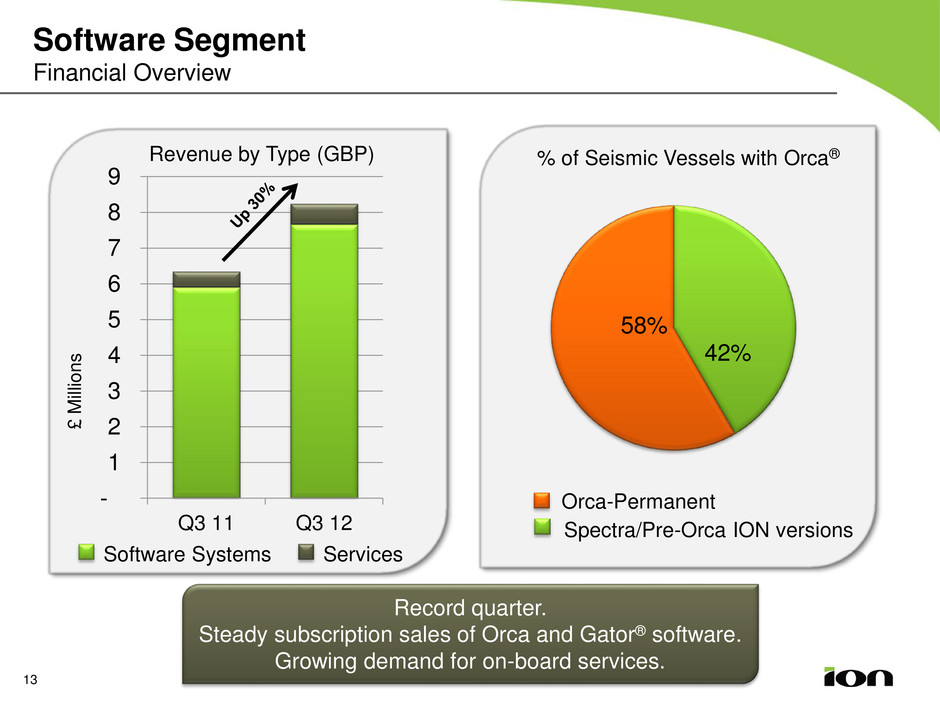
42% 58% Software Segment Financial Overview - 1 2 3 4 5 6 7 8 9 Q3 11 Q3 12 £ M illion s Revenue by Type (GBP) Services Software Systems % of Seismic Vessels with Orca® Orca-Permanent Spectra/Pre-Orca ION versions 13 Record quarter. Steady subscription sales of Orca and Gator® software. Growing demand for on-board services.
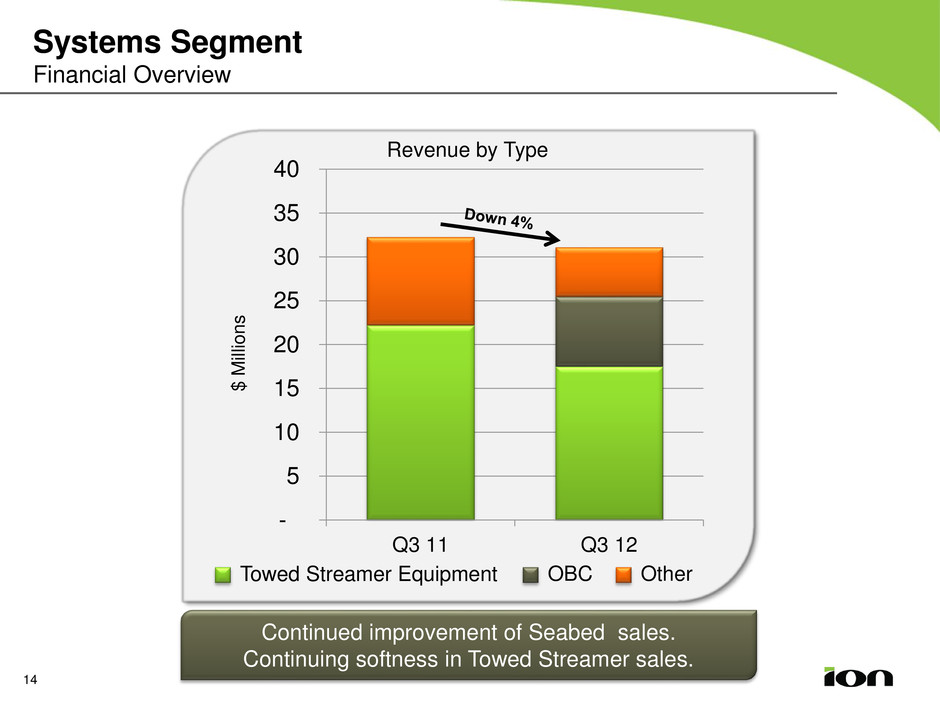
Systems Segment Financial Overview - 5 10 15 20 25 30 35 40 Q3 11 Q3 12 $ M illion s Revenue by Type Towed Streamer Equipment OBC Other 14 Continued improvement of Seabed sales. Continuing softness in Towed Streamer sales.
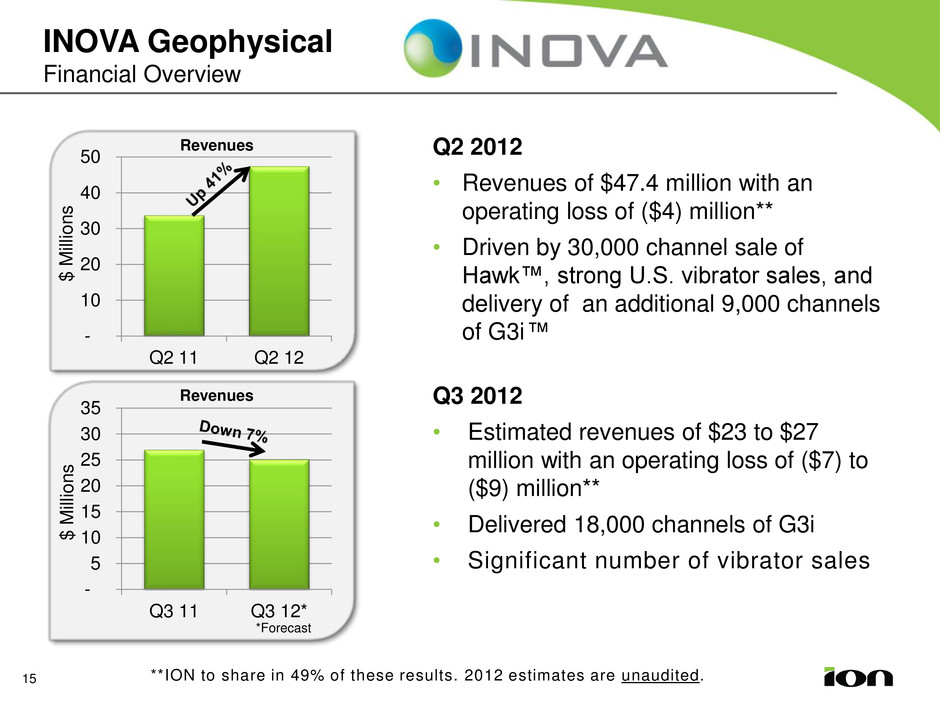
INOVA Geophysical Financial Overview - 5 10 15 20 25 30 35 Q3 11 Q3 12* Revenues $ M illion s Q2 2012 • Revenues of $47.4 million with an operating loss of ($4) million** • Driven by 30,000 channel sale of Hawk™, strong U.S. vibrator sales, and delivery of an additional 9,000 channels of G3i ™ 15 *Forecast - 10 20 30 40 50 Q2 11 Q2 12 $ M illion s Revenues Q3 2012 • Estimated revenues of $23 to $27 million with an operating loss of ($7) to ($9) million** • Delivered 18,000 channels of G3i • Significant number of vibrator sales **ION to share in 49% of these results. 2012 estimates are unaudited.

Financial Overview Cash Flow Three Months Ended September 30, SUMMARIZED CASH FLOW 2012 2011 Cash from operations $ 54,211 $ 62,289 Working capital (28,609) (36,957) Multi-client investment (53,019) (45,492) PP&E Capital Expenditures (7,002) (1,784) Free Cash Flow (34,419) (21,944) Other Investing & Financing (1,384) (1,719) Cash flow, including ST investments (35,803) (23,663) Cash, Cash Equivalents & ST Investments (Beginning of Period) 83,282 94,953 Cash, Cash Equivalents & ST Investments (End of Period) $ 47,479 $ 71,290 16
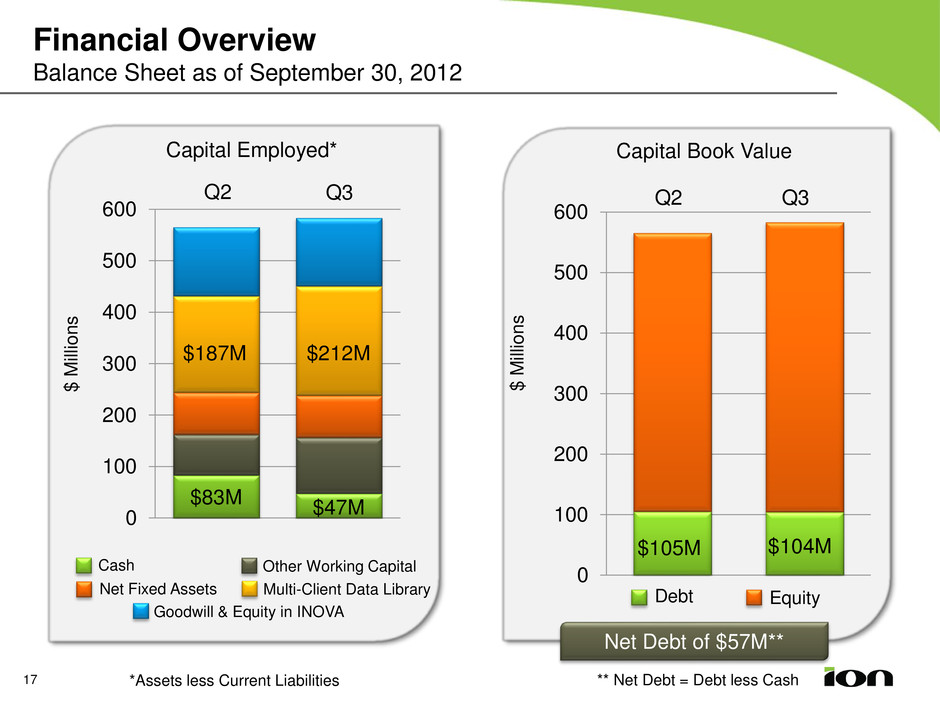
Financial Overview Balance Sheet as of September 30, 2012 0 100 200 300 400 500 600 0 100 200 300 400 500 600 Capital Employed* Capital Book Value Cash Net Fixed Assets Multi-Client Data Library Goodwill & Equity in INOVA Equity $ M illion s $ M illion s Debt Net Debt of $57M** ** Net Debt = Debt less Cash $104M $212M $47M Other Working Capital 17 $187M $83M Q3 Q2 $105M Q2 Q3 *Assets less Current Liabilities

Continued Momentum in Q3 18 • Strong first three quarters of 2012 • Expect solid Y/Y growth throughout 2012 • Anticipate 2012 multi-client investment north of $140 million • Remain positive on outlook to achieve Y/Y quarterly improve- ment for balance of 2012

19
