Attached files
| file | filename |
|---|---|
| 8-K - FORM 8-K - Energy Future Holdings Corp /TX/ | d434384d8k.htm |
 EFH
Corp. 2012 EEI Financial Conference
Discussion Deck
November
11
th
–
14
th
Exhibit 99.1 |
 1
Safe Harbor Statement
This presentation contains forward-looking statements, which are subject to
various risks and uncertainties. All statements, other than statements of
historical facts, that are included in this presentation, in response to
questions or otherwise, that address activities, events, or developments that
we expect or anticipate to occur in the future, including such matters as
financial or operational projections, capital allocation, future capital
expenditures, business strategy, competitive strengths, goals, future
acquisitions or dispositions, development or operation of power generation
assets, market and industry developments and the growth of our businesses and
operations (often, but not always, through the use of words or phrases
such
as
“intends,”
“plans,”
“will
likely,”
“expected,”
“anticipated,”
“estimated,”
“should,”
“projection,”
“target,”
“goal,”
“objective”
and “outlook”),
are forward looking statements. A discussion of the risks and uncertainties that
could cause actual results to differ materially from management's current
projections, forecasts, estimates and expectations is contained in EFH Corp.'s
filings with the Securities and Exchange Commission (SEC).
Regulation G
This presentation includes certain non-GAAP financial measures. A reconciliation
of these measures to the most directly comparable GAAP measures is included in
the appendix to this presentation. |
 Table
of Contents 2
I.
Five
Year
Review………………………………………………
.
3 –
8
II.
Luminant………………………………………………………...
9 –
12
III.
TXU
Energy……………………………………………………..
13 –
18
IV.
Oncor…………………………………………………………….
19 –
21
V.
EFH
Corp………………………………………………………..
22 –
26
VI.
Appendix………………………………………………………...
27 –
40
VII.
Regulation
G……………………………………………………
41 –
46 |
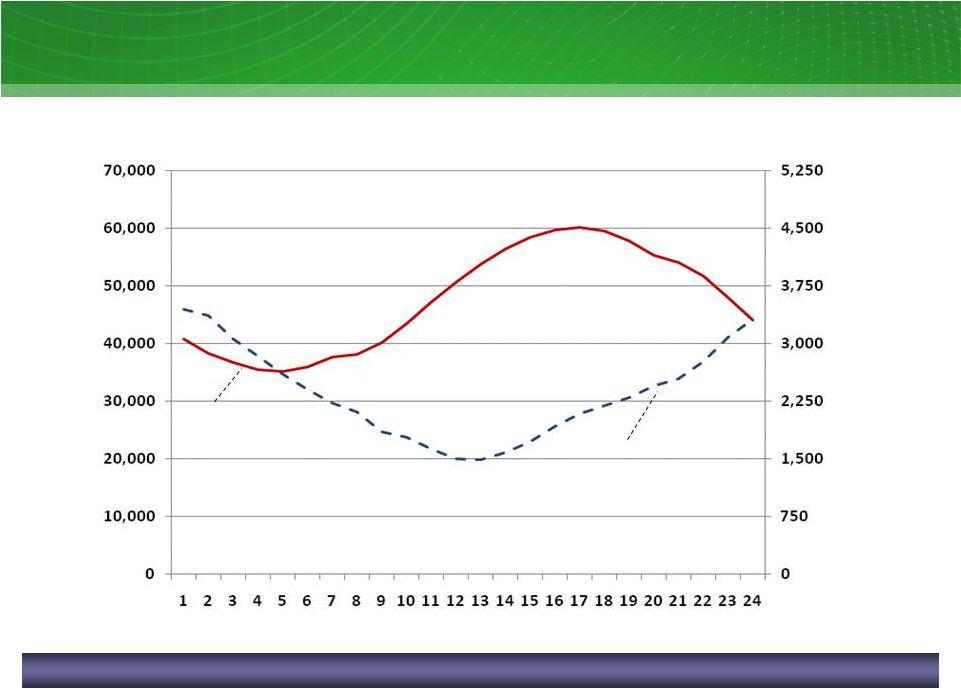
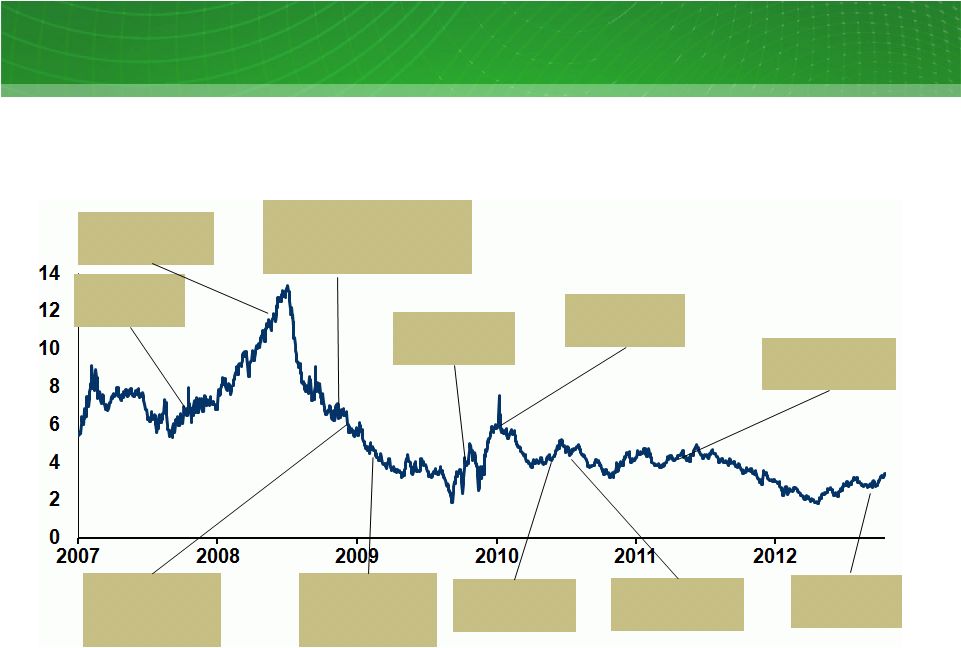 EFH
Has Made Significant Accomplishments Despite Lower Commodity Prices
3
Historical NYMEX spot natural gas prices
2007-2012
;
$/MMBtu
1
As of 10/15/2012
1
TXU Energy begins
customer care system
implementation
Sandow 5
complete
Oak Grove
1 complete
TCEH Amend
and Extend
EFH sells
~20% interest
in Oncor
Oncor
awarded
CREZ project
Oak Grove 2
complete
Debt
Exchanges
CSAPR
vacated
Oncor begins
AMS rollout
Merger
closes |
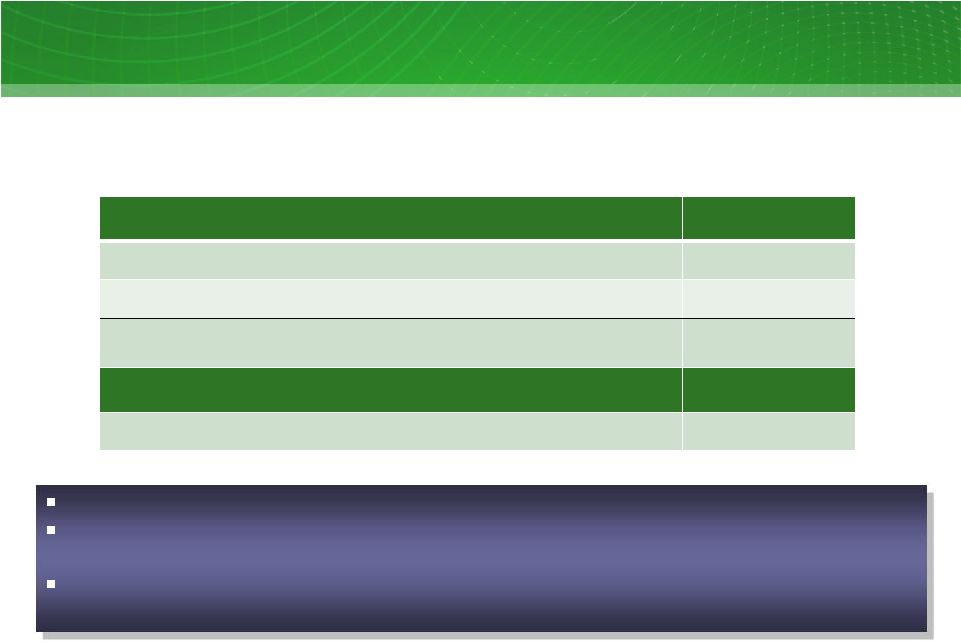 EFH
Has Invested Over $10 Billion And Added Nearly 1,900 Positions
Capital Investment
Amount
TCEH and Corporate
>$5
Oncor
>$5
Grand Total
>$10
Jobs
New employee positions added
~1,900
4
Capital investment and jobs
2008-2012
1
; $ billions, positions added
Luminant invested $3.25 billion to build 2,200 MWs of new units
TXU Energy has invested nearly $100 million in new tools and products for
customers to manage their own electricity usage
Oncor is expected to invest about $1.5 billion on CREZ and nearly $700 million
on AMS through 2012
1
2012E based on latest projections. Job positions 2012YTD as of
10/15/2012 Source: EFH 2011 and 2009 10K, Oncor 2Q 2012 earnings
presentation, 2012E based on latest projections |
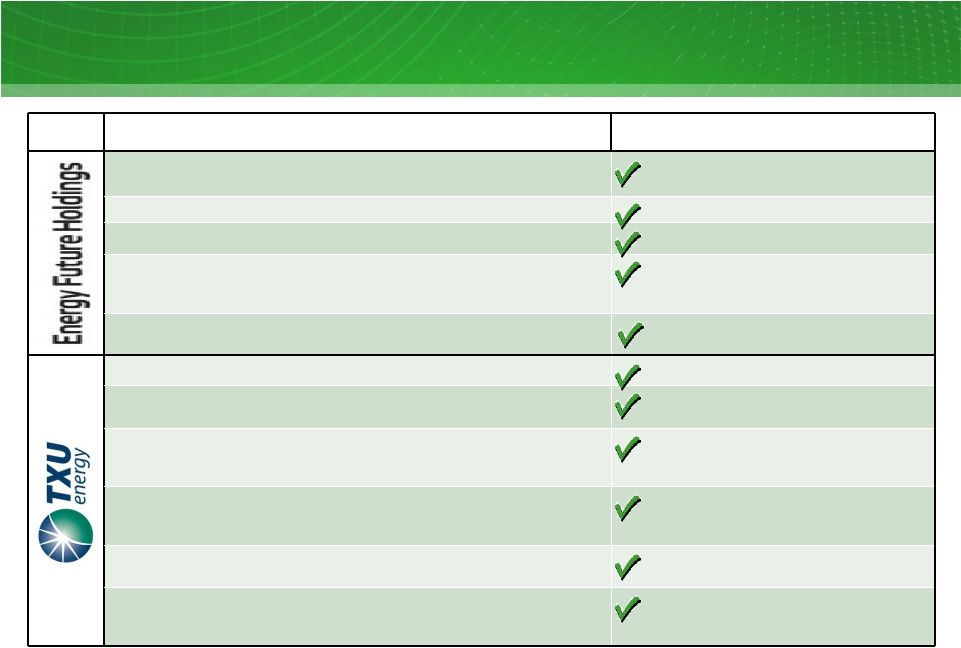 5
Commitment
Results
Reorganize
the
company
into
three
separate
and
distinct
business
units
with
separate boards, management teams and headquarters
Done
Maintain headquarters for each business in the DFW area
Done
Hold
majority
ownership
in
EFH
Corp.
and
Oncor
for
at
least
five
years
Done
Create a Sustainable Energy Advisory Board (SEAB) to provide input from
environmental, economic, customer, reliability and technology viewpoints
Done
Ensure employee compensation, health benefits and
retirement programs
Done
Deliver a 15% residential price cut to legacy PTB customers
Done
Guarantee price protection against changing market conditions through
December 2008 for legacy PTB customers
Done
Provide $150 million in low-income customer assistance over five years,
through 2012 ($125 million, ~10% discount for qualifying customers and $25
million in bill payment assistance)
Ongoing: On track to fulfill the $150 million
commitment by EOY 2012
Waive deposits for certain residential customers
Done: Implemented for eligible low-income
elderly customers and those with good
payment history
Form a new Low Income Advisory Committee (LIAC) comprising leaders in
the social service delivery sector
Done
Invest $100 million over five years through 2012 in new tools for customers
to manage their own electricity usage through innovative energy efficiency
and conservation approaches
Ongoing: On track to fulfill the $100 million
investment by EOY 2012
Completing Merger Commitments |
 Commitment
Results
Terminate eight planned coal units
Done
Provide increased investment in alternative energy
Ongoing
Start planning process for two IGCC commercial demonstration plants to
be located in Texas
Done: IGCC RFP issued 12/07; suspended 8/09
due to market conditions
Offset 100% of key emissions from new coal-fueled power plants and
reduce nitrogen oxide, sulfur dioxide and mercury emissions by 20% from
2005 total levels from coal-fueled power plants through nation’s largest
voluntary emissions reduction program
Ongoing
Double wind energy purchases to 1500 MW, maintaining status as the
largest buyer of wind power in Texas
Ongoing: More than 900 MW of wind energy
purchased
Join the FutureGen Alliance
Joined the FutureGen Alliance 12/07
1
Join USCAP
Applied for membership to USCAP 11/07
Expedite voluntarily the company’s 14.101 filing
Done
Make minimum capital spend of $3.6 billion for five years, through 2012
Done
Implement aggressive demand reduction program including an additional
five-year, $100 million investment in conservation and energy efficiency
Ongoing: On track to fulfill the $100 million
investment by EOY 2012
Implement no rate increases as a result of the transaction
Ongoing: Transaction has not resulted in any
rate increases for customers
File no system-wide rate case until 2008.
Done
Generate no new debt as a result of the transaction.
Ongoing: Transaction has not generated any
new debt for customers.
Limit debt so that Oncor’s debt-to-equity ratio is at or below the
assumed debt-to-equity ratio established by the PUC.
Ongoing: Ratio has not exceeded the ratio
established by the PUC of 60% debt, 40% equity
Agree to resolve all outstanding 14.101 issues.
Done
Issue one-time, $72 million retail customer credit.
Done
Provide annual reports to the PUC regarding commitments.
Ongoing
1
Did not renew membership for 2009 following DOE’s funding withdrawal
6
Completing Merger Commitments (continued) |
 We
Continue To Focus On Operational Excellence 7
Sustainable, Flexible, Dynamic Organization
Operational Excellence
Financial Optimization
Strategic Growth
Prudent financial
management
Optimize balance sheet
Optimize hedge platform
Identify and execute
internal / organic
opportunities
Seek external
opportunities
Maintain competitive
intelligence
Engage in key public
and governmental
affairs issues
Execute an aggressive
operational plan
Deliver top decile
results
Maintain a competitive
position in marketplace
Build infrastructure
Maintain and enhance
TXU brand
Identify and mitigate
operational risks |
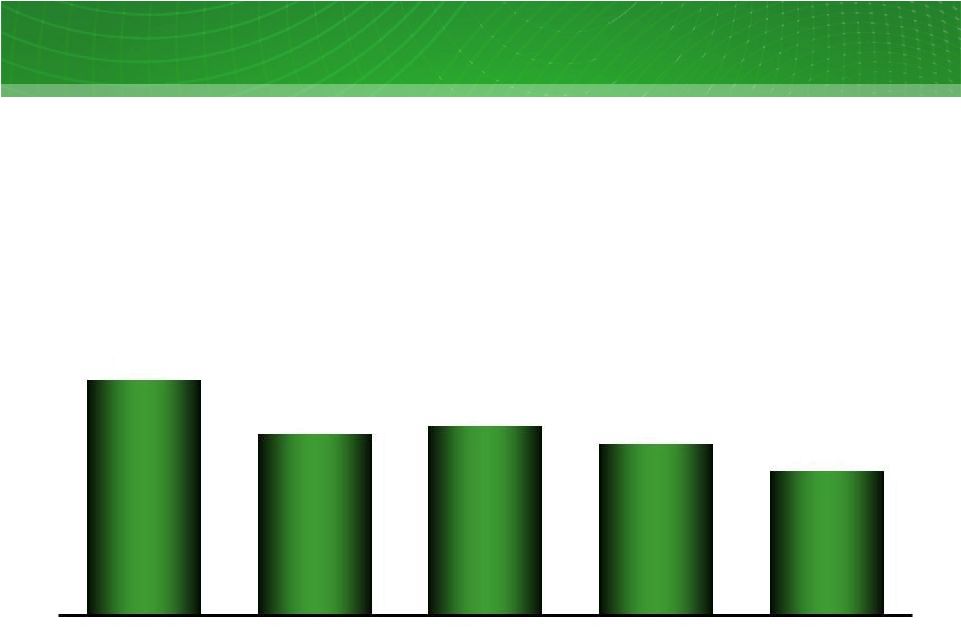 Which
Has Generated Strong Corporate Earnings EFH Adjusted EBITDA
1
2008-YTD Sept. 2012; $ millions
8
1
See Appendix for Regulation G reconciliations and definition
4,845
3,734
3,886
3,513
2,968
2008
2009
2010
2011
YTD 9/30/12 |
 9 |
 1
Includes four mothballed units (1,655 MW) not currently available for
dispatch 2
Nine months ended September 30, 2012 (excludes purchased power)
Business Profile
Generation
Largest coal & nuclear generation fleet in ERCOT
Top decile nuclear plant production and cost performance
Top quartile coal fleet production and cost performance
Largest mine-mouth coal operator in Texas
Gas
plant
operations
-
high
availability
to
meet
peak
demand
Active asset management and hedging program to maintain
value in volatile commodity market
Coal
Gas
Nuclear
Generating
Capacity
as
of
9/30/12
Total Net Generation for the nine months ended
September 30, 2012
15,427 MW
52,818 GWh
Safety
Wholesale power prices
Natural gas hedge program
Coal / Nuclear plant reliability
Mining operations / lignite cost
Fuel / O&M / SG&A costs
Peaking gas assets
Operational excellence / continuous improvement
Competitive market
Value Drivers
Luminant Is The Largest Power Generator In Texas
10
2%
2
1 |
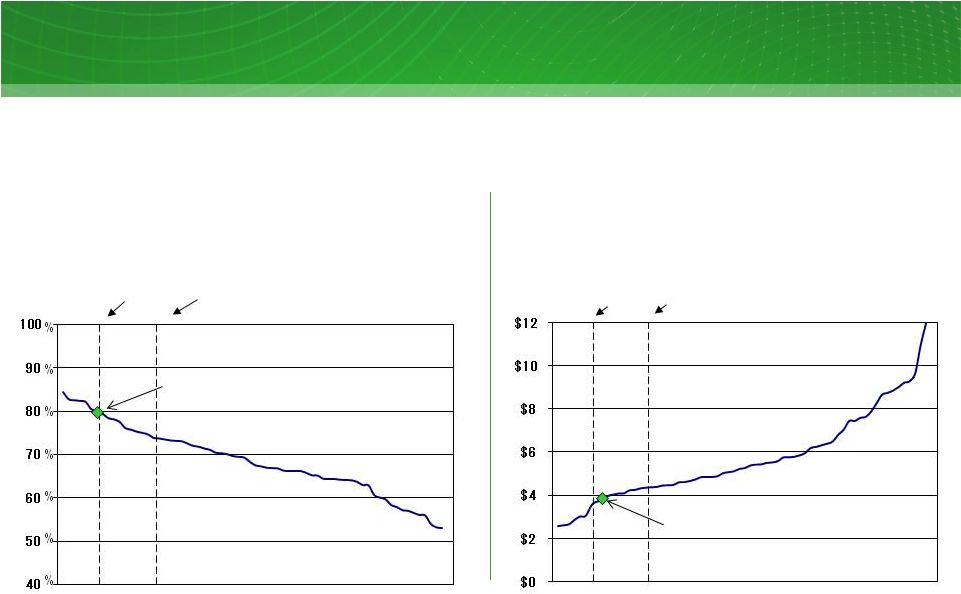 1
Benchmarking net capacity factors based on GADS. Luminant is legacy lignite/coal
fleet only and based on net GADS capacity Source: GKS
Top decile
79.7%
Top quartile
73.8%
Top decile
$3.63
Top quartile
$4.36
Luminant vs. US coal fleet net capacity factors
Percent
Luminant vs. US coal fleet O&M
$/MWh
Luminant Is A High-Performing Coal Operator
11
Luminant 09–11 fleet avg. = 79.9%
Luminant 09–11 fleet avg. = $3.87
1 |
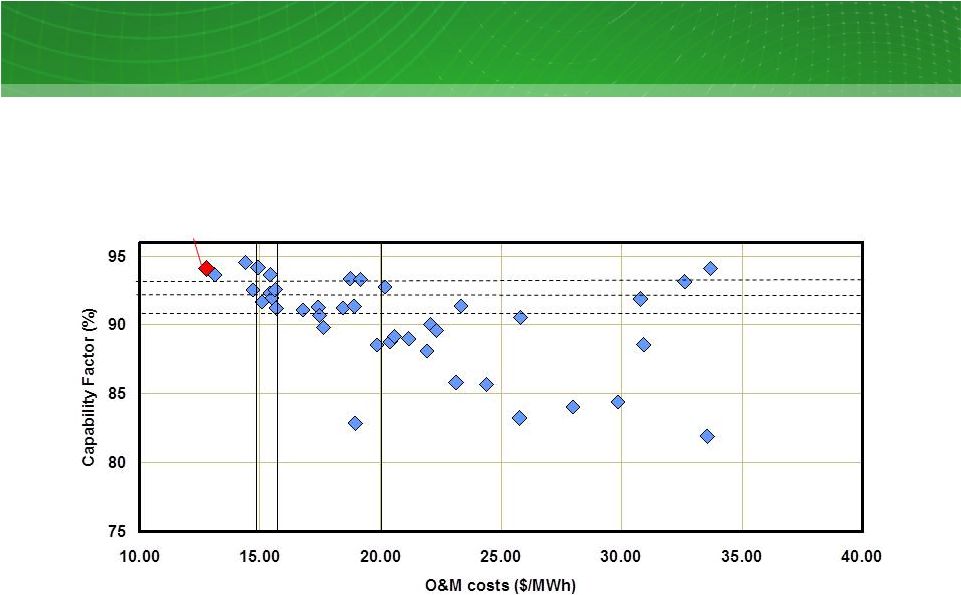 Comanche Peak Plant Is One Of Highest-Performing
Nuclear Plants In The Country
09-11 Capability Factor / O&M
$/MWh
Benchmarking peer set defined as 18 month fuel cycle U.S. nuclear plants
Source: EUCG May, 2012 Comprehensive Data Release for Cost and WANO for Capability
Factors CPNPP
Decile
Quartile
Median
Decile
Quartile
Median
12 |
 13 |
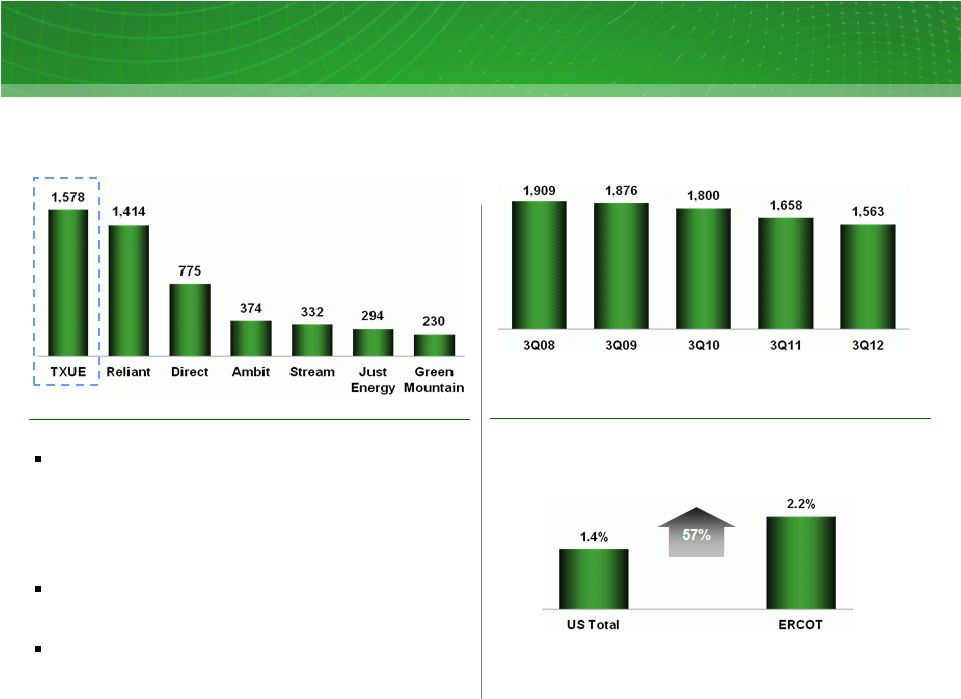 TXU
Energy Is The Largest Retail Electricity Provider In Texas
Strong customer value proposition
•
High brand recognition in Texas competitive areas
•
Competitive retail prices
•
Innovative products and services
•
Committed to low-income customer assistance
•
Improved customer care delivery capabilities
Balance Sheet
•
Combined TCEH risk management and liquidity efficient capital
structure
Expected margins (5–10% net)
Source:
KEMA
Retailer
Landscape
Report
dated
9/28/12;
As
of
June
2012
Source:
Residential Customers / Meters
(in thousands)
Residential Customers
(in thousands)
Projected Annual Demand Growth
CAGR (2010A-2020E; percent)
Value Drivers
14
Q2-Q3 Customer Attrition
1.5%
(1.8)%
(1.6)%
(2.8)%
(1.0)%
NERC 2011 Long-Term Reliability Assessment (Summer Demand)
ERCOT May 2012 CDR report |
 Executing A Marketing Strategy Balancing Value and Price
15
Price Orientation
Value Orientation
New offers are reinforcing TXU Energy’s value proposition
|
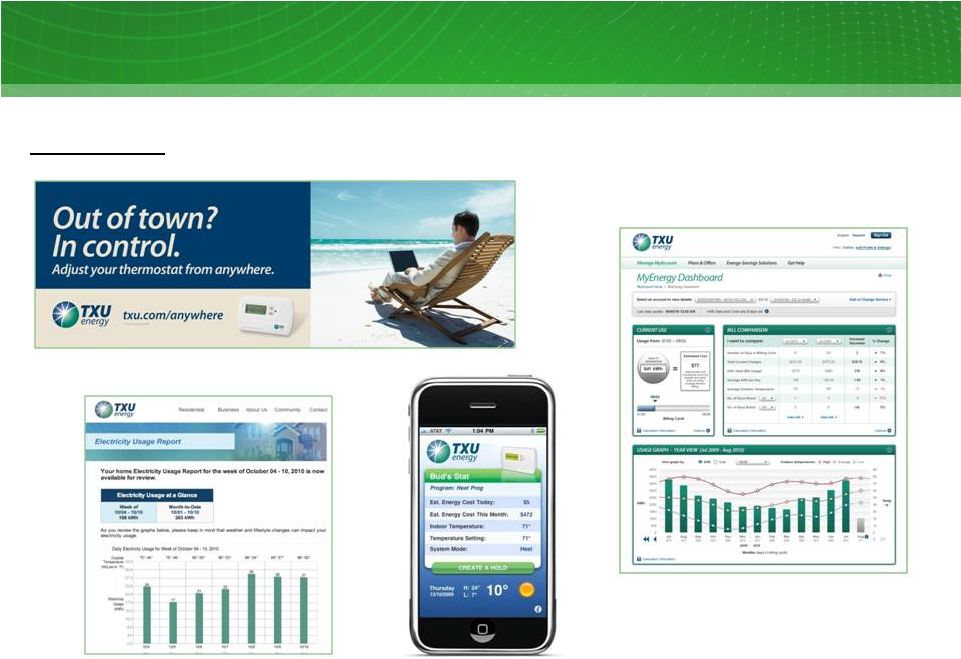 And
Incorporating Technological Solutions Innovations
TXU Energy MyEnergy Dashboard
TXU Energy Electricity Usage Report
TXU Energy’s iPhone and Android Apps
16
Brighten
SM
iThermostat |
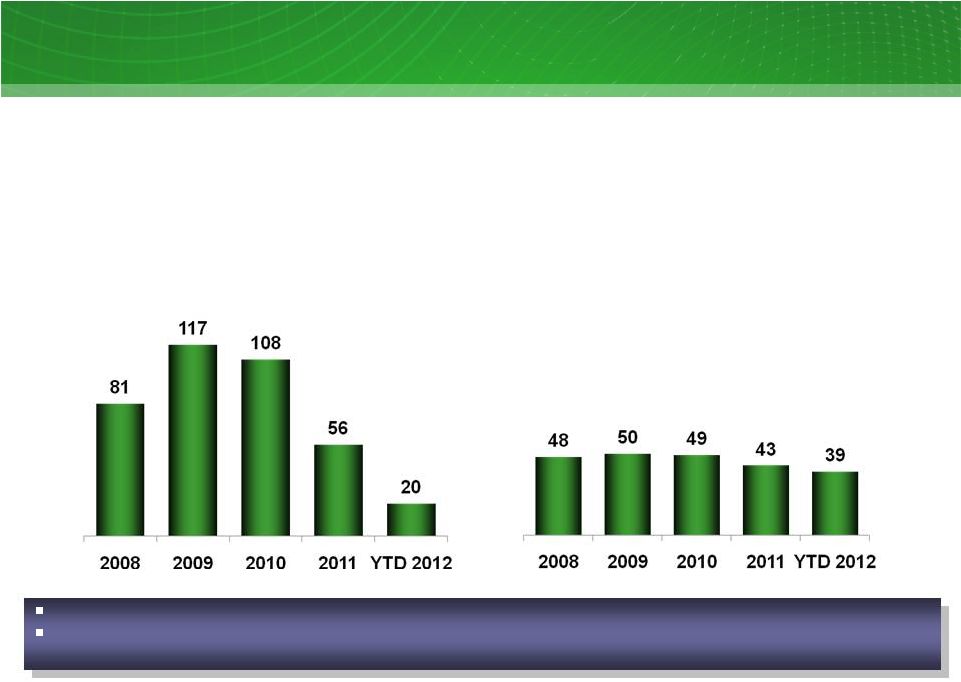 17
While Managing Expenses And Improving Cash Flow
Bad debt expense
2008 -
YTD Sep 2012; $ millions
Days sales outstanding
2008 –
YTD Sep 2012; Days
TXU Energy lowered bad debt
over time….
…and generated cash flow by
reducing days sales outstanding
YTD Sep 2012 Bad Debt expense was $20 million, on track to be the lowest in TXUE recent history Days Sales Outstanding have improved
significantly due to collection initiatives, customer mix and credit policy improvements |
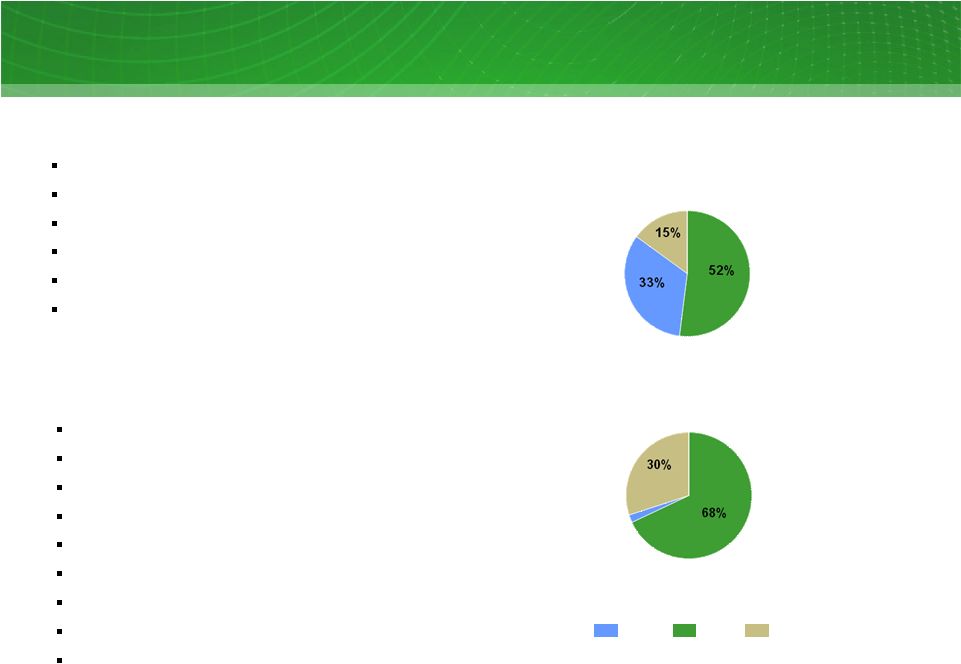
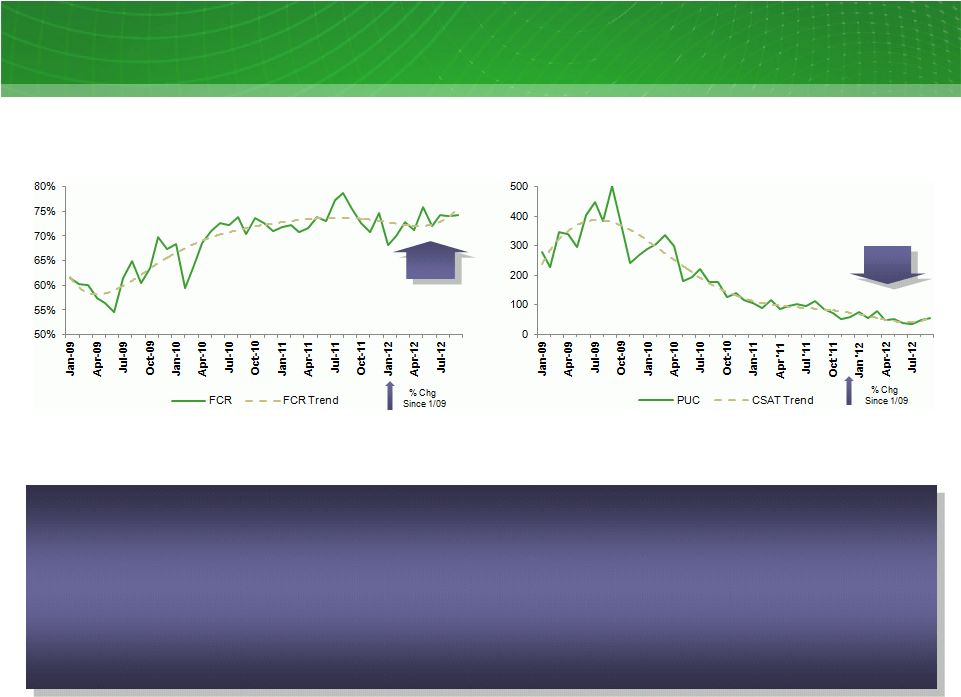 And
Providing A Strong Customer Experience 18
20%
80%
First Call Resolution
PUC Complaints
Enhanced Customer Experience and Product Innovation:
•
Record performance -
first call resolution, customer satisfaction, PUC complaints
•
Lower operating costs through gains in technology and self service
•
First
to
market
with
innovations
leveraging
Smart
Grid
–
Free
Nights,
iPhone
app,
etc.
•
Reduced customer net attrition in 2012 Q3; approximately two-thirds vs. 2011
Q3 •
Proven risk management strategies delivering more predictable pricing to customers |
 19 |
 20
New Oncor Infrastructure
Oncor’s investment in CREZ will receive accelerated recovery,
consistent with other transmission investment, mitigating regulatory delay
Oncor has invested $1.36 billion cumulatively
Oncor has invested $1.36 billion cumulatively
on CREZ projects as of September 30, 2012
on CREZ projects as of September 30, 2012
Oncor expects to invest ~$2.0 billion on
CREZ-related transmission lines…
…to support the continued buildout of
…to support the continued buildout of
to support the continued buildout of
wind capacity in Texas
wind capacity in Texas |
 21
Oncor Demand-Side Management
Oncor recovers its investment through a
PUC
1
-approved surcharge
Customer monitoring of consumption
“Smart”
appliances
Dynamic pricing
Oncor’s
energy
efficiency
filing
has
been
approved
and
is
reflected
in
rates
…that will enable key DSM
initiatives 1
Public Utility Commission of Texas
Oncor has installed approximately 3.1 million meters as of
September 30, 2012, including 802,000 in the nine months
ending September 30, 2012
Oncor has deployed ~$642 million of
capital for advanced metering
initiatives…
|
 Energy Future Holdings Corp.
22 |
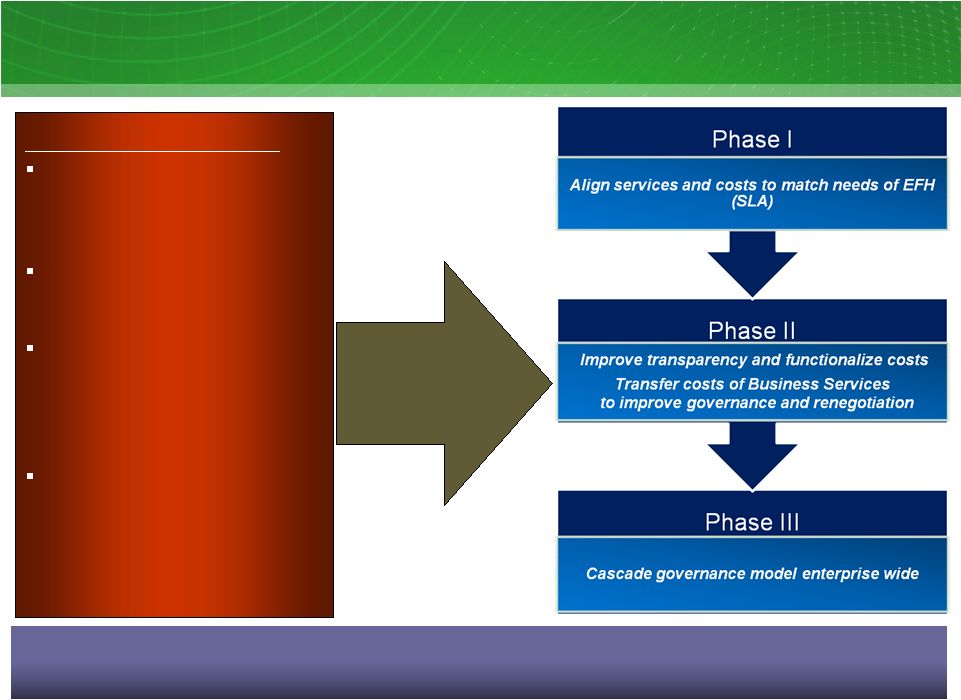 EFH Transformed Business
Services To Focus on Service, Excellence and Governance
23
Before
July
2008
Business Services costs
were not fully categorized
or allocated
Service Level Agreements
(SLA) were not in place
Governance over shared
services and alignment
with businesses needed to
be enhanced
Transparency to Business
Services cost needed to be
improved
Establish
Service,
Excellence &
Governance
Model
The objective was to create a cost-effective shared services group that provided
service levels consistent with a large scale competitive / regulated energy company
|
 To
Create Value For The Rest Of The Enterprise 24
Enhanced liquidity through balance sheet and tax initiatives
Implemented cost controls
Enhanced enterprise-wide risk management policies and procedures
Streamlined corporate governance and developed policies and
procedures consistent with strategic goals and objectives
Recruited and retained key leadership talent and created programs to
identify and develop in-house talent
Formed and maintained key stakeholder relationships with industry
participants and other nongovernmental organizations (NGOs)
Strengthened IT infrastructure
–
Implemented new TXU Energy customer care and billing system
–
Invested in upgrading aging infrastructure |
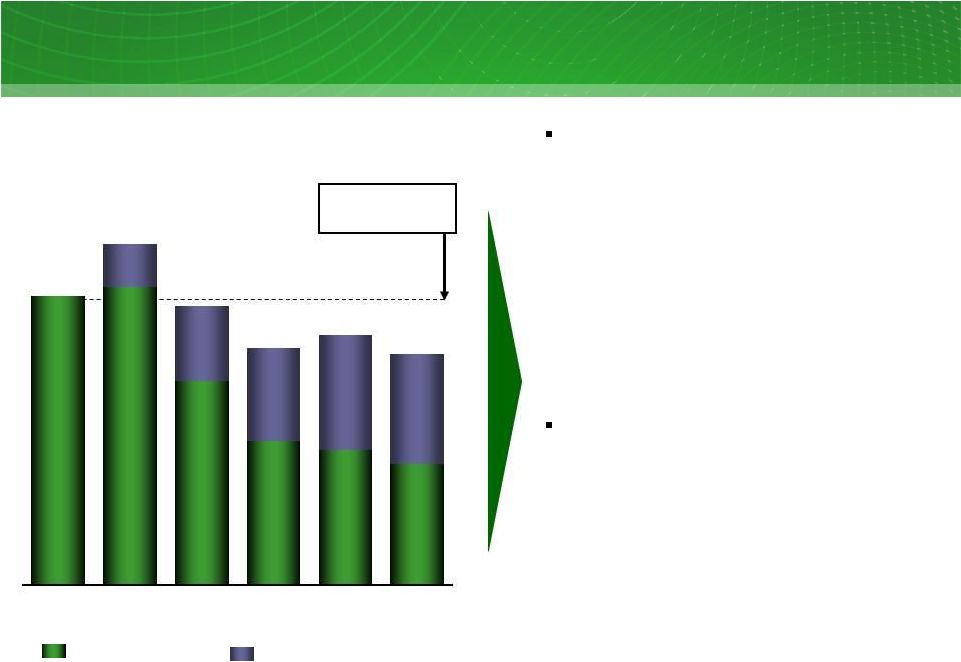
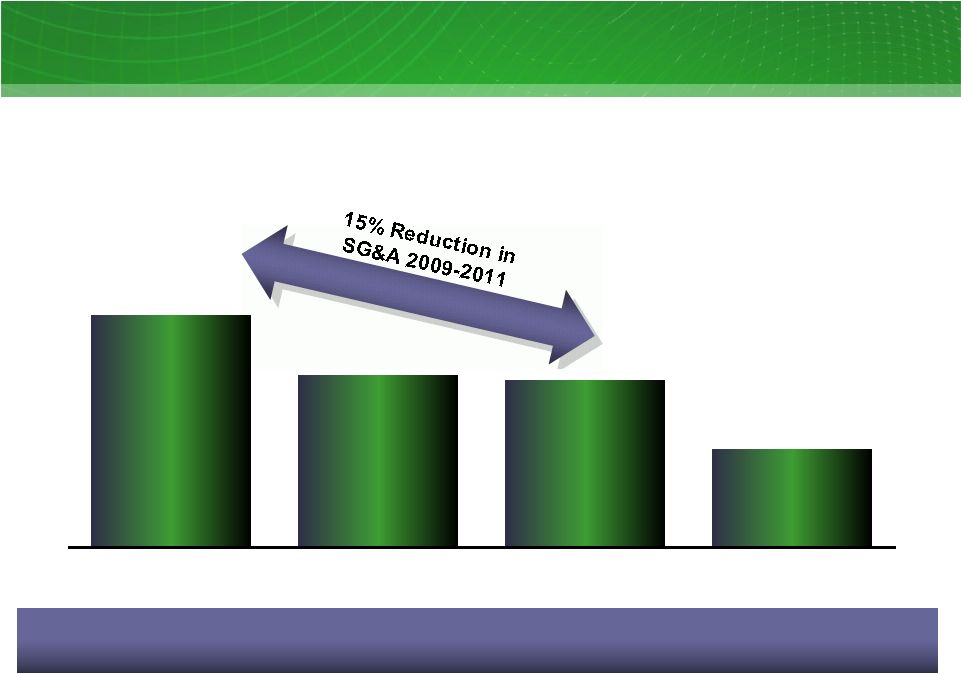 And
Drive Down Consolidated SG&A Over Time 25
Consolidated SG&A
2009-2012; $ millions
SG&A has declined over $130MM from 2009 to 2011
1
Pro-forma for the deconsolidation of Oncor that occurred prospectively in
2010 875
1
751
742
491
2009
2010
2011
YTD 9/30/12 |
 Key
Takeaways – Maximizing Enterprise Value
26
Improved the company’s reputation and met merger commitments
–
Engaged company stakeholders including legislators and NGOs
–
Invested in the surrounding communities
Invested in Texas -
$10+ billion in capital and added ~1,900 positions
Maintained focus on Operational Excellence
–
Safe and reliable operating performance at Luminant
–
TXU Energy managing margins and controlling costs amidst increased competition
–
Business Services restructured operations, strengthened infrastructure and
controlled costs
A keen focus on operational excellence has resulted in strong operating and
financial performance amidst depressed commodity prices
|
 27
APPENDIX |
 28
Largest competitive electric
generator in Texas
Largest lignite/coal and
nuclear generation fleet in
Texas
Low-cost lignite reserves
Largest T&D utility in
Texas
Leader in smart-grid
development
Constructive regulatory
regime
Largest retail
electricity provider in
Texas
Strong customer value
proposition
The largest power generator, retail electricity provider and transmission &
distribution utility in Texas
Energy Future Holdings Overview |
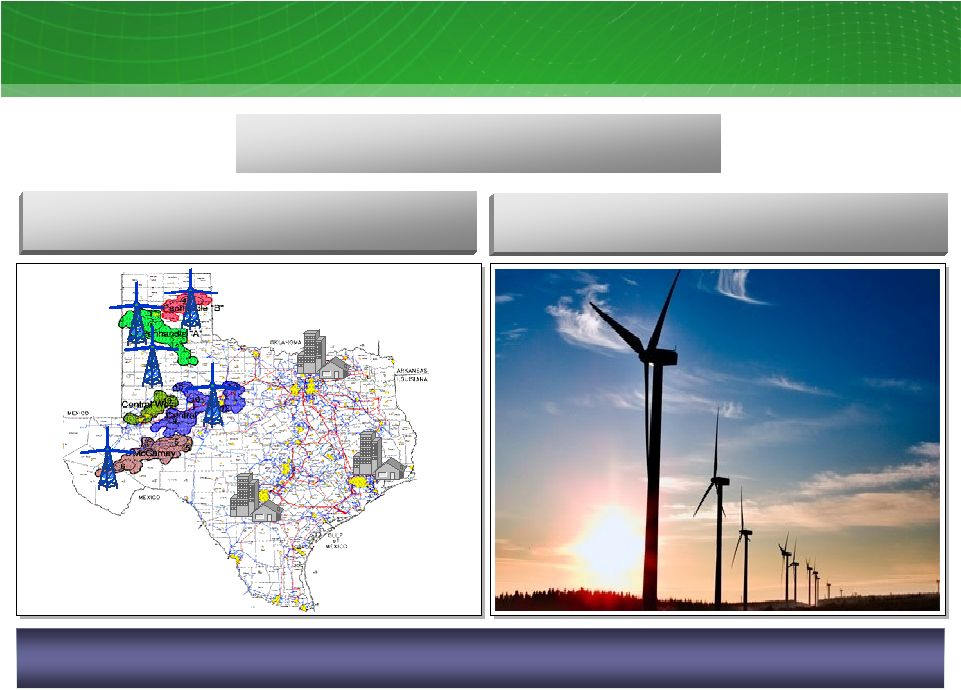
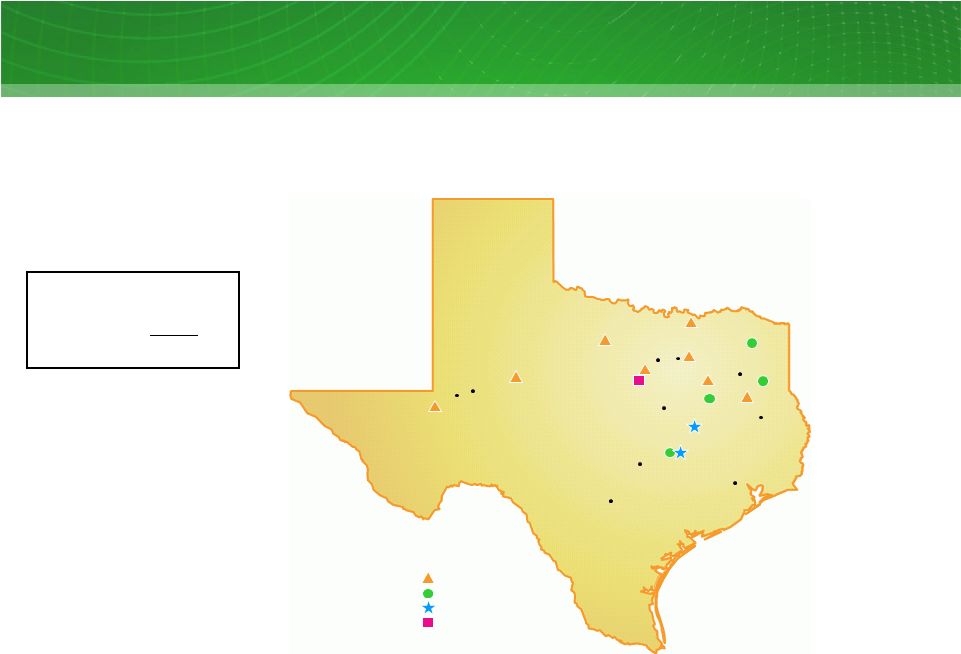 Luminant Generation Facilities
29
Generation capacity in ERCOT
At 9/30/12; MW
Nuclear
2,300 MW
Coal
8,017
Natural gas
1
5,110
Total
15,427 MW
1
Includes four mothballed units (1,655 MW) not currently available for
dispatch HOUSTON
SAN ANTONIO
AUSTIN
WACO
MIDLAND
LUFKIN
ODESSA
DALLAS
FORT
WORTH
Power Plants
Natural gas
Coal
Coal, new build
Nuclear |
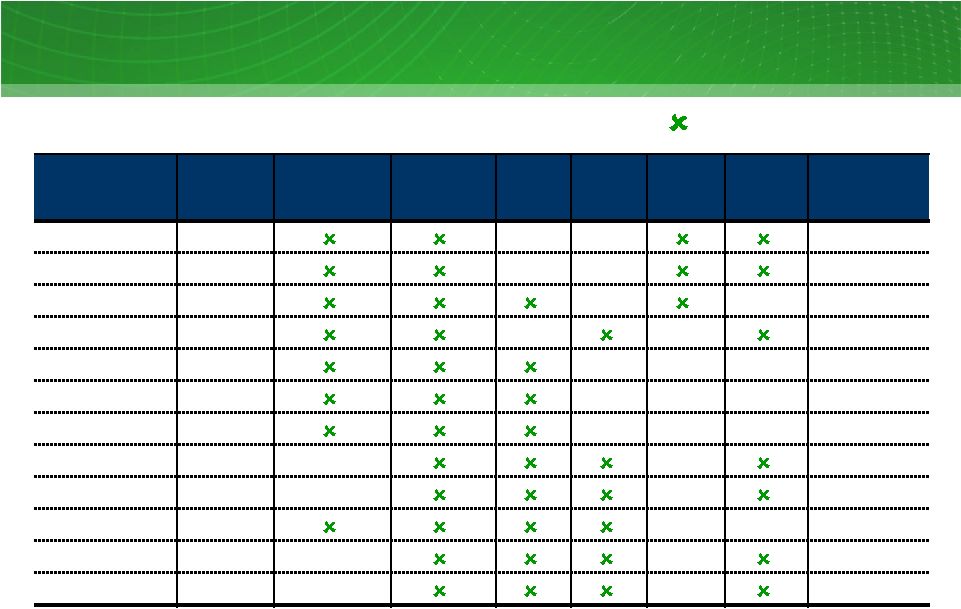 Currently
Installed
1
Environmental
Control
Equipment
At
Luminant Coal Units
Currently installed
1
There is no assurance that the currently installed control equipment will satisfy
the requirements under any change to applicable law or any future Environmental Protection Agency or
Texas Commission on Environmental Quality regulations
2
FGD refers to flue gas desulfurization systems that reduce SO2 emissions with
co-benefits of other emissions reductions 3
Activated carbon injection systems reduce mercury emissions
4
ESP refers to electro-static precipitation systems. ESP and bag-house
systems reduce particulate emissions with co-benefits of other emissions reductions
5
SNCR refers to selective non-catalytic reduction systems. SCR refers to
selective catalytic reduction systems. Both systems reduce NOx emissions
6
PRB refers to Powder River Basin coal transported to plants via railcar
30
Coal Unit
Capacity
(MW)
FGD
(Scrubber)
2
Activated
Carbon
Injection
3
ESP
4
SNCR
5
SCR
5
Bag-
house
4
Fuel Source
Oak Grove 1
800
Lignite
Oak Grove 2
800
Lignite
Sandow 4
557
Lignite
Sandow 5
580
Lignite
Martin Lake 1
750
Lignite/PRB
6
Martin Lake 2
750
Lignite/PRB
Martin Lake 3
750
Lignite/PRB
Monticello 1
565
Lignite/PRB
Monticello 2
565
Lignite/PRB
Monticello 3
750
Lignite/PRB
Big Brown 1
575
Lignite/PRB
Big Brown 2
575
Lignite/PRB |
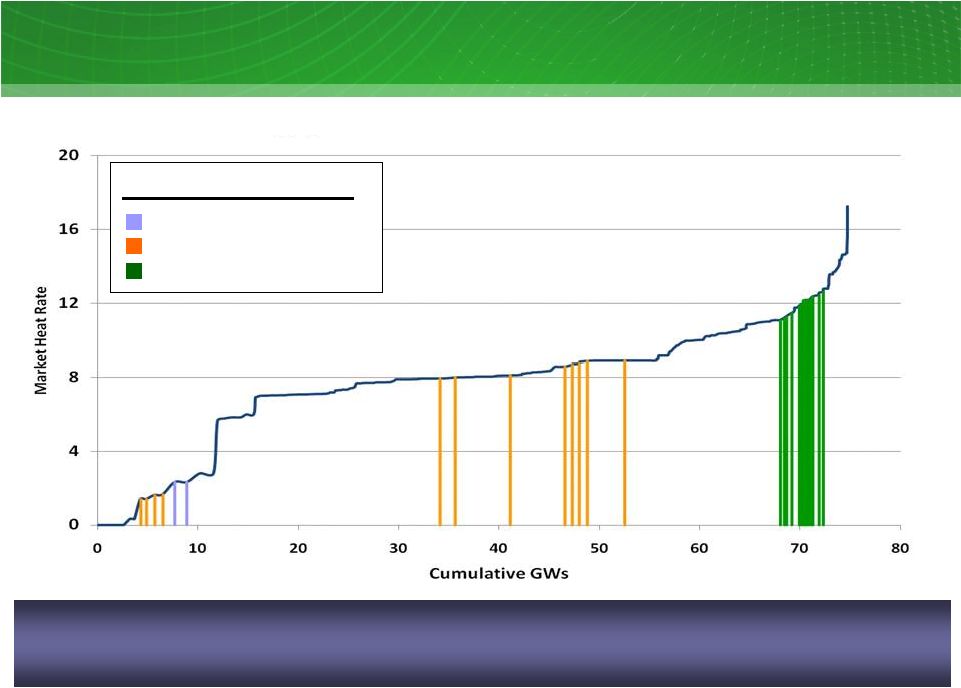 Summer 2012 ERCOT supply stack -
indicative
ERCOT Supply Stack
Sources: ERCOT and Energy Velocity
®, Ventyx Luminant plants are
typically on the “book-ends” of the supply stack; however, the
low natural gas prices of summer 2012 “pushed”
Luminant legacy lignite/coal units up the
supply stack. ERCOT’s
marginal price is set by natural gas in most hours of the year Luminant
nuclear plant Luminant lignite/coal plants
Luminant gas plants
Legend
31 |
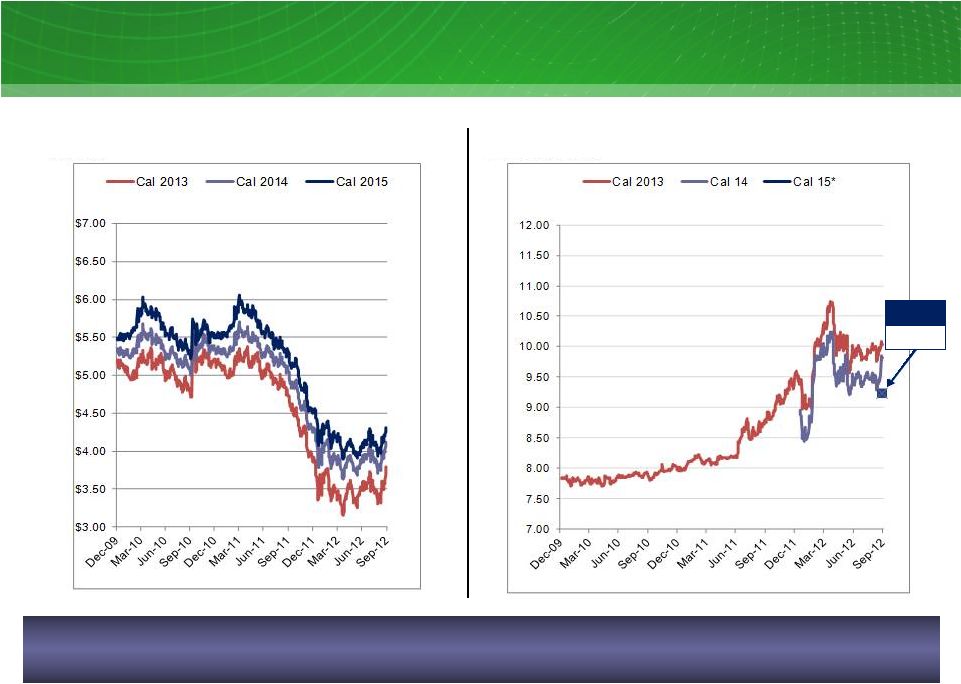 HSC
Natural Gas Futures $/MMBtu
ERCOT NHub ATC (7x24) Heat Rate
MMBtu/MWh
*estimate based on
limited broker quotes
32
Forward Natural Gas Prices and Heat Rates
Forward gas prices have shown some indications of stabilizing.
Near term heat rates continue to show volatility
2015 HR*
9.23 |
 33
ERCOT Capacity, Demand and Reserve (CDR) Summary, May 2012. Prior CDR used
for 2012 ERCOT filing on Reserve Margin Analysis, PUCT Project No. 40000,
October 22, 2012 Resource Adequacy in ERCOT
ERCOT reserve margin
2012A-2017E; percent
13.75% target
reserve margin
Drivers of ERCOT October 2012 filing on
Reserve Margin Analysis
–
Reduced load growth rate to Moody’s “Low”
economic growth forecast
•
Lowered 2013 load forecast by ~1,000
MW (~1.5% lower)
•
Approximately 0.5% reduction of 2013-
2018 annual load growth rate
–
Starting in 2014, added pending resources
not included in May 2012 CDR of ~1,000 MW
Recent and pending PUCT/ERCOT actions
and potential deliberations:
–
Increased system-wide offer cap to $5,000
effective June 1, 2013; $7,000 effective June
1, 2014; and $9,000 effective June 1, 2015
–
ERCOT December CDR Report
–
ERCOT review of whether 13.75% is the
appropriate target reserve margin
–
Continued PUCT evaluation of long-term
solution
13.9
16.4
13.4
11.4
12.0
11.1
14.3
9.8
6.9
6.5
5.8
2.1
3.6
4.5
5.5
5.3
'12
'13
'14
'15
'16
'17
1
2
May 2012 CDR
1
Increase from Oct 2012 filing
2 |
 34
ERCOT Average Daily Profile Of Load And Wind
Source: ERCOT
ERCOT average daily profile of load and wind output
August 2012; mixed measures
Average
Load
Average
Wind Output
Load
(aMW)
Wind Output
(MW)
Wind operating characteristics necessitate additional resources for reliability
Hour |
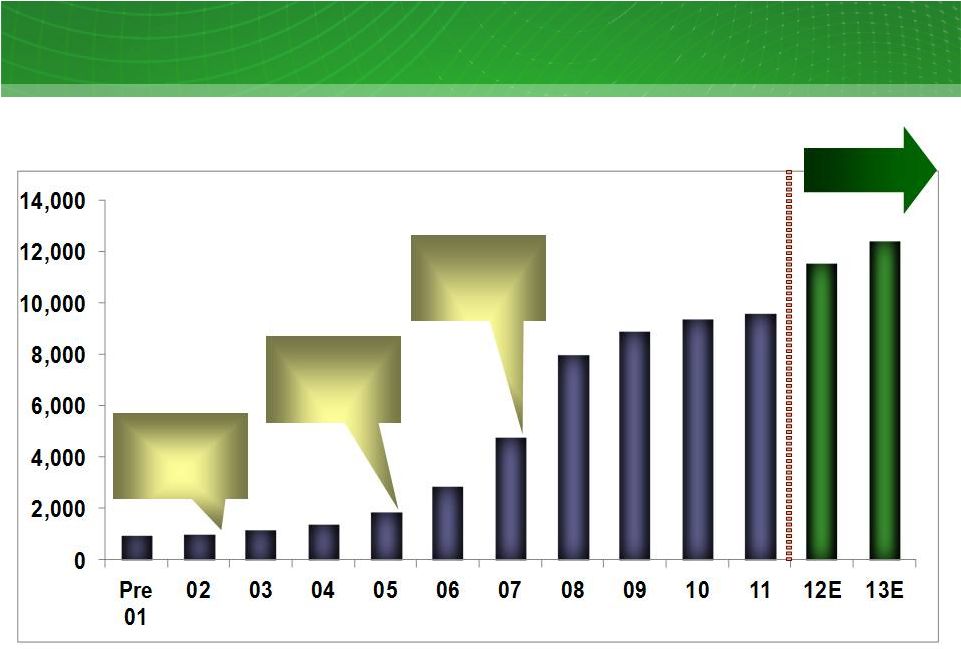 35
ERCOT Wind Additions
RPS¹
Target
of 2,880 MW
by 2009
RPS¹
Target
of 5,880 MW
by 2015
CREZs
Designated
ERCOT SGIA²
Cumulative wind capacity additions in ERCOT
Pre 01 -
11; 12E -
13E; MW
Renewable Portfolio Standard
Signed Generation Interconnect Agreement
Source: ERCOT –
September 2012 System Planning Report to the Reliability and Operations
Subcommittee 1
2 |
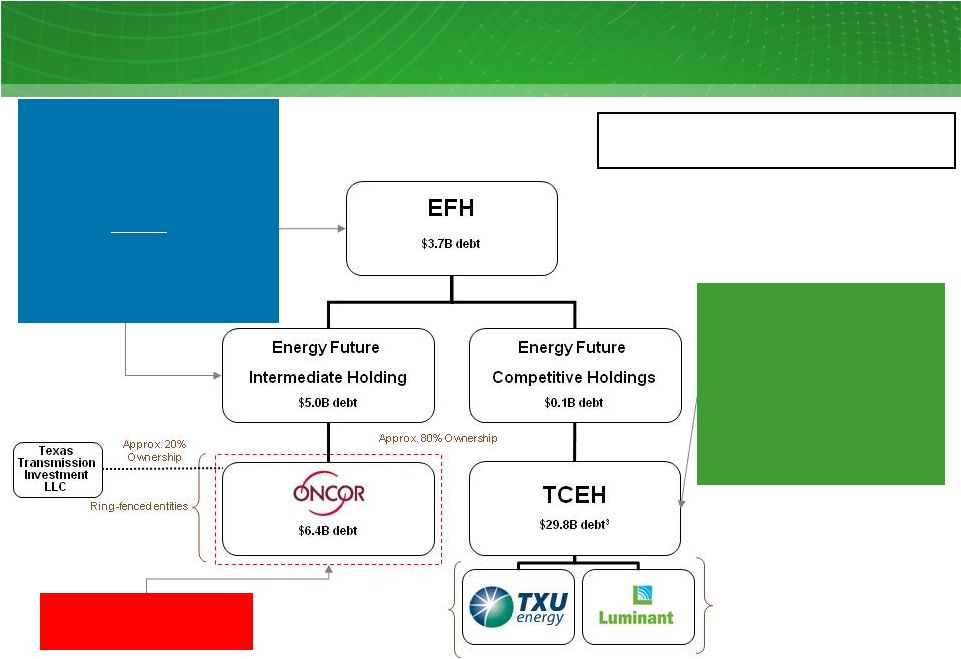 $45.0B total gross debt
$41.9B total net debt
1
Gross debt excludes unamortized debt discounts and premiums, fair value discounts
and premiums, and A/R securitization 2
Total net debt equals total gross debt less total cash & cash equivalents and
restricted cash of ~$3.1 billion 3
Excludes $184 million from A/R securitization
4
Excludes intercompany note balances
EFH Capital Structure Overview
36
$4.0B
EFIH 6.875% 1
Lien due 2017
EFH 9.75% 1
Lien due 2019
EFIH 9.75% 1 Lien due 2019
EFH 10.00% 1 Lien due 2020
EFIH 10.00% 1 Lien due 2020
$0.4B
EFIH 11.00% 2
Lien due 2021
$1.7B
EFIH 11.75% 2 Lien due 2022
$0.7B
Unsecured
$1.8B
EFH 5.55% Series P due 2014
EFH 6.50% Series Q due 2024
EFH 6.55% Series R due 2034
$0.1B
Unsecured Other
$16.4B
1 Lien TLB / Deposit LC due 2017
$3.85B
1
Lien TLB / Deposit LC due 2014
$0.2B
Revolver due 2016
$0.1B
Revolver due 2013
$1.75B
11.5% 1 Lien Notes due 2020
$1.6B
15.0% 2 Lien Notes due 2021
$4.8B
10.25% LBO due in 2015
10.50% LBO due in 2016
$1.1B
Unsecured PCRBs/Other
$0.8B
Revolver @ L+125 bps due 2016
$5.1B
Long Term Debt @ avg. 6.1%
$0.5B
Securitization Debt @ avg. 5.3%
Balances as of 9/30/2012 Pro Forma
for
October
2012
Issuance
4
st
st
st
st
st
nd
nd
st
st
st
nd
1
2
EFH 10.875% LBO due 2017
EFH 11.25% LBO due 2017 |
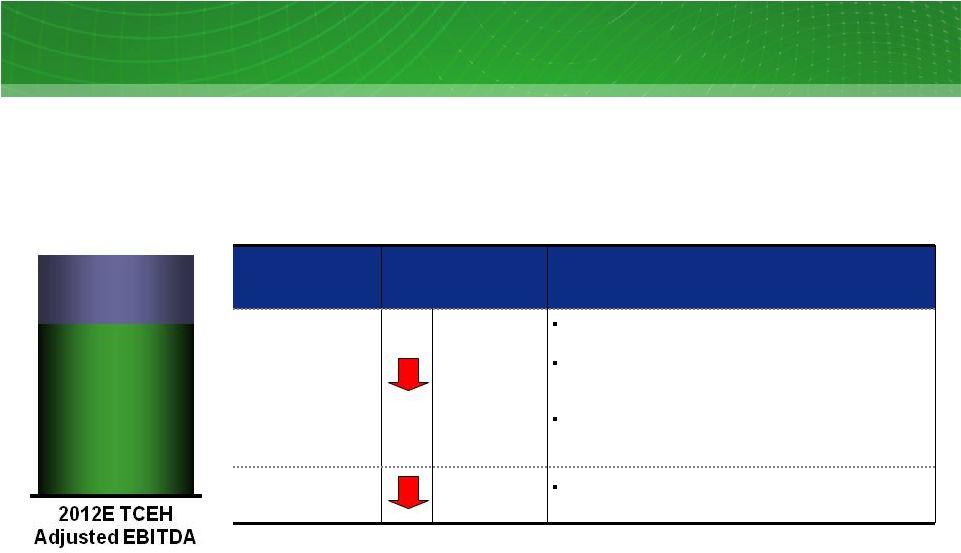 Key
Drivers 2013 Est. Impact vs.
2012 (millions)
Assumptions
Commodity
$600 -
$700
Smaller hedge position: ~115M mmbtu position @
~$3.05 lower price¹
Change in average hedge price: $0.47/mmbtu
lower average price¹
in 2013 vs 2012 on ~500M
mmbtu
New
2013
power
sales
at
higher
expected
heat
rate
net of lower implied market gas prices on ~68-70
TWh²
Retail
$60 -
$120
Lower volumes, weather, and continued
competitive pricing environment in 2013
37
2013 TCEH Adjusted EBITDA (non-GAAP) Key Drivers
$?
Q4
1
Weighted average prices are based on NYMEX Henry Hub prices of forward natural gas
sales positions in the long-term hedging program (excluding the impact of
offsetting purchases for rebalancing and pricing point basis transactions)
2
Excludes volume committed under a long term purchase contract
3
See Appendix for Regulation G reconciliations and definition
$2,854
YTD
9/30/12
3 |
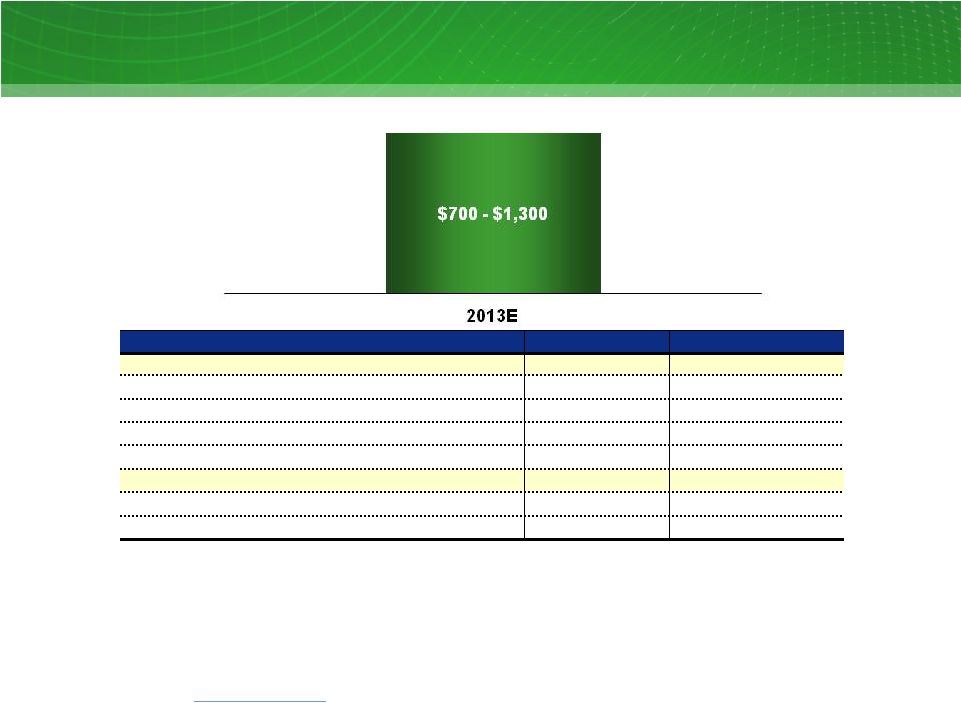 38
TCEH Open EBITDA (non-GAAP) Estimate
Assumptions
Units
2013E
Wholesale
Total coal and nuclear generation
TWh
72 –
74
Estimated power price²
$/MWh
$37 -
$39
Average coal and nuclear cost³
$/MWh
$30 -
$32
Retail
Revenues
$
$4.0 -
$5.0
Profitability percentage (after tax)
%
5 -
10%
TCEH Open EBITDA (non-GAAP)¹
Estimate
13E: $ millions
1
Open EBITDA is intended to provide a view of our projected earnings for the fiscal
year ended December 31, 2013, assuming that (1) our expected coal and nuclear
generation for 2013 is sold at market observed forward power prices as of 7/31/2012
less our expected costs to produce the power, including expected fuel expense,
O&M and SG&A expenses, (2) our retail revenues are derived from market
observed retail rates, and (3) we do not engage in any natural gas and power hedging
activities. This is not intended to serve as an indication of what we expect
our earnings to be for the fiscal year ended December 31, 2013, or how we intend to
operate the business. EFH Corp. does not provide projected EBITDA for future
periods and, as a result, there is no comparable GAAP financial measure to which we
can reconcile Open EBITDA
2
Estimated wholesale power prices for 2013 are based on average ERCOT North Hub
prices as of 7/31/2012 3
Includes fuel, O&M and SG&A expenses
4
Based on average residential pricing and ~$1.5 billion of small and large business
revenue based on trailing 12 months (Q4 2011 and Q1-Q3 2012). For residential
new offer pricing please go to
www.powertochoose.org 5
Calculation assumes a 35% overall tax rate
5
4 |
 ELA
and DIG 39
ELA and DIG.
o
EFH
has
a
$19
billion
excess
loss
account
(ELA)
and
a
$4
billion
deferred
intercompany
gain
(DIG),
both
of
which
are reflected in the tax basis of the stock of EFCH held by EFH.
o
The DIG was created in connection with internal reorganizations and the ELA was
created in connection with financing
transactions
that
involved
TCEH
and
its
assets
but
not
EFIH
or
Oncor
Holdings.
We have no plans to trigger the ELA or the DIG, and we are working to eliminate the
ELA and DIG to provide additional structuring flexibility.
o
An ELA and a DIG are generally included in taxable income only if a transaction
occurs that triggers such items.
We have no plans to implement a transaction that would trigger the ELA or the
DIG. o
As we are evaluating strategies to simplify our tax structure and eliminate the
ELA and the DIG, we included the tax-related
disclosure
in
our
Form
10-Q.
We
filed
a
Form
8-K
on
November
6,
2012
in
response
to
questions
from investors about our Form 10-Q disclosure. |
 ELA
and DIG (continued) 40
Tax Sharing Among the EFH Tax Group if the ELA and/or DIG were Triggered:
o
Pursuant to applicable Treasury regulations and published guidance of the Internal
Revenue Service, corporations that are members of a consolidated group have
joint and several liability for the taxes of such group. TCEH’s
subsidiaries include both regarded corporations and entities that are disregarded
for federal income tax purposes. o
While disregarded entities are not corporate members of the consolidated tax group
within the meaning of the Internal Revenue Code, the Internal Revenue
Service has issued guidance stating its informal position that a
disregarded
entity
may
be
liable
for
taxes
on
income
that
it
is
responsible
for
generating.
(See
IRS
CCA
199930013, 7/30/1999; CCA 200235023, 6/20/2002).
o
EFH and certain of its subsidiaries (including EFCH, EFIH, and TCEH, but not
including Oncor Holdings and Oncor) are bound by a tax sharing agreement,
which provides for the allocation of income tax liabilities among the
parties thereto. EFH, Oncor Holdings and Oncor are parties to a separate tax
sharing agreement, which governs the computation of federal income tax
liability between EFH, on one hand, and Oncor Holdings, Oncor and the other
ring-fenced entities, on the other hand. –
The tax sharing agreements provide, among other things, that a disregarded entity
is required to make payments to EFH in an amount calculated to approximate
the amount of tax liability such entity would have owed if it filed a
separate corporate tax return. |
 Appendix –
Regulation G Reconciliation
41 |
 Financial Definitions
Measure
Definition
Adjusted (non-GAAP)
Operating Results
Net income (loss) adjusted for items representing income or losses that are not
reflective of underlying operating results. These items include
unrealized mark-to-market gains and losses, noncash impairment charges and other charges, credits or gains that
are unusual or nonrecurring. EFH Corp. uses adjusted (non-GAAP) operating
results as a measure of performance and believes that analysis of its business
by external users is enhanced by visibility to both net income (loss) prepared in accordance with
GAAP and adjusted (non-GAAP) operating earnings (losses).
Adjusted EBITDA
(non-GAAP)
Competitive Business
Results
Refers to the combined results of the Competitive Electric segment and
Corporate & Other. Competitive Electric segment refers to the EFH
Corp. business segment that consists principally of TCEH. Contribution Margin
(non- GAAP)
Operating revenues less fuel, purchased power costs, and delivery fees, plus or
minus net gain (loss) from commodity hedging and trading activities, which on
an adjusted (non-GAAP) basis, exclude unrealized gains and losses.
EBITDA
(non-GAAP)
Net income (loss) before interest expense and related charges, income tax expense
(benefit) and depreciation and amortization. GAAP
Generally accepted accounting principles.
Purchase Accounting
Regulated Business
Refers to the results of the Regulated Delivery segment, which consists largely of
EFH Corp.’s investment in Oncor. 42
EBITDA adjusted to exclude interest income, noncash items, unusual items, results of discontinued
operations and other adjustments allowable under the EFH Corp. senior secured notes
indentures. Adjusted EBITDA plays an important role in respect of certain covenants
contained in these indentures. Adjusted EBITDA is not intended to be an alternative to GAAP results as a
measure of operating performance or an alternative to cash flows from operating activities as a measure
of liquidity or an alternative to any other measure of financial performance presented in
accordance with GAAP, nor is it intended to be used as a measure of free cash flow available for
EFH Corp.’s discretionary use, as the measure excludes certain cash requirements such as
interest payments, tax payments and other debt service requirements. Because not all companies use identical calculations,
Adjusted EBITDA may not be comparable to similarly titled measures of other companies. See EFH
Corp.’s filings with the SEC for a detailed reconciliation of EFH Corp.’s net income
prepared in accordance with GAAP to Adjusted EBITDA.
The purchase method of accounting for a business combination as prescribed by GAAP, whereby the
purchase price of a business combination is allocated to identifiable assets and liabilities
(including intangible assets) based upon their fair values. The excess of the purchase
price over the fair values of assets and liabilities is recorded as goodwill. Depreciation and amortization due to purchase
accounting represents the net increase in such noncash expenses due to recording the fair market values
of property, plant and equipment, debt and other assets and liabilities, including intangible
assets such as emission allowances, customer relationships and sales and purchase contracts with
pricing favorable to market prices at the date of the Merger. Amortization is reflected in revenues,
fuel, purchased power costs and delivery fees, depreciation and amortization and interest expense in
the income statement. |
 43
Table
1:
EFH
Corp.
Net
Debt
Reconciliation
1
As of September 30, 2012
$ millions
Description
9/30/12
Short-term borrowings
469
Long-term debt due currently
104
Long-term debt, less amounts due currently
37,428
Total debt (GAAP) as of September 30, 2012
38,001
Add principal amount of long-term debt issuance in October 2012
253
Less:
Short-term borrowings related to accounts receivable securitization
program (184)
Net unamortized discount, fair value discount and premiums
515
Total debt
38,585
Less:
Cash and cash equivalents
(1,112)
Net proceeds (cash) from October 12 long-term debt issuance
(259)
Restricted cash
(1,644)
Net debt
35,570
1
GAAP basis which reflects deconsolidation of Oncor. Oncor’s total debt
is ~$6.4 billion, added to EFH Corp.’s debt equals ~$45.0 billion. |
 44
Table 2: Oncor Net Debt Reconciliation
As of September 30, 2012
$ millions
Description
9/30/12
Short-term borrowings
784
Long-term debt due currently
123
Long-term debt, less amounts due currently
5,440
Total debt (GAAP)
6,347
Less unamortized discounts
37
Total debt
6,384
Less:
Cash and cash equivalents
(9)
Restricted cash
(80)
Net debt
6,295 |
 45
Table 3: EFH Corp. Adjusted EBITDA Reconciliation
Year Ended December 31, 2008 -
2011 and Nine Months Ended September 30, 2012
$ millions
1
2
3
4
5
Factor
2008
2009
2010
2011
YTD 12
Net income (loss) attributable to EFH Corp.
(9,838)
344
(2,812)
(1,913)
(1,408)
Income tax expense (benefit)
(471)
367
389
(1,134)
(879)
Interest expense and related charges
4,935
2,912
3,554
4,294
2,746
Depreciation and amortization
1,610
1,754
1,407
1,499
1,015
EBITDA
(3,764)
5,377
2,538
2,746
1,474
Oncor EBITDA
(496)
(1,354)
-
-
-
Oncor
distributions/dividends
(2008
includes
$1.253
billion
sale
of
Oncor
equity)
1,582
216
169
116
100
Interest income
(27)
(45)
(10)
(2)
(2)
Amortization of nuclear fuel
76
101
140
142
124
Purchase accounting adjustments
460
340
210
204
74
Impairment of goodwill
8,000
90
4,100
-
-
Impairment and write-down of other assets
1,221
42
15
433
9
Debt extinguishment gains
-
(87)
(1,814)
(51)
-
Net income (loss) attributable to noncontrolling interests
(160)
64
-
-
-
Equity in earnings of unconsolidated subsidiary
-
-
(277)
(286)
(249)
Unrealized net (gain) loss resulting from hedging transactions
(2,329)
(1,225)
(1,221)
(58)
1,290
Amortization of “day one”
net loss on Sandow power purchase agreement
-
(10)
(22)
-
-
Noncash compensation expense
27
11
18
13
11
Severance expense
3
10
4
7
1
Transition and business optimization costs
45
22
4
39
31
Transaction and merger expenses
64
81
48
37
29
Restructuring and other
43
1
(116)
73
7
Expenses incurred to upgrade or expand a generation station
100
100
100
100
69
EFH Corp. Adjusted EBITDA per Incurrence Covenant
4,845
3,734
3,886
3,513
2,968
Add Oncor Adjusted EBITDA (reduced by Oncor distributions/dividends above)
(267)
1,123
1,354
1,523
1,254
EFH Corp. Adjusted EBITDA per Restricted Payments Covenant
4,578
4,857
5,240
5,036
4,222
3
4
5
2
1
2008 includes litigation accrual, charge related to a counterparty bankruptcy and losses on sale of
receivables, net of insurance settlement proceeds. 2009 includes reversal of certain liabilities accrued in purchase
accounting, partially offset by restructuring and nonrecurring activities and losses on sale of
receivables. 2010 includes a gain on termination of a long-term power sales contract. 2011 includes settlement of amounts
due from counterparty bankruptcy, fees related to the amendment and extension of the TCEH Senior
Secured Facilities and reversal of certain liabilities accrued in purchase accounting. See Form 10-Ks for more detail
Includes amortization of the intangible net asset value of retail and wholesale power sales agreements,
environmental credits, coal purchase contracts, nuclear fuel contracts and power purchase agreements
and the stepped-up value of nuclear fuel. Also includes certain credits and gains on asset
sales not recognized in net income due to purchase accounting
2008 and 2011 include impairment of emission allowances. 2008 also includes impairment of trade name
intangible assets, land, and the natural gas-fueled generation fleet and charges related to cancelled
development of coal-fueled generation facilities
Includes professional fees and other costs related to retail billing and customer care systems,
generation plant reliability and supply chain efficiency initiatives as well as incentive compensation expenses
Includes costs related to the Merger, abandoned strategic transactions, certain growth initiatives and
Oncor’s sale of noncontrolling interests, outsourcing transition costs and Sponsor Group management fee |
 46
Table 4: TCEH Adjusted EBITDA Reconciliation
Nine Months Ended September 30, 2012
$ millions
1
Includes amortization of the intangible net asset value of retail and wholesale
power sales agreements, environmental credits, coal purchase contracts, nuclear fuel contracts and power
purchase agreements and the stepped-up value of nuclear fuel. Also
includes certain credits and gains on asset sales not recognized in net income due to purchase accounting
2
Represents
amounts
recorded
under
stock-based
compensation
accounting
standards
and
excludes
capitalized
amounts
3
Includes
incentive
compensation
expenses
as
well
as
professional
fees
and
other
costs
related
to
generation
plant
reliability
and
supply
chain
efficiency
initiatives
4
Primarily represents Sponsor Group management fees
5
Reflects noncapital outage costs
Factor
YTD 12
Net loss
(1,252)
Income tax benefit
(670)
Interest expense and related charges
2,200
Depreciation and amortization
992
EBITDA
1,270
Adjustments to EBITDA (pre-tax):
Interest income
(36)
Amortization of nuclear fuel
124
Purchase
accounting
adjustments
54
Impairment of assets and inventory write down
1
Unrealized net (gain) loss resulting from hedging transactions
1,290
Net loss attributable to noncontrolling interests
1
EBITDA amount attributable to consolidated unrestricted subsidiaries
(6)
Corp. depreciation, interest and income tax expense included in SG&A
13
Noncash
compensation
expense
8
Severance expense
1
Transition
and
business
optimization
costs
30
Transaction and merger expenses
4
29
Restructuring and other
6
Expenses incurred to upgrade or expand a generation station
5
69
TCEH Adjusted EBITDA per Incurrence Covenant
2,854
Expenses related to unplanned generation station outages
64
TCEH Adjusted EBITDA per Maintenance Covenant
2,918
3
2
1 |
 47
EFH Corp. Investor Relations Contacts
Molly Sorg
Director, Investor Relations
214-812-8868
Molly.Sorg@energyfutureholdings.com
Blake Holcomb
Investor Relations
214-812-8005
Blake.Holcomb@energyfutureholdings.com
|