Attached files
| file | filename |
|---|---|
| 8-K - CURRENT REPORT - Wendy's Co | d433700d8k.htm |
 Third Quarter
2012 Earnings
Conference Call
November 8, 2012
©2012 Oldemark LLC
1
Exhibit 99.1 |
 JOHN
BARKER
CHIEF COMMUNICATIONS OFFICER
2 |
 The Wendy’s Company
Today’s Agenda
The Wendy’s Company
Opening Comments
Emil Brolick
Financial Update
Steve Hare
CEO Overview
Emil Brolick
Q&A
3 |
 Forward-Looking Statements and
Non-GAAP Financial Measures
4
The Wendy’s Company
This presentation, and certain information that management may discuss in connection
with this presentation, contains certain statements that are not
historical facts, including information concerning possible or assumed future
results of our operations. Those statements constitute “forward-looking
statements” within the meaning of the Private Securities Litigation Reform
Act of 1995 (The “Reform Act”). For all forward-looking statements, we claim the protection of the safe harbor for forward-looking
statements contained in the Reform Act.
Many important factors could affect our future results and could cause those results to
differ materially from those expressed in or implied by our forward-looking
statements. Such factors, all of which are difficult or impossible to predict accurately, and many of which are beyond our
control, include but are not limited to those identified under the caption
“Forward-Looking Statements” in our news release issued on
November 8, 2012 and in the “Special Note Regarding Forward-Looking Statements
and Projections” and “Risk Factors” sections of our most recent
Form 10-K / Form 10-Qs. In addition, this presentation and certain
information management may discuss in connection with this presentation reference non-GAAP financial
measures, such as adjusted earnings before interest, taxes, depreciation and
amortization, or adjusted EBITDA, and adjusted earnings per share. Adjusted
EBITDA and adjusted earnings per share exclude certain expenses, net of certain benefits. Reconciliations of non-GAAP financial
measures to the most directly comparable GAAP financial measures are provided in the
Appendix to this presentation, and are included in our news release issued on
November 8, 2012 and posted on www.aboutwendys.com. |
 EMIL
BROLICK
PRESIDENT & CHIEF EXECUTIVE OFFICER
5 |
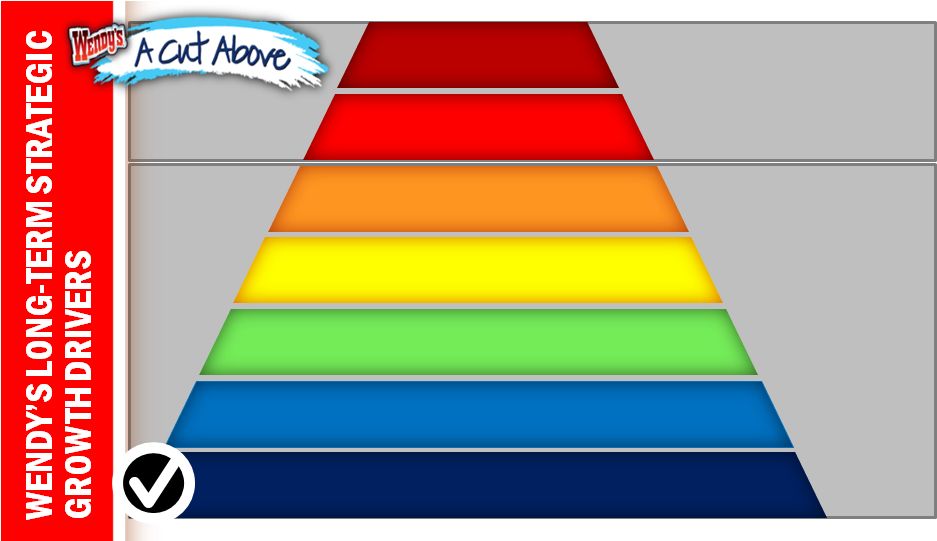
 The Wendy’s Company
6
Core Organic
Growth
Strategies
Shareholder
Value-Enhancing
Initiatives
North America Same-Store Sales Growth
North America Same-Store Sales Growth
Image / Experience Activation
Image / Experience Activation
New Restaurant Development
Restaurant Utilization
& Daypart Expansion
Global Growth
Global Growth
Financial Management
Financial Management
Restaurant Ownership
Restaurant Ownership
Optimization
Optimization |
 The Wendy’s Company
Recipe to Win Working!
Reaffirming 2012 Outlook …
Solid Growth Expected in 2013 |
 The Wendy’s Company
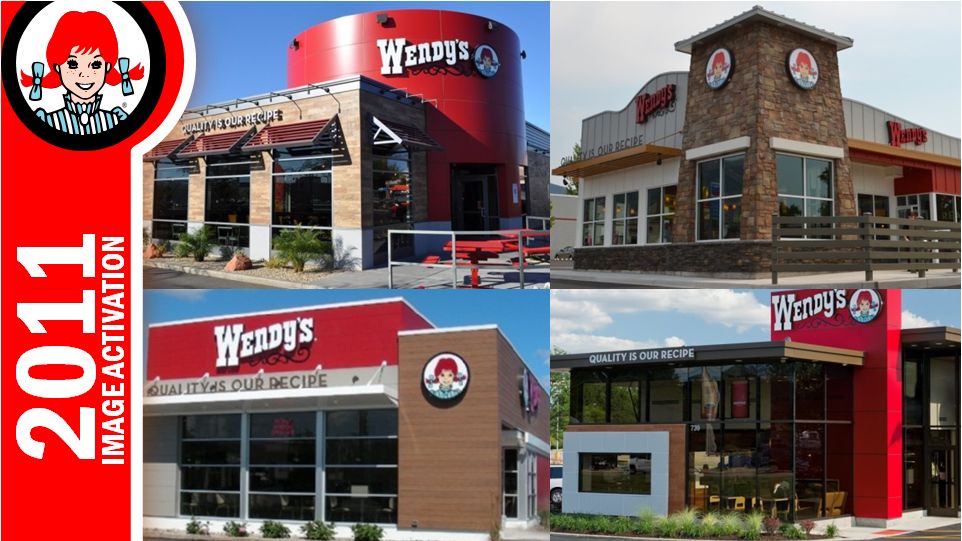
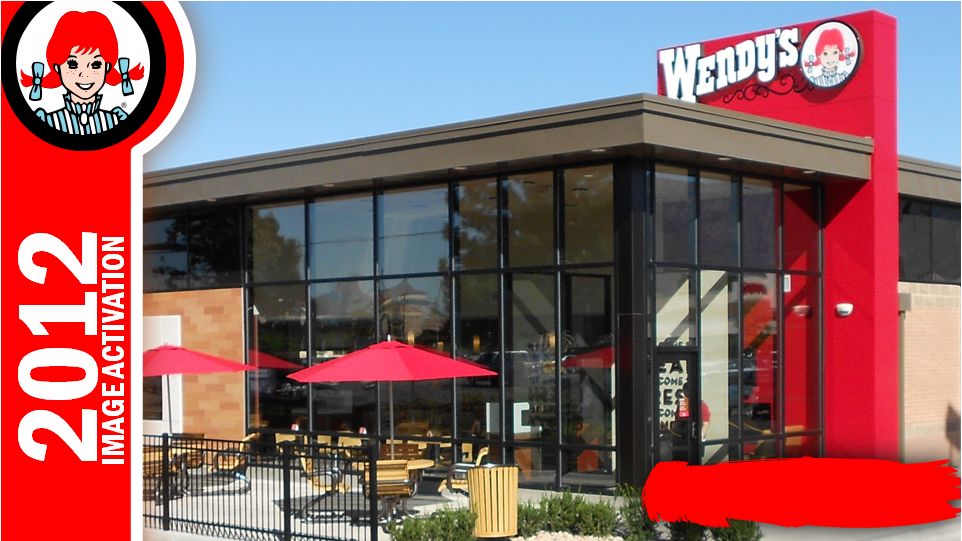
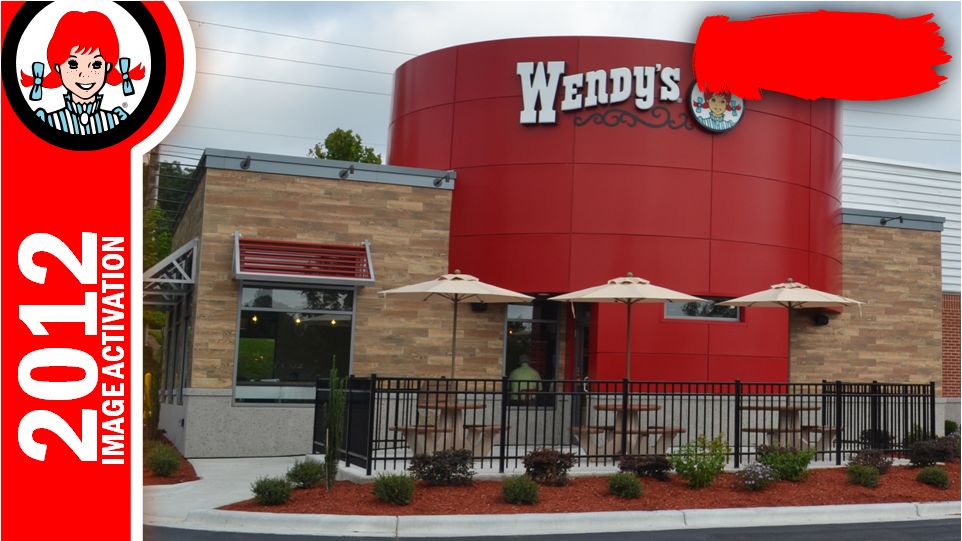
Making Significant Progress
on Image Activation |
 The Wendy’s Company
Sixth Consecutive
Quarter of Positive SSS |
 The Wendy’s Company
RECIPE TO WIN
PEOPLE
PEOPLE
5-Star Athletes
5-Star Athletes
PRICE
PRICE
New QSR Quality at QSR Price
New QSR Quality at QSR Price
PRODUCT
PRODUCT
Play a different game. Superior
Play a different game. Superior
perceived quality, competitive price.
perceived quality, competitive price.
PROMOTION
PROMOTION
Strategically driven, tactically brilliant
Strategically driven, tactically brilliant
PLACE
PLACE
The complete brand experience
The complete brand experience
PERFORMANCE
PERFORMANCE
Keeping the brand promise
Keeping the brand promise
The Wendy’s Company
10 |
 The Wendy’s Company
Long-Term Adjusted EBITDA and
Adjusted EPS Growth:
High Single-Digit to Low Double-Digit Range
|
 The Wendy’s Company
Free Cash Flow &
Flexibility of Our Balance Sheet |
 The Wendy’s Company
100% increase in dividend
$100 million share
repurchase program |
 STEVE
HARE
CHIEF FINANCIAL OFFICER
14 |
 Q3 2012 Financial Highlights
Company
Restaurant Margin
Q3 2012 13.9%
Q3 2011 13.7%
+20 bps
15
North America
Same-Store Sales
Company-Operated +2.7%
Franchise
+2.9%
Systemwide
+2.8% August –
September
July –
August |
 Q3 2012 Financial Summary
Q3 2012
Q3 2011
Better/
(Worse)
Sales
558.3
$
534.5
$
23.8
$
Franchise revenues
78.0
76.9
1.1
Total revenues
636.3
$
611.4
$
24.9
$
Adjusted EBITDA from continuing operations*
84.5
$
87.0
$
(2.5)
$
(Unaudited)
($ in millions)
16
*See reconciliation of Adjusted EBITDA from continuing operations in the
appendix. |
 Impact of Image Activation on Q3
and Q4 2012 Adjusted EBITDA
Q3
$4 million negative impact from
temporary closure of restaurants and
other costs related to
Image Activation
Q4
Expect positive impact from 47
reimaged restaurants that
re-opened late in Q3 and early in Q4
17 |
 Income from Continuing Operations and Special Items
18
(Unaudited)
($ in thousands except per share amounts)
After tax
Per share (b)
After tax
Per share
Adjusted income and adjusted earnings per share from continuing operations (a)
11,300
$
0.03
$
17,563
$
0.05
$
(Less):
Loss on early extinguishment of debt
(30,926)
(0.08)
-
-
Facilities relocation and other transition costs
(6,977)
(0.02)
-
-
Transaction related costs
(89)
(0.00)
(15,019)
(0.04)
Total adjustments
(37,992)
(0.10)
(15,019)
(0.04)
(Loss) income and earnings per share from continuing operations
(26,692)
$
(0.07)
$
2,544
$
0.01
$
Third Quarter
2012
2011
(a)
See reconciliation of Adjusted Income and Adjusted Earnings per Share from
Continuing Operations in the appendix. (b)
Adjusted earnings per share amounts for the third quarter include the dilutive
effect of stock options and restricted shares. The effect of stock options and restricted
shares was excluded from the reported number of shares used to calculate basic
and diluted loss per share, as the impact would have been anti-dilutive. Included in
the
appendix
is
a
reconciliation
of
the
number
of
shares
used
to
calculate
adjusted
earnings
per
share
amounts. |
 Financial Management
Global Growth
Global Growth
Restaurant Utilization
& Daypart Expansion
Restaurant Ownership
Restaurant Ownership
Optimization
Optimization
New Restaurant Development
Image / Experience Activation
Image / Experience Activation
North America Same-Store Sales Growth
North America Same-Store Sales Growth
19
Core Organic
Growth
Strategies
Shareholder
Value-Enhancing
Initiatives
The Wendy’s Company |
  Free Cash Flow Highlights & Projections
20
(Unaudited)
($ in millions)
3 YearE
2011
2012E
2013E
(Cumulative)
Adjusted EBITDA*
331
$
328
$
355
$
1,014
$
Cash Interest & Taxes
(126)
(121)
(86)
(333)
Operating Cash Flow
205
207
269
681
Base Capital Spending
(96)
(125)
(100)
(321)
Free Cash Flow
109
$
82
$
169
$
360
$
*See reconciliation of Adjusted EBITDA from continuing operations in the
appendix; represents midpoint of current outlook. Because certain income statement items needed to calculate income from
continuing operations vary from quarter to quarter, the Company is unable to
provide projections of income from continuing operations or a reconciliation of projected Adjusted EBITDA from continuing
operations to projected income from continuing operations. |
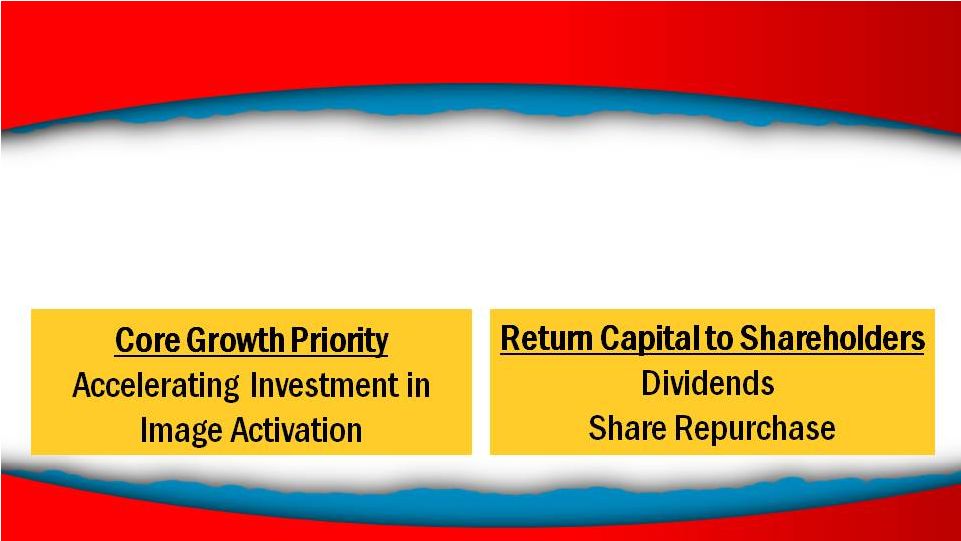
 Capital Allocation to Support Organic
Growth and Returns to Stockholders
Strong cash position
$454 million of cash
Consistent free cash flow generation in excess of base capital
expenditures Expected high return on investment from Image
Activation Flexibility to fund both growth and returns to
stockholders Up to $500 million of capital expenditures committed
to Image Activation through 2015
Increased dividend in Q4 and stock repurchases authorized
21 |
 Initiatives to Increase
Stockholder Returns
100 percent increase in quarterly dividend
Q4 increase from $0.02 to $0.04 per share
Payable on Dec. 17 to stockholders of record on Dec. 3
$100 million share repurchase program
22 |
 Selected Balance Sheet Highlights
($ in Millions)
Cash
454
$
Senior Debt
1,424
$
Capital Leases and Other Debt
33
Total Debt
1,457
$
TTM Adjusted EBITDA*
318
$
Total Debt / TTM Adjusted EBITDA*
4.6x
Net Debt / TTM Adjusted EBITDA*
3.2x
September 30, 2012
23
*See reconciliation of Adjusted EBITDA from continuing operations in the
appendix. |
 2012, 2013 and Long-Term Earnings Outlook
2012
24
Reaffirming
Adjusted EBITDA
from continuing
operations
in a range of
$320 to $335
million
Adjusted EBITDA
from continuing
operations in a
range of
$350 to $360
million
Average annual
Adjusted EBITDA
and Adjusted EPS
growth rates in
high-single-digit
to low-double-
digit range
2013
Long-Term |
 EMIL
BROLICK
25 |
 Financial Management
Global Growth
Global Growth
Restaurant Utilization
& Daypart Expansion
Restaurant Ownership
Restaurant Ownership
Optimization
Optimization
New Restaurant Development
Image / Experience Activation
Image / Experience Activation
North America Same-Store Sales Growth
North America Same-Store Sales Growth
26
Core Organic
Growth
Strategies
Shareholder
Value-Enhancing
Initiatives
The Wendy’s Company |
 27
Delivers “A Cut Above”
brand positioning
•
Creates a great work environment for our restaurant teams
•
Distinguishes Wendy’s from other traditional QSRs
•
Customers tell us they love the restaurants
|
 The Wendy’s Company
28
10 Reimages
Average Annualized
Sales +25% |
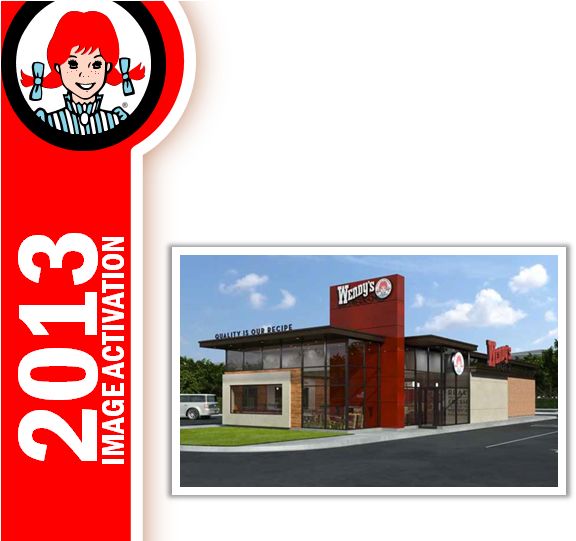
 The Wendy’s Company
Salt Lake City, UT |
 30
The Wendy’s Company
Raleigh, NC |
 IMAGE
ACTIVATION
BRAND
IMAGE
PEOPLE &
SERVICE
CUSTOMER
EXPERIENCE
FOOD
EXPERIENCE
31 |
 Wendy's Brand Transformation
32
Restaurant Signage,
Merchandising,
& Uniforms
Advertising, PR,
Websites, Social Media
& Packaging |
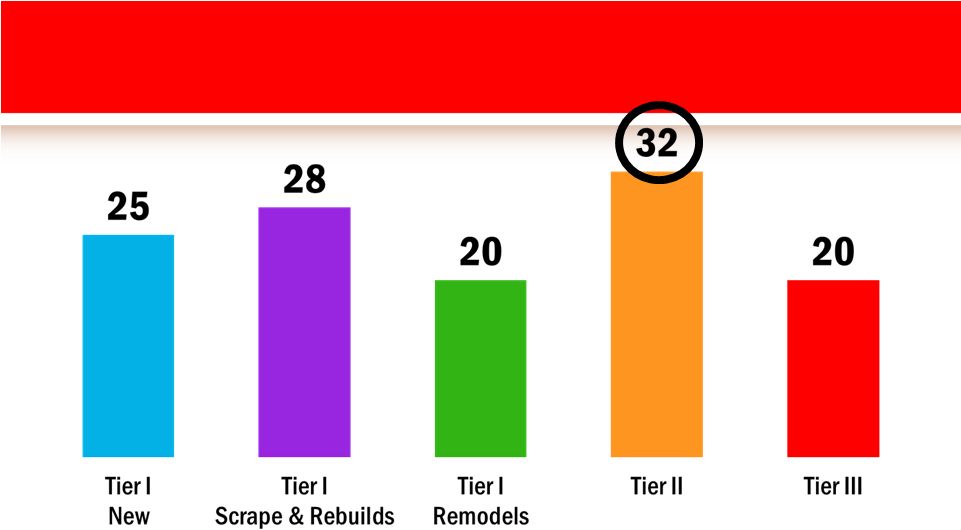
 TIER I
I
TIER III
2013: Tiered Design Strategy to Optimize Returns
The Wendy’s Company
Targeted
Investment*
$650 to $750K
$510 to 550K
$375K
Sales Lift
> 25%
20%
7.5%
*Estimates based on Company’s current outlook; excludes maintenance cap ex
and other costs 33 |
 The Wendy’s Company
34
Company
100
Reimages
All Tiers
25
New Restaurants
Franchise
Expect
100
Reimages
Majority Tier I
Introduce Tier II and
Tier III Designs
50
New Restaurants
Estimates based on Company’s current outlook
|
 Company Image Activation Plan For 2013
100 Reimages and 25 New Restaurants
35 |
 The Wendy’s Company
36
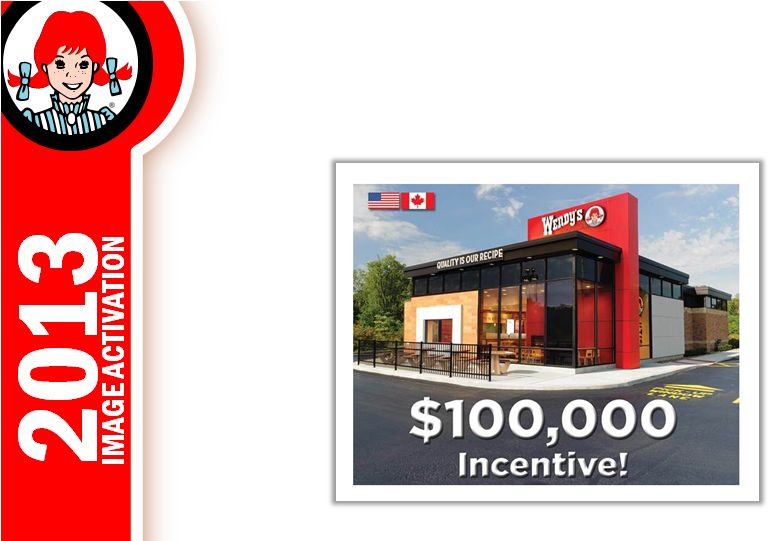
Franchise Interest is Growing
Offering incentive for Tier 1 |
 The Wendy’s Company
37
Image Activation Expansion
Estimates based on Company’s current outlook
2011
2015
750
50%
of company restaurants
Image Activated
by end of 2015
50%
of company restaurants
Image Activated
by end of 2015
approx.
restaurants |
 The Wendy’s Company
38
System Optimization to Yield Multiple
Benefits; Strengthen Overall System
Strong
Franchise
Base
New
Franchisees
Optimal
System
In-market concentration
Restaurant performance
Optimal franchise mix
to maximize value
High-quality operators
Strong, more concentrated
franchise platforms
Ability to image activate
Existing
Company-
Owned
Footprint
The Wendy’s Company |
 Financial Management
Global Growth
Restaurant Utilization
& Daypart Expansion
Restaurant Ownership
Optimization
New Restaurant Development
Image / Experience Activation
North America Same-Store Sales Growth
Core Organic
Growth
Strategies
Shareholder
Value-Enhancing
Initiatives
39
The Wendy’s Company |
 SOMETHING
TO BUY
SOMETHING
TO BUY INTO
40
MARKETING: DUAL CAMPAIGN LEGS |
 Consumers Remember It!
41
53
49
42
35
AD AWARENESS
+12%
Source: Millward Brown/Brand Health Tracking Study (August 2012 vs. April
2012) QSR HAMBURGER
COMPETITOR A
QSR HAMBURGER
COMPETITOR B
QSR SANDWICH
COMPETITOR A
The Wendy’s Company |
 Consumers Respond To It!
42
BRAND CONSIDERATION
+9%
Source: Millward Brown/Brand Health Tracking Study (August 2012 vs. April
2012) QSR HAMBURGER
COMPETITOR A
QSR HAMBURGER
COMPETITOR B
QSR SANDWICH
COMPETITOR A
The Wendy’s Company |
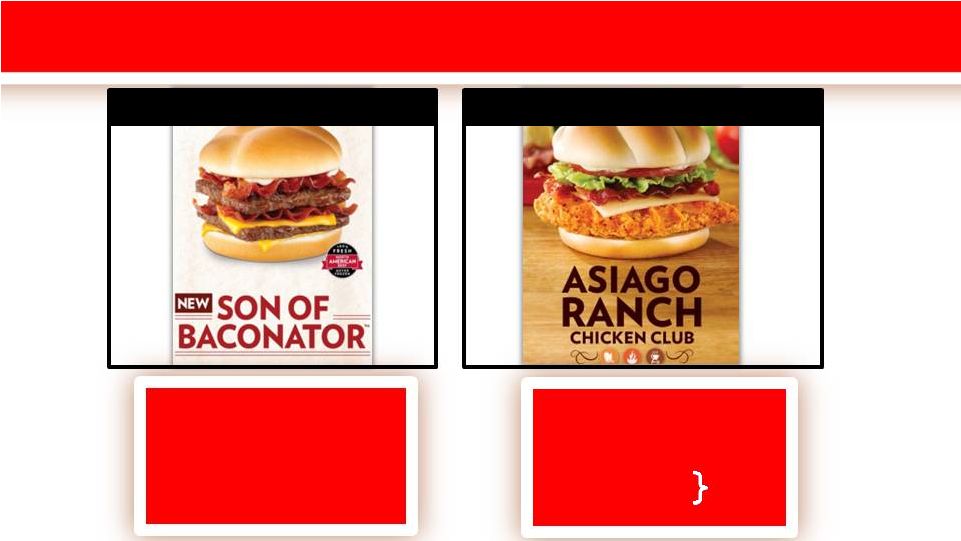
 Successful Premium Product Launches
43
Asiago Ranch Chicken Club |
 Growing Share in Premium Segments
44
HAMBURGER
CHICKEN
SALADS
JJA’11
SON’11
DJF’12
MAM’12
JJA’12
JJA’12
Source: The NPD Group / CREST
®
NEW QSR
COMPETITOR Y
QSR HAMBURGER
COMPETITOR X |
 Recent Awards and Recognition
ZAGAT: #1 Overall Mega Chain
ACSI: #1 in Hamburger Category
You Gov Social Media: #2 Buzz Index
QSR Magazine: Fastest Drive-Thru
Food Network: Chef’s Choice
Trademarks are the property of their respective owners.
45 |
 JOHN
BARKER
CHIEF COMMUNICATIONS OFFICER
46 |
 The Wendy’s Company
2013 Events
January 16-17:
ICR Conference in Miami, FL
February 28:
Q4 and 2012 Earnings Release
Upcoming Investor Calendar
47 |
 Q&A
48 |
 49
The Wendy’s Company |
 Appendix
50 |
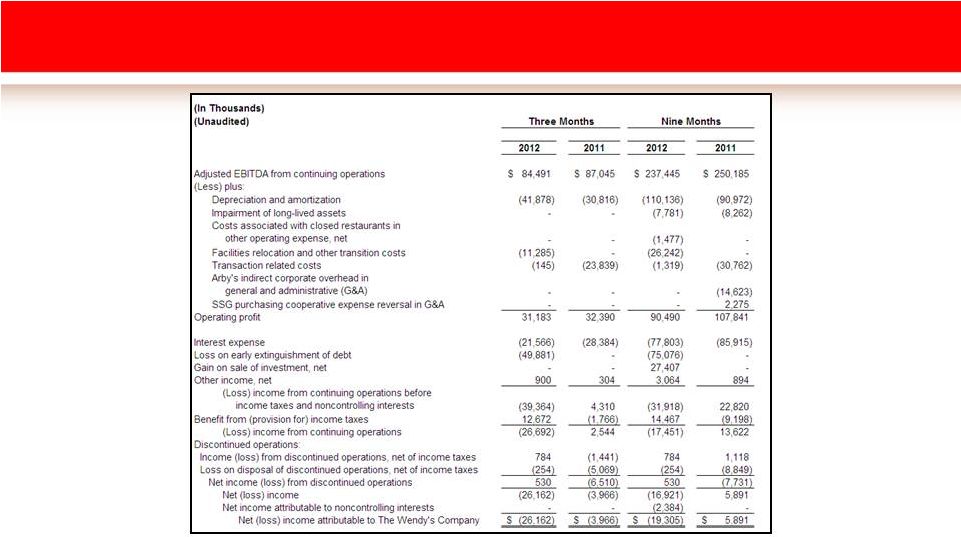 Reconciliation
of
Adjusted
EBITDA
from
Continuing
Operations
to Net (Loss) Income Attributable to The Wendy’s Company
51 |
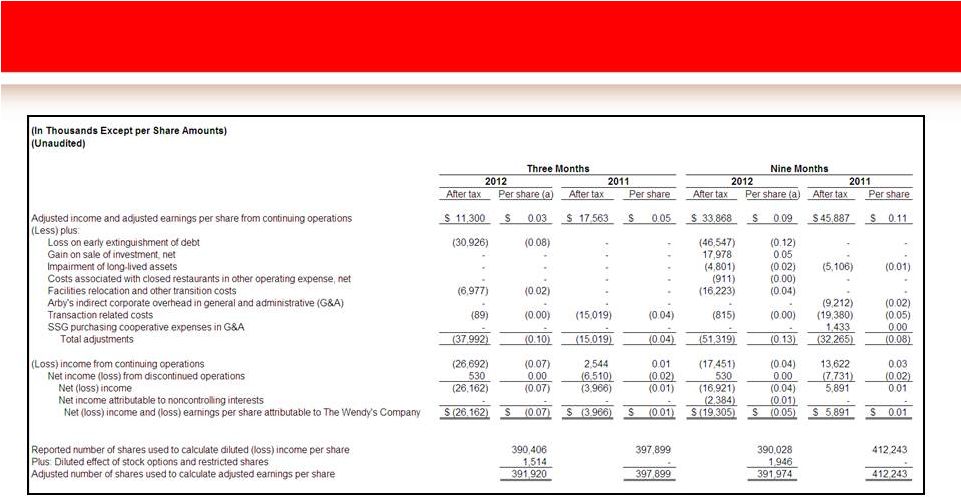 Reconciliation of Adjusted Income and Adjusted Earnings per Share from
Continuing Operations to Net (Loss) Income and Earnings per Share
Attributable to The Wendy’s Company
52
(a)
Adjusted earnings per share amounts for the three and nine months ended
September 30, 2012, include the dilutive effect of stock options and
restricted shares. The effect of stock options and restricted
shares was excluded from the reported number of shares used to calculate basic and diluted loss per share, as
the impact would have been anti-dilutive. Included above is a
reconciliation of the number of shares used to calculate adjusted earnings per share amounts. |