Attached files
| file | filename |
|---|---|
| EX-99.1 - PRESS RELEASE - Manitex International, Inc. | d434995dex991.htm |
| 8-K - FORM 8-K - Manitex International, Inc. | d434995d8k.htm |
 “Focused
manufacturer of
engineered lifting
equipment”
Exhibit 99.2
Manitex International, Inc.
Conference Call
Third Quarter 2012
November 8th, 2012 |
 2
Forward Looking Statements &
Non GAAP Measures
“Focused
manufacturer of
engineered lifting
equipment”
Safe Harbor Statement under the U.S. Private Securities Litigation Reform Act of
1995: This presentation contains statements that are forward-looking in
nature which express the beliefs and expectations of management including
statements regarding the Company’s expected results of operations or liquidity;
statements concerning projections, predictions, expectations, estimates or forecasts
as to our business, financial and operational results and future economic
performance; and statements of management’s goals and objectives and
other similar expressions concerning matters that are not historical facts. In some
cases, you can identify forward-looking statements by terminology such as
“anticipate,” “estimate,”
“plan,”
“project,”
“continuing,”
“ongoing,”
“expect,”
“we believe,”
“we intend,”
“may,”
“will,”
“should,”
“could,”
and similar expressions. Such statements are based on current plans, estimates and
expectations and involve a number of known and unknown risks, uncertainties
and other factors that could cause the Company's future results, performance
or achievements to differ significantly from the results, performance or
achievements expressed or implied by such forward-looking statements. These factors and additional
information are discussed in the Company's filings with the Securities and Exchange
Commission and statements in this presentation should be evaluated in light of
these important factors. Although we believe that these statements are based
upon reasonable assumptions, we cannot guarantee future results.
Forward-looking statements speak only as of the date on which they are made, and
the Company undertakes no obligation to update publicly or revise any
forward-looking statement, whether as a result of new information, future
developments or otherwise. Non-GAAP Measures: Manitex International from
time to time refers to various non-GAAP (generally
accepted accounting principles) financial measures in this presentation.
Manitex believes that this information is useful to understanding its
operating results without the impact of special items. See Manitex’s
Third Quarter 2012 Earnings Release on the Investor Relations section of our website
www.manitexinternational.com
for a description and/or reconciliation of these measures.
|
 3
“Focused
manufacturer of
engineered lifting
equipment”
Overview
•
Second consecutive record quarter delivered from benefits of increased
production activities and strong backlog
–
Sales of $53.4 million (44% increase), 2% sequentially
–
Net income of $2.5 million (145% increase)
–
EPS $0.21 (133% increase)
–
EBITDA $5.3 million (70% increase), 10% of sales
•
Our markets remain steady, notwithstanding widespread uncertainty, and we
remain optimistic for growth
–
N.A. energy sector continuing to drive demand for key products, especially
specialized boom trucks and trailers
–
9/30 backlog at $126 million
–
2012 v 2011 ytd investment in R&D increase over 70%.
Continuing to launch new
product to drive future growth
•
On pace to deliver solid increase in sales and profits compared to 2011
–
2012 year to date revenue, net income and EBITDA already exceed 2011 full
year. –
Expectations for full year revenues in excess of $200m, EBITDA growth of
65% |
 4
“Focused
manufacturer of
engineered lifting
equipment”
Q3 2012 Business Update
•Market conditions consistent with prior quarter
•Significant degree of uncertainty still exists in N. America, influencing
buying decisions •N. American general construction / housing steady,
but still relatively subdued. Energy still active and positive
outlook •European
markets
continue
to
be
adversely
impacted
from
economic
conditions
and
lack
of
credit
•Selective international markets and sectors remain a positive
opportunity •Product demand profile remains consistent with recent
quarters i.e. still focused on more specialized, higher tonnage units or
industry specific product (e.g. energy). •9/30/12 Backlog $125.8
million •YOY increase 99%, ytd 2012 increase 50%
•Production increases at several facilities have reduced order book as
anticipated, together with some Q3 seasonality impact on order
intake •Broad based order book although boom trucks continue to be
heavily represented •
Strongest
demand
for
our
Manitex
boom
trucks.
Large
tonnage
unit
shipments
up
over
1
20% compared to Q3-2011
•
Specialized trailer demand continues to strengthen in response to continued
product developments and international demand
•
Product development initiatives continuing: Successful October launch event
for Badger 15 ton pick and carry crane targeted for industrial / energy
sector |
 5
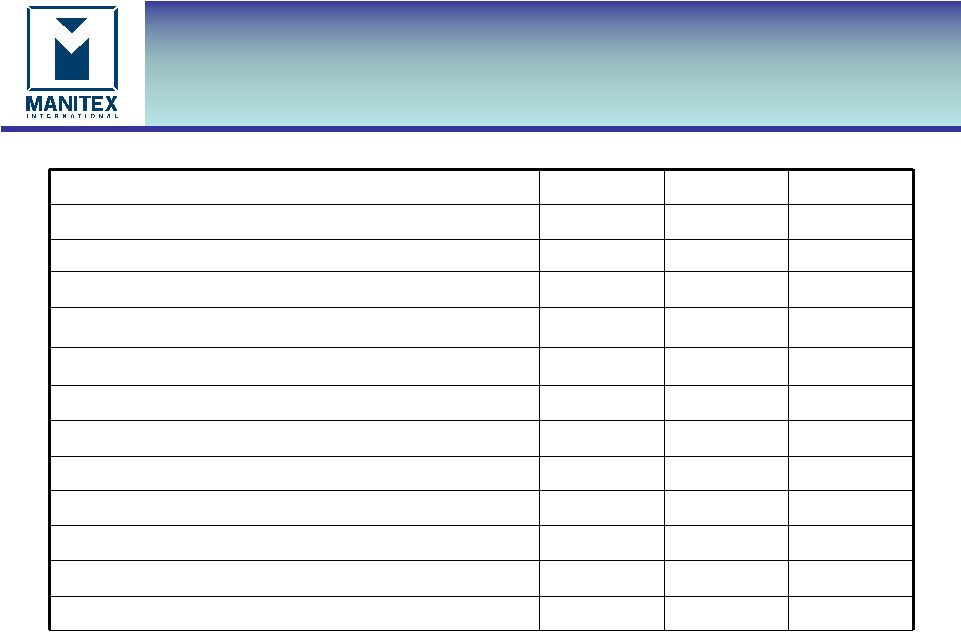
Key Figures -
Quarterly
“Focused
manufacturer of
engineered lifting
equipment”
USD thousands
Q3-2012
Q3-2011
Q2-2012
Net sales
$53,380
$36,942
$52,496
% change in Q3-2012 to prior period
-
44.5%
1.7%
Gross profit
10,810
7,824
10,756
Gross margin %
20.3%
21.2%
20.5%
Operating expenses
6,343
5,591
6,560
Net Income
2,504
1,020
2,308
EBITDA
5,349
3,147
5,116
EBITDA % of Sales
10.0%
8.5%
9.7%
Working Capital
58,795
39,145
52,303
Current Ratio
2.3
2.4
2.2
Backlog
125,785
63,105
149,564
% change in Q3-2012 to prior period
-
99.3%
(15.9%) |
 6
“Focused
manufacturer of
engineered lifting
equipment”
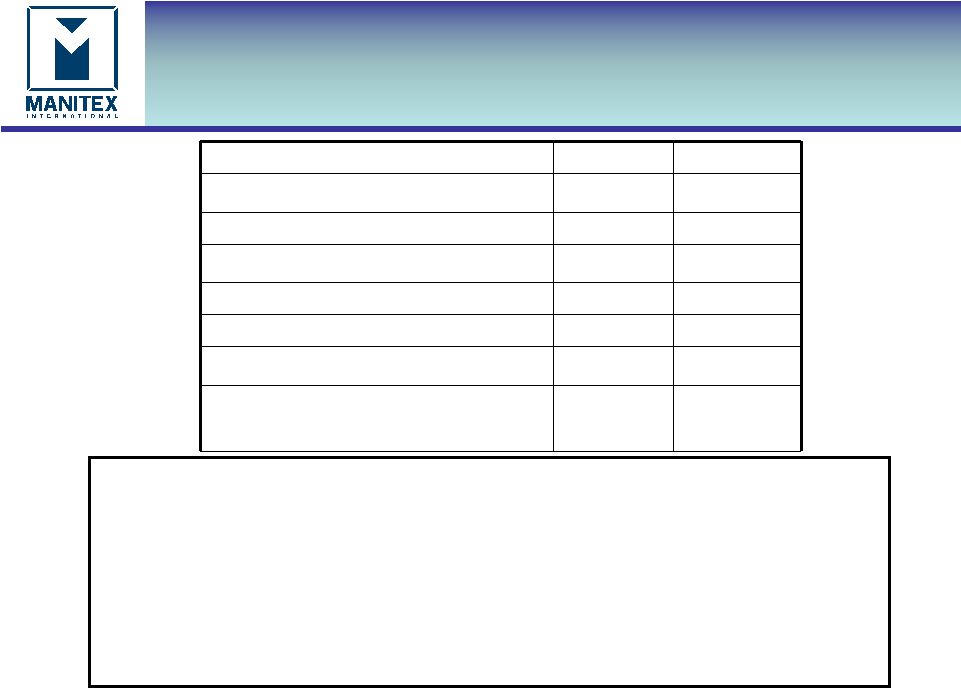
Q3-2012 Operating Performance
$m
$m
Q3-2011 Net income
1.0
Gross profit impact of increased sales of $16.4 million
(Q3-2012
sales less Q3-2011 sales at 2011 gross profit % ).
3.5
Impact
from
lower
margin
(Q3-2012
gross
profit
%
-
Q3-2011
gross
profit
% multiplied by Q3-2012 sales)
(0.5)
Increase in gross profit
3.0
Increase in R&D expense
Increase in SG&A expenses
(0.2)
(0.6)
Interest
0.1
Other income / (expense)
(0.1)
Increase in tax
(0.7)
Q3-2012 Net income
$ 2.5 |
 7
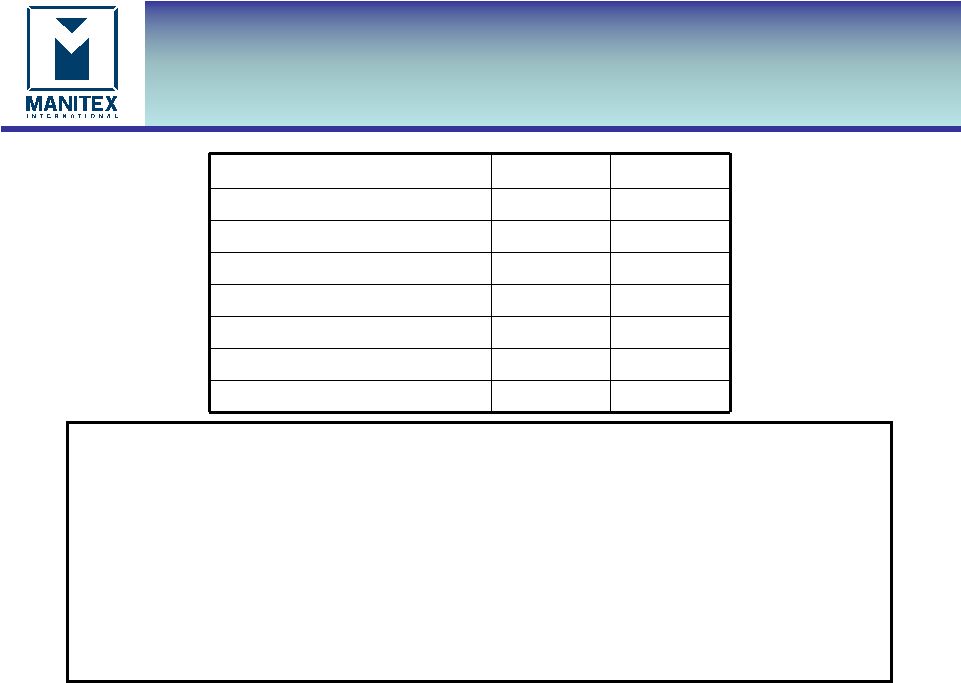
Working Capital
“Focused
manufacturer of
engineered lifting
equipment”
$000
Q3-2012
Q4-2011
Working Capital
$58,795
$41,032
Days sales outstanding (DSO)
57
60
Days payable outstanding (DPO)
65
59
Inventory turns
2.8
2.7
Current ratio
2.3
2.4
Operating working capital
66,556
50,007
Operating working capital % of annualized
LQS
31.2%
34.2%
•Major movements in working capital increase Q3-2012 v Q4 2011 of
$17.8m •Cash ($3.2m), Receivables ($9.2m), inventory ($18.2m) 7
Prepaid ($1.2m), offset by increased accounts payable ($11.3m), and
accrued expenses & other current liabilities ($2.4m)
•Inventory: increases in raw materials ($15.4m) and WIP ($1.5m) to
support growth •Operating working capital % decreased compared to
Q4-2011, as revenue growth was achieved in the quarter as
planned |
 8
“Focused
manufacturer of
engineered lifting
equipment”
$000
Q3-2012
Q4-2011
Total Cash
3,305
71
Total Debt
46,304
42,227
Total Equity
57,208
46,794
Net capitalization
100,207
88,950
Net debt / capitalization
42.9%
47.4%
Quarterly EBITDA
5,349
2,876
Quarterly EBITDA % of sales
10.0%
7.9%
•Increase in cash $3.2m
•Increase in debt at 9/30/2012 from 12/31/2011 of $4.1m, ($0.8m net of
cash) •
Increase
in
lines
of
credit,
equipment
finance
and
Italian
working
capital
finance
$10.3m
•
Repayments of $6.4 m on long term debt, including $3.8m paid early during Q2
& Q3- 2012
•N. American revolver facilities, based on available collateral at 9/30/12 was
$38.5m. •N. American revolver availability at 9/30/12 of $6.0m
•July 2012 raised $4.1m (gross) from equity to repay long term debt in
Q3-2012 Debt & Liquidity
•
Net capitalization is the sum of debt plus equity minus cash
•
Net debt is total debt less cash |
 9
Summary
“Focused
manufacturer of
engineered lifting
equipment”
•
Niche product and market strategy delivering strong growth
performance
•
Significant production expansion to balance with demand, achieved by
solid execution by team and supply chain.
•
EPS and EBITDA growth continues to outpace revenue growth due to
operating leverage
•
Optimistic outlook.
•
Expect
full
year
2012
to
show
a
solid
increase
compared
to
2011
in
revenue, net income and EBITDA
•
Revenues to exceed $200m in 2012
•
Continued growth and improvements expected in 2013
|