Attached files
| file | filename |
|---|---|
| 8-K - 8-K - BROADWIND, INC. | a12-26277_18k.htm |
| EX-99.1 - EX-99.1 - BROADWIND, INC. | a12-26277_1ex99d1.htm |
Exhibit 99.2
|
|
November 7, 2012 Investor Teleconference Q3 2012 Results © 2012 Broadwind Energy, Inc. All Rights Reserved. |
|
|
Industry Data Disclaimer and Forward-Looking Statements Broadwind obtained the industry and market data used throughout this presentation from its own research, internal surveys and studies conducted by third parties, independent industry associations or general publications and other publicly available information. Independent industry publications and surveys generally state that they have obtained information from sources believed to be reliable, but do not guarantee the accuracy and completeness of such information. Forecasts are particularly likely to be inaccurate, especially over long periods of time. We are not aware of any misstatements in the industry data we have presented herein, but estimates involve risks and uncertainties and are subject to change based on various factors beyond Broadwind’s control. This presentation includes “forward-looking statements” within the meaning of the safe harbor provisions of the United States Private Securities Litigation Reform Act of 1995—that is, statements related to future, not past, events. Forward-looking statements are based on current expectations and include any statement that does not directly relate to a current or historical fact. In this context, forward-looking statements often address our expected future business and financial performance, and often contain words such as “anticipate”, “believe”, “intend”, “expect”, “plan”, “will” or other similar words. These forward-looking statements involve certain risks and uncertainties that ultimately may not prove to be accurate and are subject to change based on various factors. Actual results and future events could differ materially from those anticipated in such statements. For further discussion of risks and uncertainties, individuals should refer to Broadwind's filings with the Securities and Exchange Commission. Broadwind undertakes no obligation and does not intend to update these forward-looking statements to reflect events or circumstances occurring after this presentation. You are cautioned not to place undue reliance on these forward-looking statements, which speak only as of the date of this presentation. All forward-looking statements are qualified in their entirety by this cautionary statement. This document contains non-GAAP financial information. Broadwind’s management believes that certain non-GAAP financial measures may provide users of this financial information meaningful comparisons between current results and results in prior operating periods. Management believes that these non-GAAP financial measures can provide additional meaningful reflection of underlying trends of the business because they provide a comparison of historical information that excludes certain infrequently occurring or non-operational items that impact the overall comparability. Non-GAAP financial measures should be viewed in addition to, and not as an alternative for, the Company’s reported results prepared in accordance with GAAP. Please see Broadwind’s earnings release dated as of November 7, 2012 for a reconciliation of certain non-GAAP measures presented in this document. 2 |
|
|
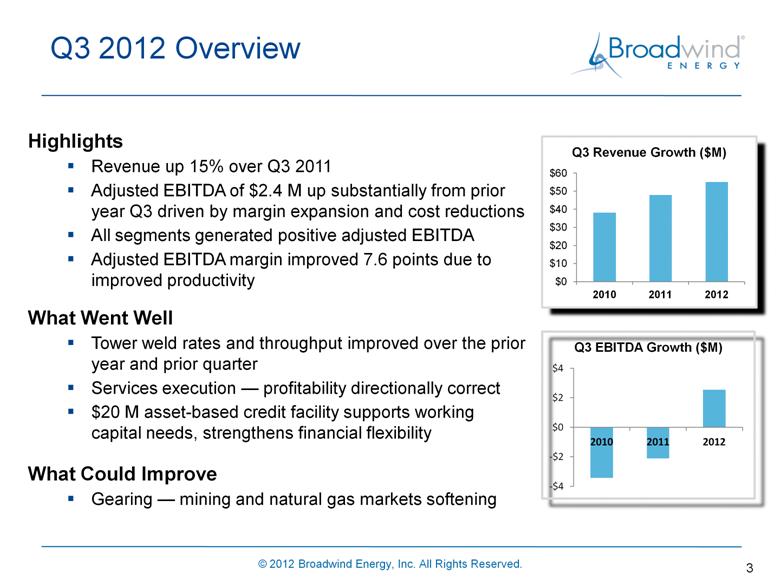
Q3 2012 Overview 3 Highlights Revenue up 15% over Q3 2011 Adjusted EBITDA of $2.4 M up substantially from prior year Q3 driven by margin expansion and cost reductions All segments generated positive adjusted EBITDA Adjusted EBITDA margin improved 7.6 points due to improved productivity What Went Well Tower weld rates and throughput improved over the prior year and prior quarter Services execution — profitability directionally correct $20 M asset-based credit facility supports working capital needs, strengthens financial flexibility What Could Improve Gearing — mining and natural gas markets softening |
|
|
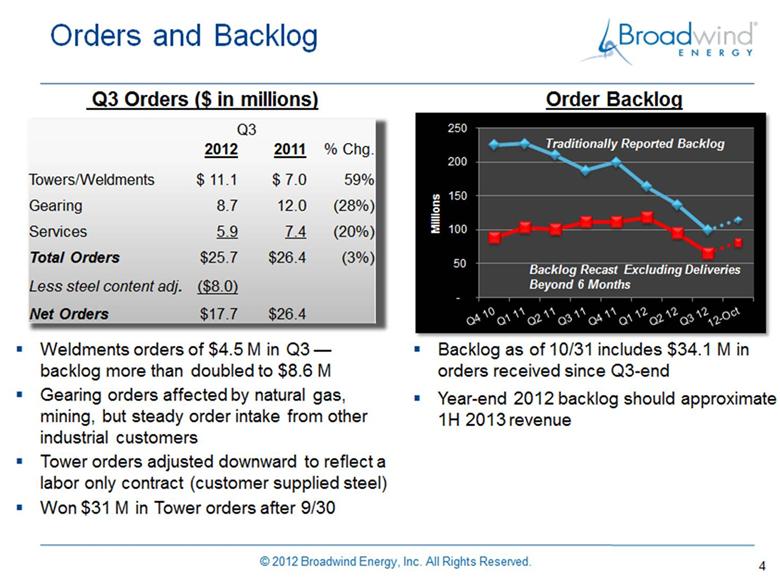
Orders and Backlog Q3 Orders ($ in millions) Q3 2012 2011 % Chg. Towers/Weldments $11.1 $7.0 59% Gearing 8.7 12.0 (28%) Services 5.9 7.4 (20%) Total Orders $25.7 $26.4 (3%) Less steel content adj. ($8.0) Net Orders $17.7 $26.4 Weldments orders of $4.5 M in Q3 — backlog more than doubled to $8.6 M Gearing orders affected by natural gas, mining, but steady order intake from other industrial customers Tower orders adjusted downward to reflect a labor only contract (customer supplied steel) Won $31 M in Tower orders after 9/30 Order Backlog Traditionally Reported Backlog Backlog Recast Excluding Deliveries Beyond 6 Months 250 200 150 100 50 Millions Q4 10 Q1 11 Q2 11 Q3 11 Q4 11 Q1 12 Q2 12 Q3 12 12-Oct Backlog as of 10/31 includes $34.1 M in orders received since Q3-end Year-end 2012 backlog should approximate 1H 2013 revenue |
|
|
Business Transformation Initiatives 5 Reducing manufacturing footprint and cost base Diversifying customer and revenue base into other industries Improve financial flexibility Reduce footprint by ~ 600k Sq. Ft. or 40% Target 50/50 mix between wind and industrial Reduce customer concentrations Company financed with flexible asset-based lending facility Generates savings of ~ $5.0-6.0 M per year Reduces regulatory risk of wind energy More prudent risk management Improved margin mix Financial flexibility supports growth Initiative Target Result |
|
|
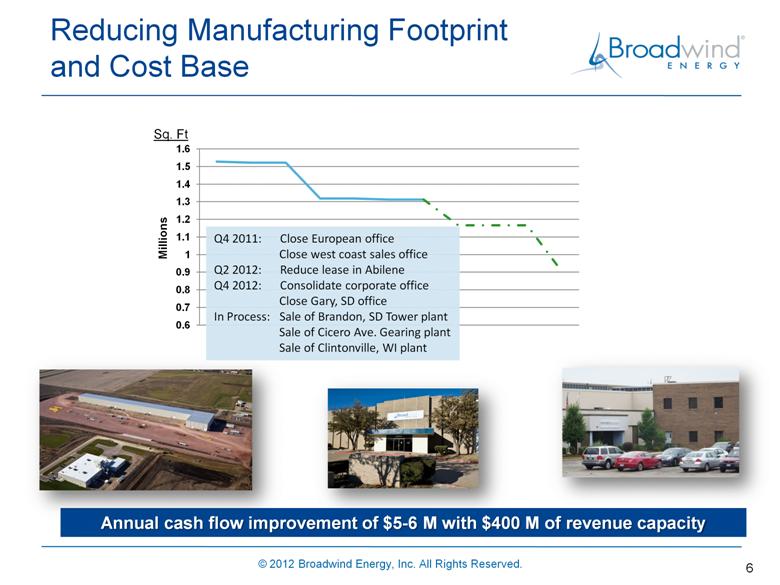
Reducing Manufacturing Footprint and Cost Base Annual cash flow improvement of $5-6 M with $400 M of revenue capacity 6 Q4 2011: Close European office Close west coast sales office Q2 2012: Reduce lease in Abilene Q4 2012: Consolidate corporate office Close Gary, SD office In Process: Sale of Brandon, SD Tower plant Sale of Cicero Ave. Gearing plant Sale of Clintonville, WI plant Sq. Ft |
|
|
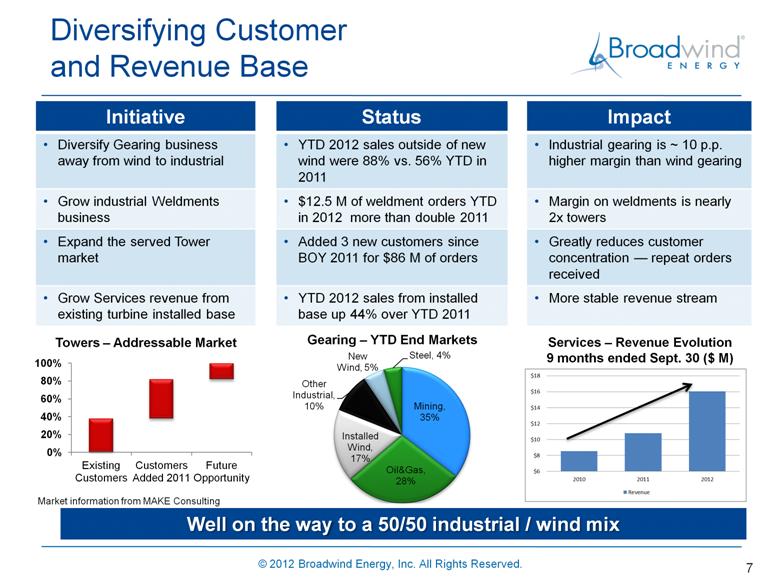
Diversifying Customer and Revenue Base Well on the way to a 50/50 industrial / wind mix Towers – Addressable Market 7 Gearing – YTD End Markets Services – Revenue Evolution 9 months ended Sept. 30 ($ M) Initiative Status Impact Diversify Gearing business away from wind to industrial YTD 2012 sales outside of new wind were 88% vs. 56% YTD in 2011 Industrial gearing is ~ 10 p.p. higher margin than wind gearing Grow industrial Weldments business $12.5 M of weldment orders YTD in 2012 more than double 2011 Margin on weldments is nearly 2x towers Expand the served Tower market Added 3 new customers since BOY 2011 for $86 M of orders Greatly reduces customer concentration — repeat orders received Grow Services revenue from existing turbine installed base YTD 2012 sales from installed base up 44% over YTD 2011 More stable revenue stream Market information from MAKE Consulting |
|
|
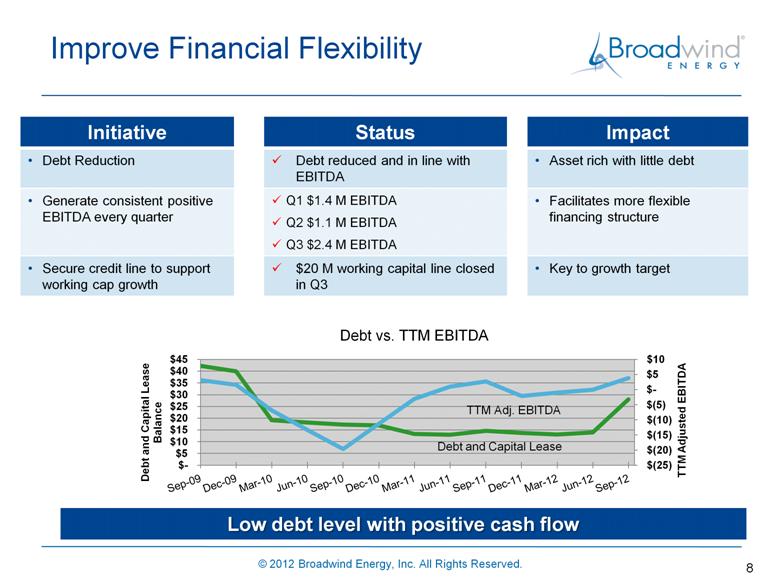
Improve Financial Flexibility Low debt level with positive cash flow 8 Initiative Status Impact Debt Reduction Debt reduced and in line with EBITDA Asset rich with little debt Generate consistent positive EBITDA every quarter Q1 $1.4 M EBITDA Q2 $1.1 M EBITDA Q3 $2.4 M EBITDA Facilitates more flexible financing structure Secure credit line to support working cap growth $20 M working capital line closed in Q3 Key to growth target Debt vs. TTM EBITDA |
|
|
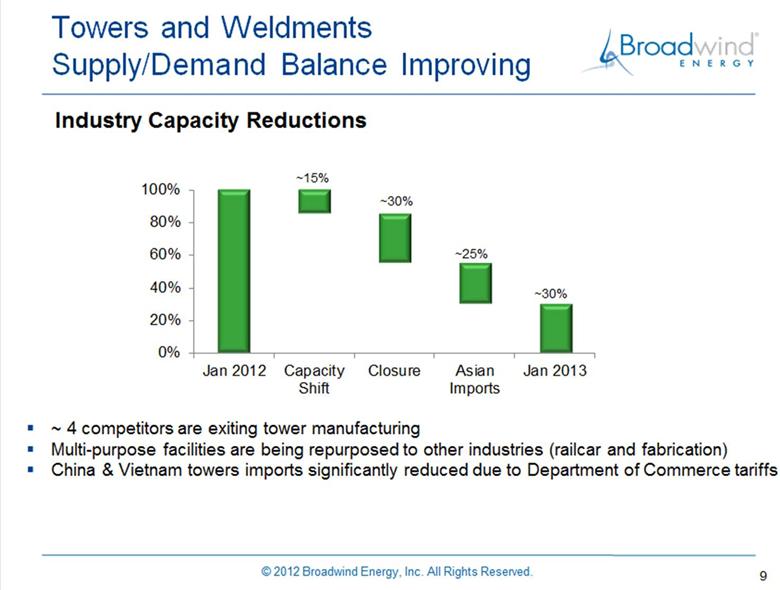
Towers and Weldments Supply/Demand Balance Improving 9 Industry Capacity Reductions ~15% ~30% ~25% ~30% ~ 4 competitors are exiting tower manufacturing Multi-purpose facilities are being repurposed to other industries (railcar and fabrication) China & Vietnam towers imports significantly reduced due to Department of Commerce tariffs |
|
|
Continuous Improvement 10 Review production processes with a focus on reducing variation (weld rates, cycle times, defect rates) Monthly best practice sharing among business units Developing a standard, data-driven approach to analyze quality, throughput and other key operating metrics Leveraging IT platform to better capture and analyze the causes of variation in the businesses Focus on leveraging customer scorecards to help drive greater alignment with key customer evaluation metrics New focus on continuous improvement across the Company |
|
|
Consolidated Financial Results 11 Q3 2012 sales up 15% over Q3 2011 Q3 gross margin improved 3.7 ppt through improved Towers efficiencies and throughput and Services execution Continued stringent operating expense management — down 3.3 ppt in Q3, 4.9 ppt YTD Q3 2012 operating income includes $.6 M restructuring expense Adj. EBITDA of $2.4 M, improved $3.9 M from Q3 2011 Zero effective tax rate — $136 M tax loss carry forward at 12/31/2011 2012 2011 2012 2011 Revenue-$M 55.0 47.9 165.8 130.8 Gross Profit-$M 2.7 0.7 6.6 6.2 -% (ex. Restructuring) 5.4% 1.7% 4.6% 4.8% Operating Expense-$M 6.2 7.0 18.2 20.8 -% (ex. Restructuring) 10.6% 13.9% 10.7% 15.6% Operating Income-$M (3.5) (6.2) (11.6) (14.5) Adj. EBITDA-$M 2.4 (1.5) 4.9 (1.2) EPS Continuing- $ (0.28) (0.60) (0.86) (1.39) Q3 YTD |
|
|
Towers and Weldments Third Quarter 2012 12 Strategic Focus Section volume rose 7% from Q3 2011 — steps to correct productivity and utilization successful Current year production consists of larger, higher value towers compared to prior year Adjusted EBITDA margin doubled to 8.2% Weldments revenue increased dramatically to $2.9 M from Q3 2011 Execute smoothly on multiple tower-type production for new orders Shift capacity to higher-margin weldments to manage wind industry policy risk Broaden customer base Stringent cost management Towers and Weldments Revenue Mix 2012 2011 MW-Wind 176 114 Revenue-$M 37.4 29.7 Op Income-$M 1.7 (0.0) Adj. EBITDA-$M 3.1 1.1 -% 8.2% 3.9% Q3 Q3 12 Q3 11 YTD 12 YTD 11 Full-content towers 92% 95% 94% 81% Fabrication-only towers 0% 2% 0% 16% Weldments 8% 3% 6% 3% |
|
|
Gearing Third Quarter 2012 $1.4 M in shipments deferred to Q4 Revenue entirely outside of new wind Adj. EBITDA margin improved 13 ppt through shift in customer mix and lower operating expenses Plant consolidation progressing — preparing to relocate large machines from Cicero Avenue facility 13 Growth in non-wind markets Diversifying industrial customers Improve capacity utilization — plant consolidation underway Shift from loose gearing to enclosed drives Strategic Focus 2012 2011 Revenue-$M 11.3 12.6 Op Income-$M (2.6) (3.3) Adj. EBITDA-$M 0.9 (0.7) -% 7.6% (5.3%) Q3 |
|
|
Services Third Quarter 2012 Revenue up 4% — growth in drivetrain service center business Adj. EBITDA slightly positive — reflects lower fixed overhead and improved expense management Operating loss also includes $230 K legal settlement 14 Shift focus to non-routine drivetrain and blade maintenance services Develop opportunities in industrial services Develop proprietary product offerings Continue drive toward profitability Strategic Focus Services – EBITDA Evolution ($ thousands) 2012 2011 Revenue-$M 6.9 6.6 Op Income-$M (0.6) (0.4) Adj. EBITDA-$M 0.1 (0.1) -% 1.0% (1.6%) |
|
|
Operating Working Capital 15 September 30 working capital at peak level — tower material payments ahead of customer receipts Trade receivables at 15 quarter peak; will decline in Q4 Trade payables dropped significantly for steel inventory received earlier in the year Year end working capital expected to recover to ~ 12% of TTM sales |
|
|
Debt and Liquidity – $ Thousands 16 $25.1 M net debt balance includes $2.9 M which is either forgivable economic development grants or new markets tax credit financing Expect year-end debt balance to be below $15 M and line of credit (LOC) below $10 M LOC sufficient to support 2013 growth 9/30/2012 6/30/2012 3/31/2012 Lines of credit, notes payable 17,585 926 1,586 Long-term debt 190 1,925 2,262 Liabilities held for sale 4,083 4,333 4,583 Capital leases 3,358 3,875 1,751 Subtotal: debt ex. grants 25,216 11,059 10,182 Grants/tax credits 2,940 2,940 2,940 Total Debt 28,156 13,999 13,122 Cash and related assets 3,051 8,367 11,261 Net Debt 25,105 5,632 1,861 |
|
|
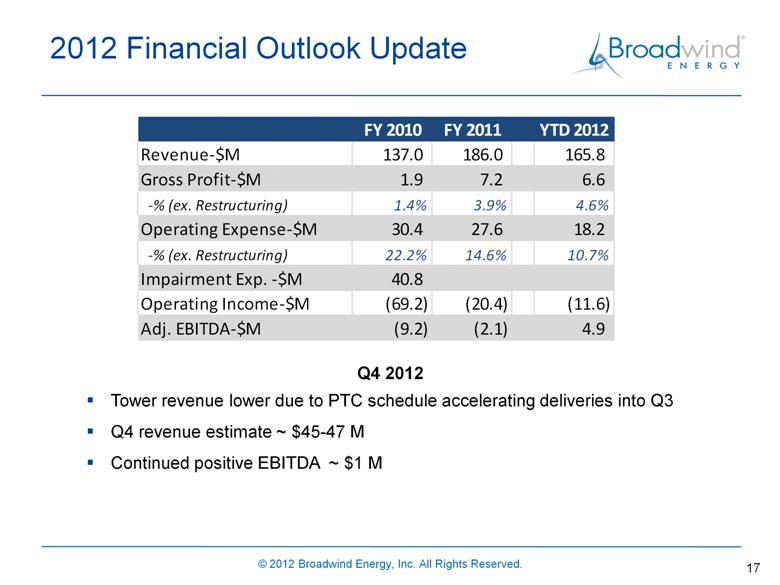
2012 Financial Outlook Update 17 Q4 2012 Tower revenue lower due to PTC schedule accelerating deliveries into Q3 Q4 revenue estimate ~ $45-47 M Continued positive EBITDA ~ $1 M FY 2010 FY 2011 YTD 2012 Revenue-$M 137.0 186.0 165.8 Gross Profit-$M 1.9 7.2 6.6 -% (ex. Restructuring) 1.4% 3.9% 4.6% Operating Expense-$M 30.4 27.6 18.2 -% (ex. Restructuring) 22.2% 14.6% 10.7% Impairment Exp. -$M 40.8 Operating Income-$M (69.2) (20.4) (11.6) Adj. EBITDA-$M (9.2) (2.1) 4.9 |
|
|
18 Broadwind Energy is committed to helping customers maximize performance of their energy and infrastructure investments — quicker, easier and smarter. |