Attached files
| file | filename |
|---|---|
| 8-K - FORM 8-K - PEPCO HOLDINGS LLC | t74922_8k.htm |
| EX-99.1 - EXHIBIT 99.1 - PEPCO HOLDINGS LLC | ex99-1.htm |
EXHIBIT 99.2
 |
Third Quarter 2012 Earnings Call
NOVEMBER 6, 2012
|
 |
Safe Harbor Statement/Regulation G Information
Some of the statements contained in today’s presentation with respect to Pepco Holdings, Pepco, Delmarva Power and Atlantic City Electric, including each of their respective subsidiaries, are forward-looking statements within the meaning of the U.S. federal securities laws and are subject to the safe harbor created thereby and by the Private Securities Litigation Reform Act of 1995. These statements include declarations regarding the intents, beliefs and current expectations of one or more of PHI, Pepco, DPL or ACE (each a Reporting Company) or their subsidiaries. In some cases you can identify forward-looking statements by terminology such as “may,” “might,” “will,” “should,” “could,” “expects,” “intends,” “assumes,” “seeks to,” “plans,” “anticipates,” “believes,” “projects,” “estimates,” “predicts,” “potential,” “future,” “goal,” “objective,” or “continue”, the negative or other variations of such terms, or comparable terminology, or by discussions of strategy that involve risks and uncertainties. Forward-looking statements involve estimates, assumptions, known and unknown risks, uncertainties and other factors that may cause one or more Reporting Companies’ or their subsidiaries’ actual results, levels of activity, performance or achievements to be materially different from any future results, levels of activity, performance or achievements expressed or implied by such forward-looking statements. Therefore, forward-looking statements are not guarantees or assurances of future performance, and actual results could differ materially from those indicated by the forward-looking statements. These forward-looking statements are qualified in their entirety by, and should be read together with, the risk factors included in the “Risk Factors” section and other statements in each Reporting Company’s annual report on Form 10-K for the year ended December 31, 2011 (as amended) and other SEC filings, including each Reporting Company’s Form 10-Q for the quarter ended September 30, 2012, and investors should refer to these risk factor sections and such other statements. All such factors are difficult to predict, contain uncertainties, are beyond each Reporting Company’s or its subsidiaries’ control and may cause actual results to differ materially from those contained in the forward-looking statements. Any forward-looking statements speak only as to the date of this presentation and none of the Reporting Companies undertakes an obligation to update any forward-looking statements to reflect events or circumstances after the date on which such statements are made or to reflect the occurrence of unanticipated events. New factors emerge from time to time, and it is not possible for a Reporting Company to predict all such factors, nor can the impact of any such factor be assessed on such Reporting Company’s or its subsidiaries’ business (viewed independently or together with the business or businesses of some or all of the other Reporting Companies or their subsidiaries) or the extent to which any factor, or combination of factors, may cause results to differ materially from those contained in any forward-looking statement. The foregoing factors should not be construed as exhaustive. PHI routinely makes available important information with respect to each Reporting Company, including copies of each Reporting Company’s annual, periodic and current reports filed or furnished with the Securities and Exchange Commission under the Securities Exchange Act of 1934, on PHI’s website at http://www.pepcoholdings.com/investors. PHI recognizes its website as a key channel of distribution to reach public investors and as a means of disclosing material non-public information to comply with each Reporting Company’s disclosure obligations under SEC Regulation FD. Information contained on PHI’s website shall not be deemed incorporated into, or to be part of, this presentation, and any website references are not intended to be made through active hyperlinks.
PHI discloses net income from continuing operations and related per share data (both as historical information and earnings guidance) excluding certain items (non-GAAP financial information) because management believes that these items are not representative of PHI’s ongoing business operations. Management uses this information, and believes that such information is useful to investors, in evaluating PHI’s period-over-period performance. The inclusion of this disclosure is intended to complement, and should not be considered as an alternative to, PHI’s reported net income from continuing operations and related per share data in accordance with accounting principles generally accepted in the United States (GAAP).
2
|
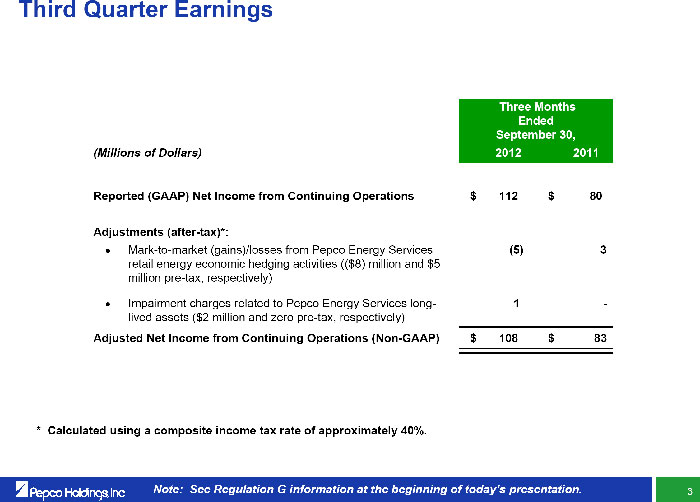 |
Third Quarter Earnings
Three Months
Ended
September 30,
(Millions of Dollars) 2012 2011
Reported (GAAP) Net Income from Continuing Operations $ 112 $80
Adjustments (after-tax)*:
Mark-to-market (gains)/losses from Pepco Energy Services (5) 3
retail energy economic hedging activities (($8) million and $5
million pre-tax, respectively)
Impairment charges related to Pepco Energy Services long- 1 -
lived assets ($2 million and zero pre-tax, respectively)
Adjusted Net Income from Continuing Operations (Non-GAAP) $ 108 $83
* Calculated using a composite income tax rate of approximately 40%.
Note: See Regulation G information at the beginning of today’s presentation. 3
|
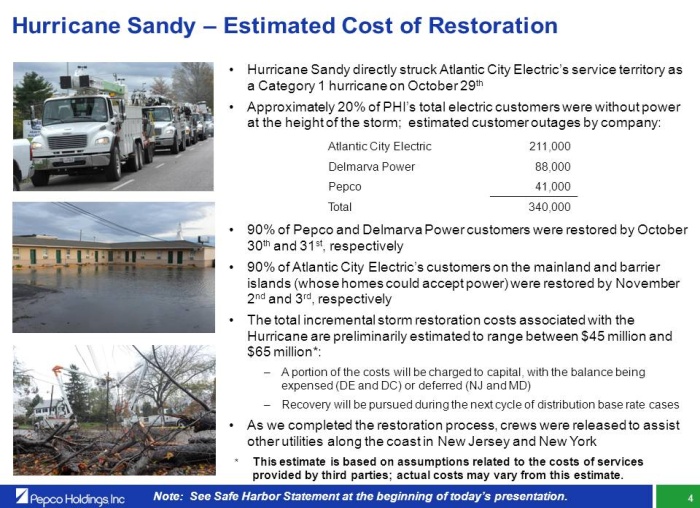 |
Hurricane Sandy – Estimated Cost of Restoration
[To be updated]
• Hurricane Sandy struck the Mid-Atlantic region on October 29th with heavy wind and driving rain
• Approximately 340,000 customers (~18% of total electric customers) were without power at the height of the storm:
– Atlantic City Electric – ~211,000
– Delmarva Power – ~88,000
– Pepco – ~41,000
• The vast majority of Pepco and Delmarva Power customers were restored within 30 hours and 36 hours, respectively
• The vast majority of Atlantic City Electric’s customers on the mainland and barrier islands (whose homes could accept power) were restored by November 3rd and 4th, respectively
• The total incremental storm restoration costs associated with the Hurricane are preliminarily estimated to range between $XX million and $XX million*:
– A portion of the costs will be charged to capital, with the balance being expensed (DE and DC) or deferred (NJ and MD)
– Recovery will be pursued during the next cycle of distribution base rate cases
* This estimate is based on assumptions related to the costs of services provided by third parties; actual costs may vary from this estimate.
Note: See Safe Harbor Statement at the beginning of today’s presentation. 4
|
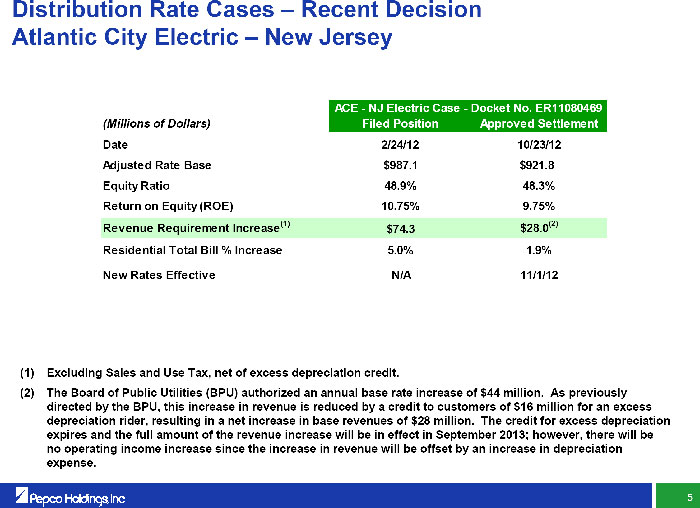 |
Distribution Rate Cases – Recent Decision Atlantic City Electric – New Jersey
ACE - NJ Electric Case - Docket No. ER11080469
(Millions of Dollars) Filed Position Approved Settlement
Date 2/24/12 10/23/12
Adjusted Rate Base $987.1 $921.8
Equity Ratio 48.9% 48.3%
Return on Equity (ROE) 10.75% 9.75%
Revenue Requirement Increase(1) $74.3 $28.0(2)
Residential Total Bill % Increase 5.0% 1.9%
New Rates Effective N/A 11/1/12
(1) Excluding Sales and Use Tax, net of excess depreciation credit.
(2) The Board of Public Utilities (BPU) authorized an annual base rate increase of $44 million. As previously directed by the BPU, this increase in revenue is reduced by a credit to customers of $16 million for an excess depreciation rider, resulting in a net increase in base revenues of $28 million. The credit for excess depreciation expires and the full amount of the revenue increase will be in effect in September 2013; however, there will be no operating income increase since the increase in revenue will be offset by an increase in depreciation expense.
5
|
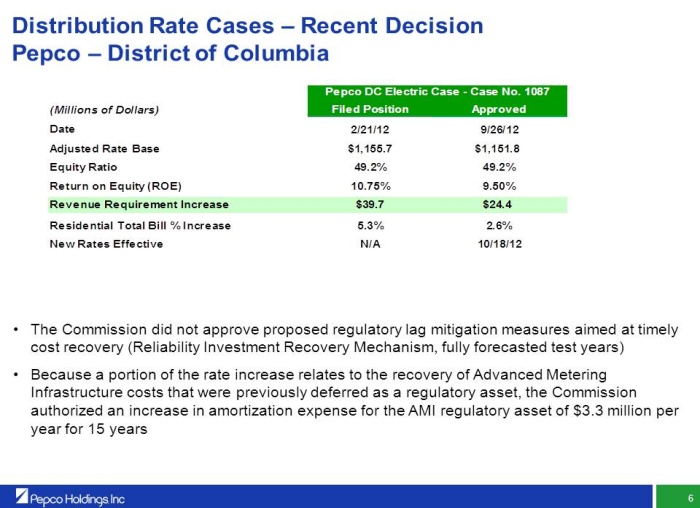 |
Distribution Rate Cases – Recent Decision Pepco – District of Columbia
Pepco DC Electric Case - Case No. 1087
(Millions of Dollars) Filed Position Approved
Date 2/21/12 9/26/12
Adjusted Rate Base $1,155.7 $1,151.8
Equity Ratio 49.2% 49.2%
Return on Equity (ROE) 10.75% 9.50%
Revenue Requirement Increase $39.7 $24.4
Residential Total Bill % Increase 5.3% 2.6%
New Rates Effective N/A 10/18/12
• The Commission did not approve proposed regulatory lag mitigation measures aimed at timely cost recovery (Reliability Investment Recovery Mechanism, fully forecasted test years)
• Because a portion of the rate increase relates to the recovery of Advanced Metering Infrastructure costs that were previously deferred as a regulatory asset, the Commission authorized an increase in amortization expense for the AMI regulatory asset of $3.3 million per year for 15 years
6
|
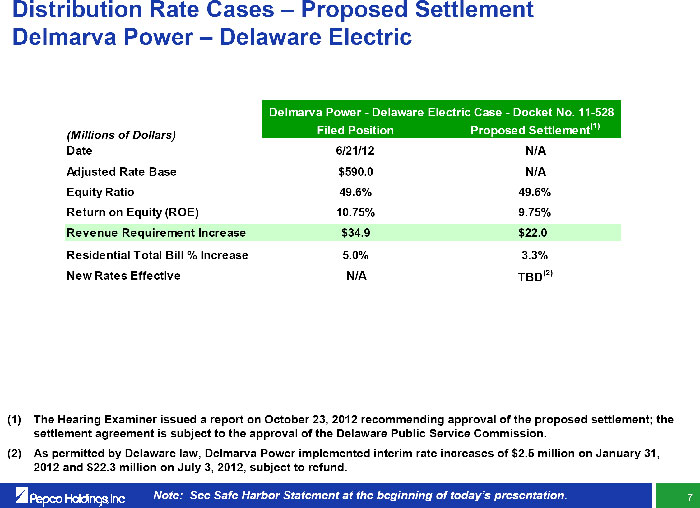 |
Distribution Rate Cases – Proposed Settlement Delmarva Power – Delaware Electric
Delmarva Power - Delaware Electric Case - Docket No. 11-528
(Millions of Dollars) Filed Position Proposed Settlement(1)
Date 6/21/12 N/A
Adjusted Rate Base $590.0 N/A
Equity Ratio 49.6% 49.6%
Return on Equity (ROE) 10.75% 9.75%
Revenue Requirement Increase $34.9 $22.0
Residential Total Bill % Increase 5.0% 3.3%
New Rates Effective N/A TBD(2)
(1) The Hearing Examiner issued a report on October 23, 2012 recommending approval
of the proposed settlement; the settlement agreement is subject to the approval of the Delaware Public Service Commission.
(2) As permitted by Delaware law, Delmarva Power implemented interim rate increases of $2.5 mi
llion on January 31, 2012 and $22.3 million on July 3, 2012, subject to refund.
Note: See Safe Harbor Statement at the beginningof today’s presentation. 7
|
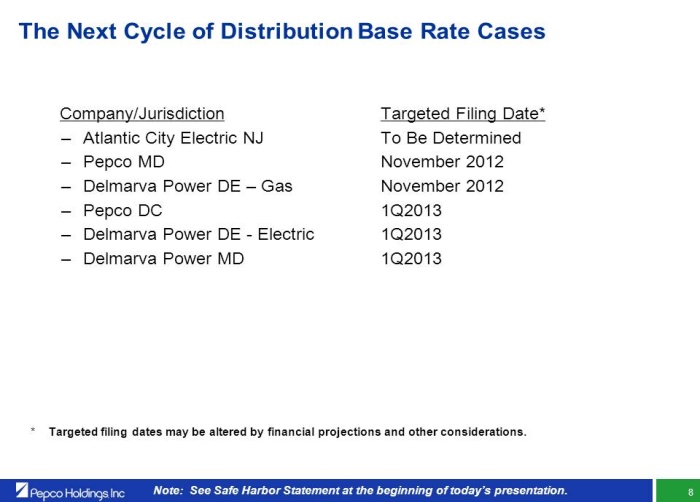 |
The Next Cycle of Distribution Base Rate Cases
Company/Jurisdiction Targeted Filing Date*
– Atlantic City Electric NJ Being Evaluated
– Pepco MD November 2012
– Delmarva Power DE – Gas November 2012
– Pepco DC 1Q2013
– Delmarva Power DE - Electric 1Q2013
– Delmarva Power MD 1Q2013
* Targeted filing dates may be altered by financial projections and other considerations.
Note: See Safe Harbor Statement at the beginning of today’s presentation. 8
|
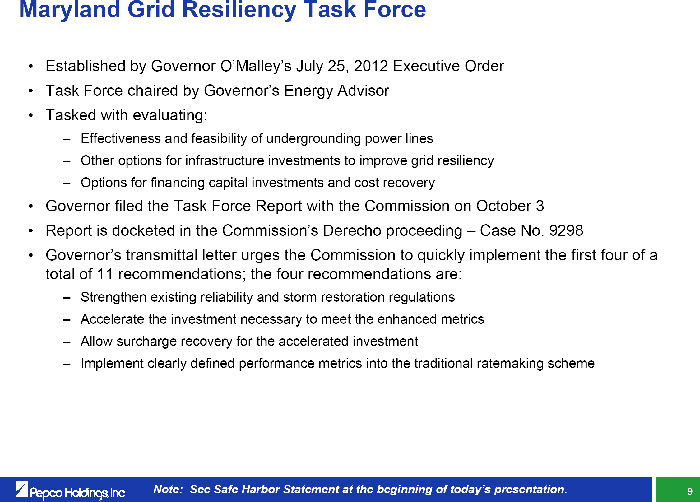 |
Maryland Grid Resiliency Task Force
• Established by Governor O’Malley’s July 25, 2012 Executive Order
• Task Force chaired by Governor’s Energy Advisor
• Tasked with evaluating:
– Effectiveness and feasibility of undergrounding power lines
– Other options for infrastructure investments to improve grid resiliency
– Options for financing capital investments and cost recovery
• Governor filed the Task Force Report with the Commission on October 3
• Report is docketed in the Commission’s Derecho proceeding – Case No. 9298
• Governor’s transmittal letter urges the Commission to quickly implement the first four of a total of 11 recommendations; the four recommendations are:
– Strengthen existing reliability and storm restoration regulations
– Accelerate the investment necessary to meet the enhanced metrics
– Allow surcharge recovery for the accelerated investment
– Implement clearly defined performance metrics into the traditional ratemaking scheme
Note: See Safe Harbor Statement at the beginning of today’s presentation. 9
|
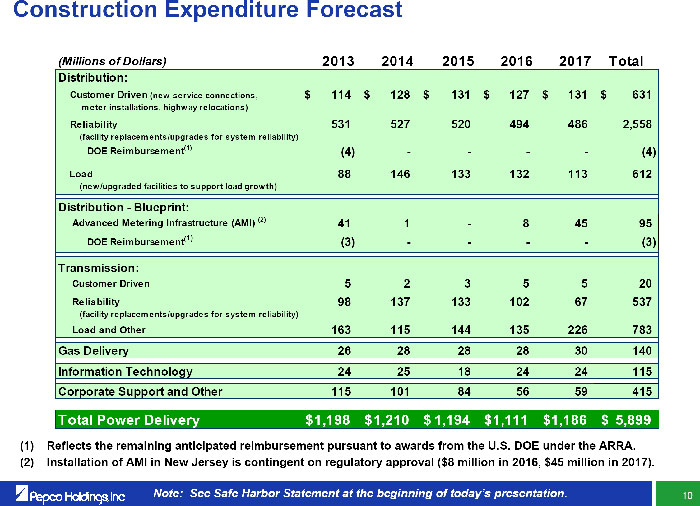 |
Construction Expenditure Forecast
(Millions of Dollars) 2013 2014 2015 20162017Total
Distribution:
Customer Driven (new service connections, $ 114 $ 128 $ 131$127$131$631
meter installations, highway relocations)
Reliability 531 527 520 4944862,558
(facility replacements/upgrades for system reliability)
DOE Reimbursement(1) (4) - - --(4)
Load 88 146 133 132113612
(new/upgraded facilities to support load growth)
Distribution - Blueprint:
Advanced Metering Infrastructure (AMI) (2) 41 1 - 84595
DOE Reimbursement(1) (3) - - --(3)
Transmission:
Customer Driven 5 2 3 5520
Reliability 98 137 133 10267537
(facility replacements/upgrades for system reliability)
Load and Other 163 115 144 135226783
Gas Delivery 26 28 28 2830140
Information Technology 24 25 18 2424115
Corporate Support and Other 115 101 84 5659415
Total Power Delivery $ 1,198 $ 1,210 $ 1,194 $ 1,111$ 1,186$5,899
(1) Reflects the remaining anticipated reimbursement pursuant to awards from the U.S. DOE under the ARRA. (2) Installation of AMI in New Jersey is contingent on regulatory approval ($8 million in 2016, $45 million in 2017).
Note: See Safe Harbor Statement at the beginning of today’s presentation. 10
|
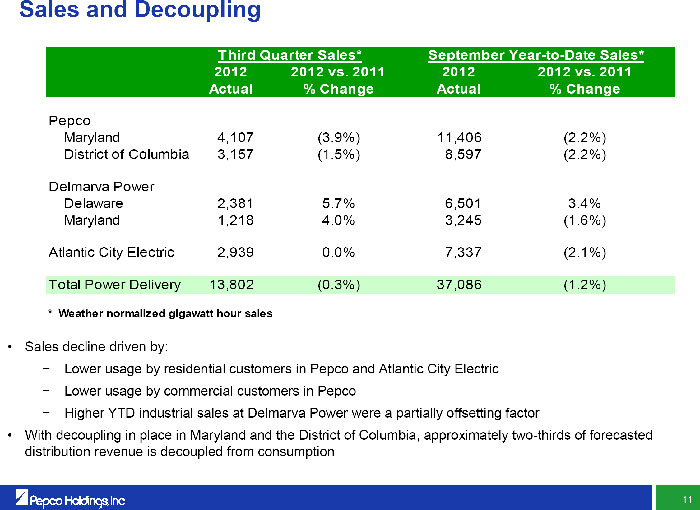 |
Sales and Decoupling
Third Quarter Sales* September Year-to-Date Sales*
2012 2012 vs. 2011 20122012 vs. 2011
Actual % Change Actual% Change
Pepco
Maryland 4,107 (3.9%) 11,406(2.2%)
District of Columbia 3,157 (1.5%) 8,597(2.2%)
Delmarva Power
Delaware 2,381 5.7% 6,5013.4%
Maryland 1,218 4.0% 3,245(1.6%)
Atlantic City Electric 2,939 0.0% 7,337(2.1%)
Total Power Delivery 13,802 (0.3%) 37,086(1.2%)
* Weather normalized gigawatt hour sales
• Sales decline driven by:
Lower usage by residential customers in Pepco and Atlantic City Electric
Lower usage by commercial customers in Pepco
Higher YTD industrial sales at Delmarva Power were a partially offsetting factor
• With decoupling in place in Maryland and the District of Columbia, approximately two-thirds of forecasted distribution revenue is decoupled from consumption
11
|
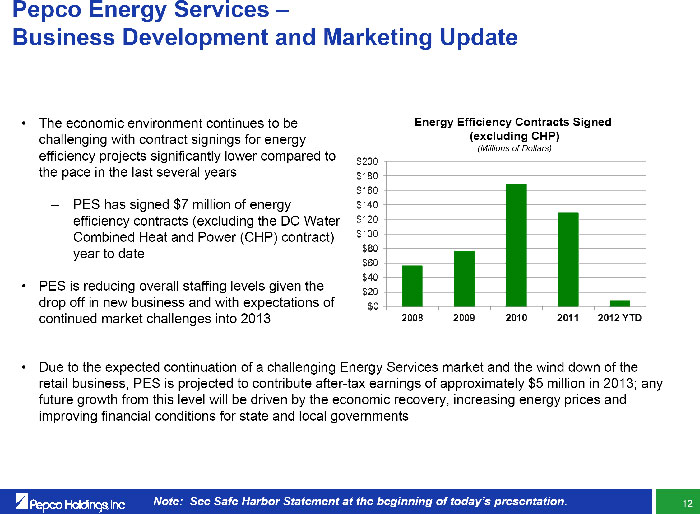 |
Pepco Energy Services –
Business Development and Marketing Update
• The economic environment continues to be challenging with contract signings for energy efficiency projects significantly lower compared to the pace in the last several years
– PES has signed $7 million of energy efficiency contracts (excluding the DC Water Combined Heat and Power (CHP) contract) year to date
• PES is reducing overall staffing levels given the drop off in new business and with expectations of continued market challenges into 2013
• Due to the expected continuation of a challenging Energy Services market and the wind down of the retail business, PES is projected to contribute after-tax earnings of approximately $5 million in 2013; any future growth from this level will be driven by the economic recovery, increasing energy prices and improving financial conditions for state and local governments
Note: See Safe Harbor Statement at the beginning of today’s presentation. 12
|
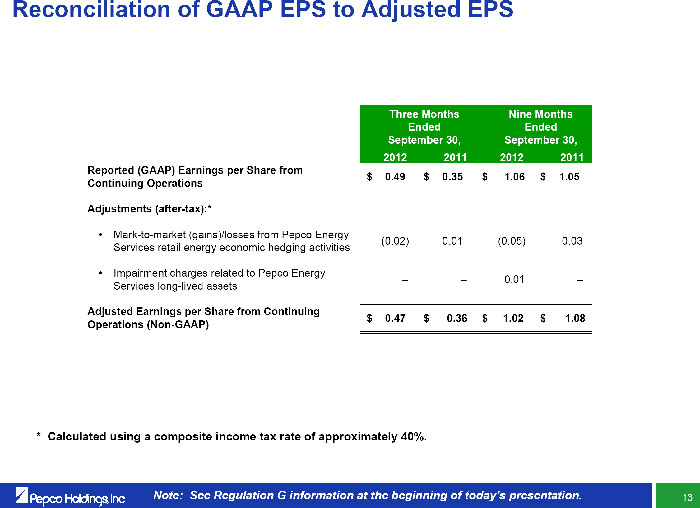 |
Reconciliation of GAAP EPS to Adjusted EPS
Three Months Nine Months
Ended Ended
September 30, September 30,
2012 2011 2012 2011
Reported (GAAP) Earnings per Share from
$ 0.49 $ 0.35 $ 1.06 $1.05
Continuing Operations
Adjustments (after-tax):*
• Mark-to-market (gains)/losses from Pepco Energy (0.02) 0.01 (0.05)0.03
Services retail energy economic hedging activities
• Impairment charges related to Pepco Energy
– – 0.01–
Services long-lived assets
Adjusted Earnings per Share from Continuing
$ 0.47 $ 0.36 $ 1.02 $1.08
Operations (Non-GAAP)
* Calculated using a composite income tax rate of approximately 40%.
Note: See Regulation G information at the beginning of today’s presentation. 13
|
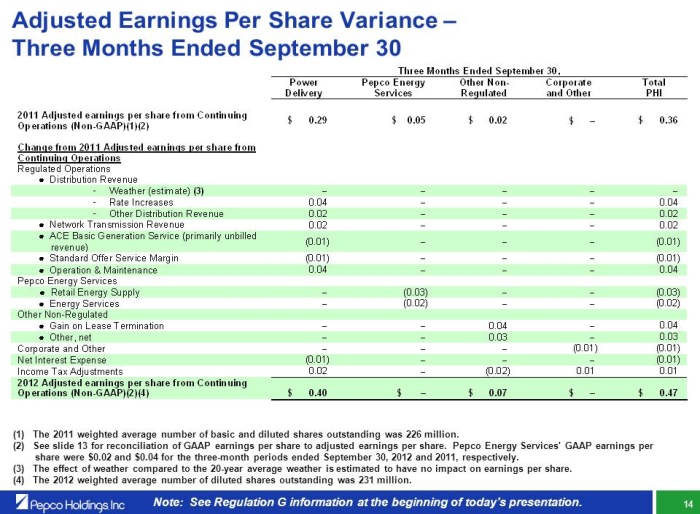 |
Adjusted Earnings Per Share Variance –Three Months Ended September 30
Three Months Ended September 30,
Power Pepco Energy Other Non-Corporate Total
Delivery Services Regulated and Other PHI
2011 Adjusted earnings per share from Continuing
$ 0.29 $ 0.05 $ 0.02 $ $ 0.36
Operations (Non-GAAP)(1)(2)
Change from 2011 Adjusted earnings per share from
Continuing Operations
Regulated Operations
● Distribution Revenue
- Weather (estimate) (3)
- Rate Increases 0.04 0.04
- Other Distribution Revenue 0.02 0.02
● Network Transmission Revenue 0.02 0.02
● ACE Basic Generation Service (primarily unbilled
(0.01) (0.01)
revenue)
● Standard Offer Service Margin (0.01) (0.01)
● Operation & Maintenance 0.04 0.04
Pepco Energy Services
● Retail Energy Supply (0.03)(0.03)
● Energy Services (0.02)(0.02)
Other Non-Regulated
● Gain on Lease Termination 0.040.04
● Other, net 0.030.03
Corporate and Other (0.01)(0.01)
Net Interest Expense (0.01) (0.01)
Income Tax Adjustments 0.02 (0.02)0.010.01
2012 Adjusted earnings per share from Continuing
Operations (Non-GAAP)(2)(4) $ 0.40 $ $ 0.07 $ $ 0.47
(1) The 2011 weighted average number of basic and diluted shares outstanding was 226 million.
(2) See slide 13 for reconciliation of GAAP earnings per share to adjusted earnings per share. Pepco Energy Services’ GAAP earnings per share were $0.02 and $0.04 for the three-month periods ended September 30, 2012 and 2011, respectively.
(3) The effect of weather compared to the 20-year average weather is estimated to have no impact on earnings per share. (4) The 2012 weighted average number of diluted shares outstanding was 231 million.
Note: See Regulation G information at the beginning of today’s presentation. 14
|
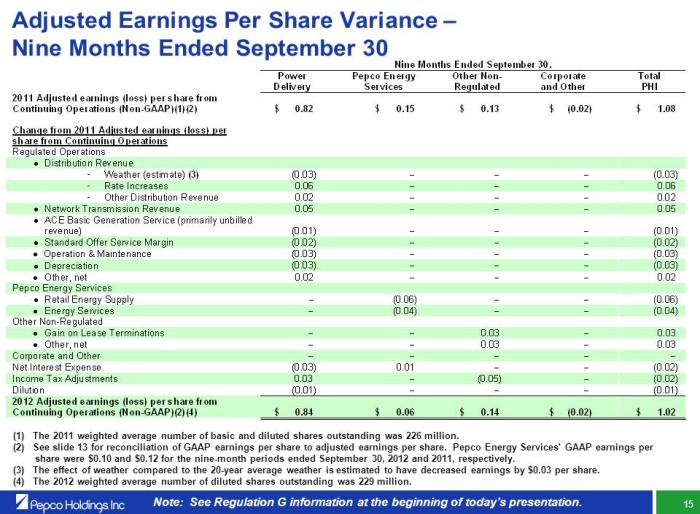 |
Adjusted Earnings Per Share Variance –Nine Months Ended September 30
Nine Months Ended September 30,
Power Pepco Energy Other Non-Corporate Total
Delivery Services Regulated and OtherPHI
2011 Adjusted earnings (loss) per share from
Continuing Operations (Non-GAAP)(1)(2) $ 0.82 $ 0.15 $0.13 $(0.02) $1.08
Change from 2011 Adjusted earnings (loss) per
share from Continuing Operations
Regulated Operations
Distribution Revenue
- Weather (estimate) (3) (0.03) (0.03)
- Rate Increases 0.06 0.06
- Other Distribution Revenue 0.02 0.02
Network Transmission Revenue 0.05 0.05
ACE Basic Generation Service (primarily unbilled
revenue) (0.01) (0.01)
Standard Offer Service Margin (0.02) (0.02)
Operation & Maintenance (0.03) (0.03)
Depreciation (0.03) (0.03)
Other, net 0.02 0.02
Pepco Energy Services
Retail Energy Supply (0.06)(0.06)
Energy Services (0.04)(0.04)
Other Non-Regulated
Gain on Lease Terminations 0.030.03
Other, net 0.030.03
Corporate and Other
Net Interest Expense (0.03) 0.01(0.02)
Income Tax Adjustments 0.03 (0.05)(0.02)
Dilution (0.01) (0.01)
2012 Adjusted earnings (loss) per share from
Continuing Operations (Non-GAAP)(2)(4) $ 0.84 $ 0.06 $0.14$(0.02)$1.02
(1) The 2011 weighted average number of basic and diluted shares outstanding was 226 million.
(2) See slide 13 for reconciliation of GAAP earnings per share to adjusted earnings per share. Pepco Energy Services’ GAAP earnings per share were $0.10 and $0.12 for the nine-month periods ended September 30, 2012 and 2011, respectively. (3) The effect of weather compared to the 20-year average weather is estimated to have decreased earnings by $0.03 per share.
(4) The 2012 weighted average number of diluted shares outstanding was 229 million.
Note: See Regulation G information at the beginning of today’s presentation. 15
|
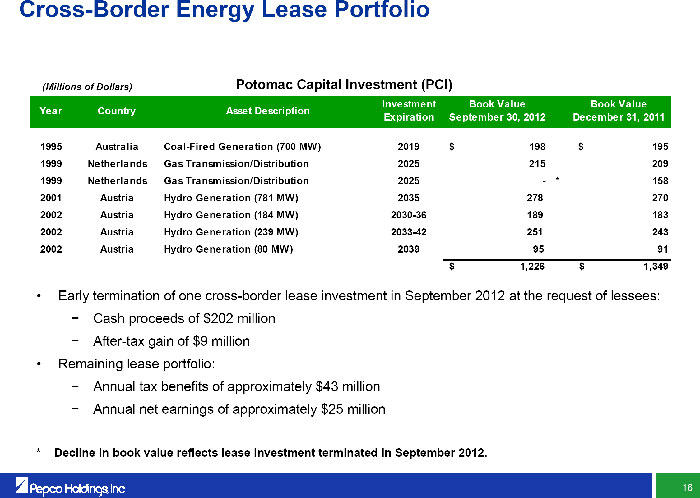 |
Cross-Border Energy Lease Portfolio
(Millions of Dollars) Potomac Capital Investment (PCI)
Investment Book Value Book Value
Year Country Asset Description
Expiration September 30, 2012 December 31, 2011
1995 Australia Coal-Fired Generation (700 MW) 2019 $ 198$195
1999 Netherlands Gas Transmission/Distribution 2025 215209
1999 Netherlands Gas Transmission/Distribution 2025 -*158
2001 Austria Hydro Generation (781 MW) 2035 278270
2002 Austria Hydro Generation (184 MW) 2030-36 189183
2002 Austria Hydro Generation (239 MW) 2033-42 251243
2002 Austria Hydro Generation (80 MW) 2039 9591
$ 1,226 $1,349
• Early termination of one cross-border lease investment in September 2012 at the request of lessees:
Cash proceeds of $202 million
After-tax gain of $9 million
• Remaining lease portfolio:
Annual tax benefits of approximately $43 million
Annual net earnings of approximately $25 million
* Decline in book value reflects lease investment terminated in September 2012.
16
|
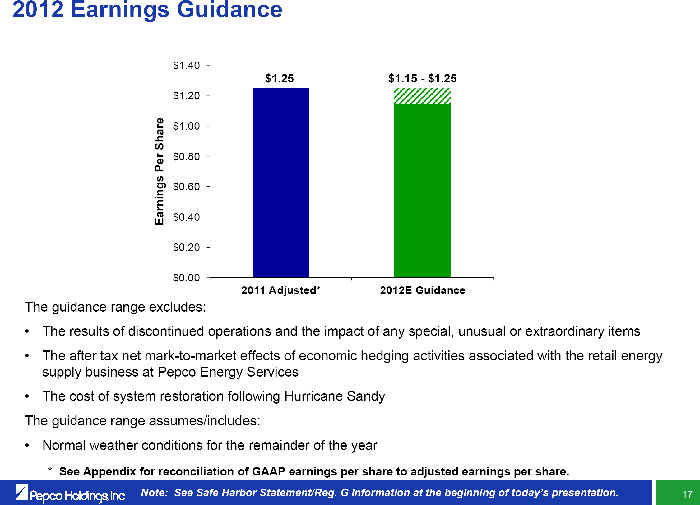 |
2012 Earnings Guidance
The guidance range excludes:
• The results of discontinued operations and the impact of any special, unusual or extraordinary items
• The after tax net mark-to-market effects of economic hedging activities associated with the retail energy supply business at Pepco Energy Services
• The cost of system restoration following Hurricane Sandy The guidance range assumes/includes:
• Normal weather conditions for the remainder of the year
* See Appendix for reconciliation of GAAP earnings per share to adjusted earnings per share.
Note: See Safe Harbor Statement/Reg. G Information at the beginning of today’s presentation. 17
|
 |
Appendix |
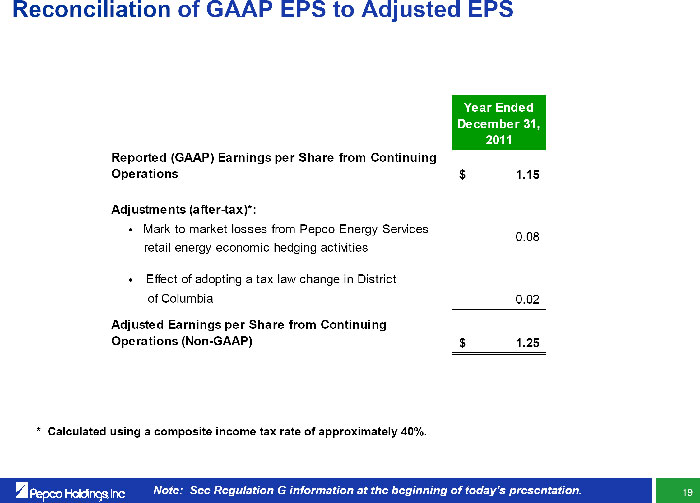 |
Reconciliation of GAAP EPS to Adjusted EPS
Year Ended
December 31,
2011
Reported (GAAP) Earnings per Share from Continuing
Operations $ 1.15
Adjustments (after-tax)*:
• Mark-to-market losses from Pepco Energy Services
0.08
retail energy economic hedging activities
• Effect of adopting a tax law change in District
of Columbia 0.02
Adjusted Earnings per Share from Continuing
Operations (Non-GAAP) $ 1.25
* Calculated using a composite income tax rate of approximately 40%.
Note: See Regulation G information at the beginning of today’s presentation. 19
|