Attached files
| file | filename |
|---|---|
| 8-K - FORM 8-K - US BANCORP \DE\ | d431889d8k.htm |
Exhibit 99.1

| BancAnalysts Association of Boston Conference Andy Cecere Vice Chairman and CFO November 2, 2012 |

| The following information appears in accordance with the Private Securities Litigation Reform Act of 1995: This presentation contains forward-looking statements about U.S. Bancorp. Statements that are not historical or current facts, including statements about beliefs and expectations, are forward-looking statements and are based on the information available to, and assumptions and estimates made by, management as of the date made. These forward-looking statements cover, among other things, anticipated future revenue and expenses and the future plans and prospects of U.S. Bancorp. Forward-looking statements involve inherent risks and uncertainties, and important factors could cause actual results to differ materially from those anticipated. Global and domestic economies could fail to recover from the recent economic downturn or could experience another severe contraction, which could adversely affect U.S. Bancorp's revenues and the values of its assets and liabilities. Global financial markets could experience a recurrence of significant turbulence, which could reduce the availability of funding to certain financial institutions and lead to a tightening of credit, a reduction of business activity, and increased market volatility. Continued stress in the commercial real estate markets, as well as a delay or failure of recovery in the residential real estate markets, could cause additional credit losses and deterioration in asset values. In addition, U.S. Bancorp's business and financial performance is likely to be negatively impacted by effects of recently enacted and future legislation and regulation. U.S. Bancorp's results could also be adversely affected by continued deterioration in general business and economic conditions; changes in interest rates; deterioration in the credit quality of its loan portfolios or in the value of the collateral securing those loans; deterioration in the value of securities held in its investment securities portfolio; legal and regulatory developments; increased competition from both banks and non-banks; changes in customer behavior and preferences; effects of mergers and acquisitions and related integration; effects of critical accounting policies and judgments; and management's ability to effectively manage credit risk, residual value risk, market risk, operational risk, interest rate risk and liquidity risk. For discussion of these and other risks that may cause actual results to differ from expectations, refer to U.S. Bancorp's Annual Report on Form 10-K for the year ended December 31, 2011, on file with the Securities and Exchange Commission, including the sections entitled "Risk Factors" and "Corporate Risk Profile" contained in Exhibit 13, and all subsequent filings with the Securities and Exchange Commission under Sections 13(a), 13(c), 14 or 15(d) of the Securities Exchange Act of 1934. Forward-looking statements speak only as of the date they are made, and U.S. Bancorp undertakes no obligation to update them in light of new information or future events. This presentation includes non-GAAP financial measures to describe U.S. Bancorp's performance. The reconciliations of those measures to GAAP measures are provided within or in the appendix of the presentation. These disclosures should not be viewed as a substitute for operating results determined in accordance with GAAP, nor are they necessarily comparable to non-GAAP performance measures that may be presented by other companies. Forward-looking Statements and Additional Information |
| U.S. Bancorp Overview Capital Management Current Topics |
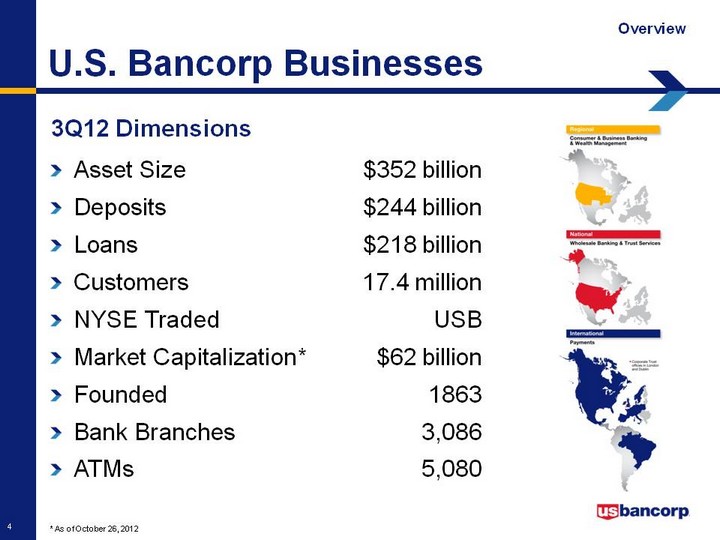
| 3Q12 Dimensions * As of October 26, 2012 Overview U.S. Bancorp Businesses Asset Size $352 billion Deposits $244 billion Loans $218 billion Customers 17.4 million NYSE Traded USB Market Capitalization* $62 billion Founded 1863 Bank Branches 3,086 ATMs 5,080 |
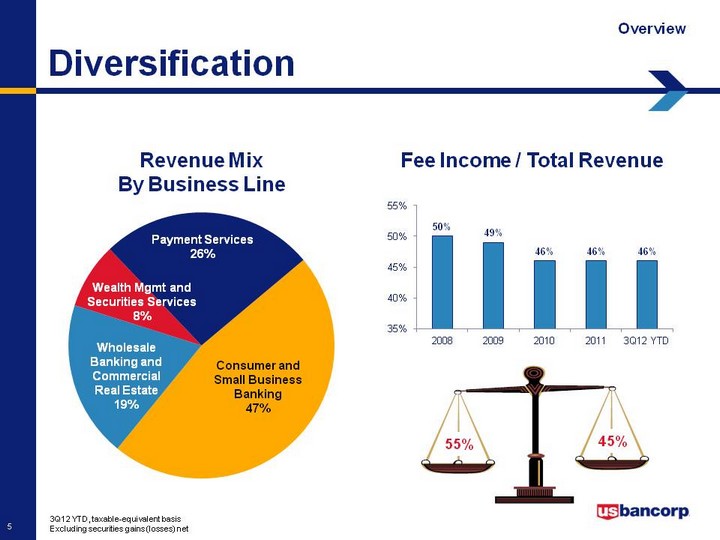
| 3Q12 YTD, taxable-equivalent basis Excluding securities gains (losses) net Revenue Mix By Business Line Fee Income / Total Revenue Diversification Consumer and Small Business Banking 47% Payment Services 26% Wealth Mgmt and Securities Services 8% Wholesale Banking and Commercial Real Estate 19% Overview 55% 45% |
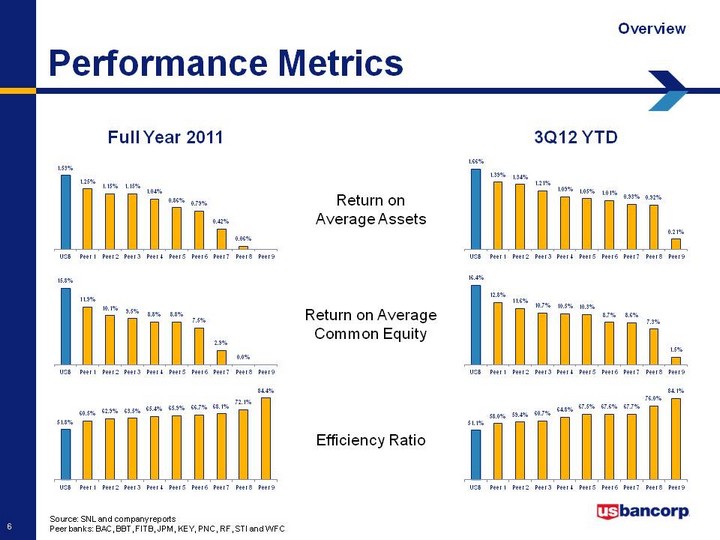
| Source: SNL and company reports Peer banks: BAC, BBT, FITB, JPM, KEY, PNC, RF, STI and WFC Return on Average Assets Return on Average Common Equity Efficiency Ratio 3Q12 YTD Full Year 2011 Performance Metrics Overview |
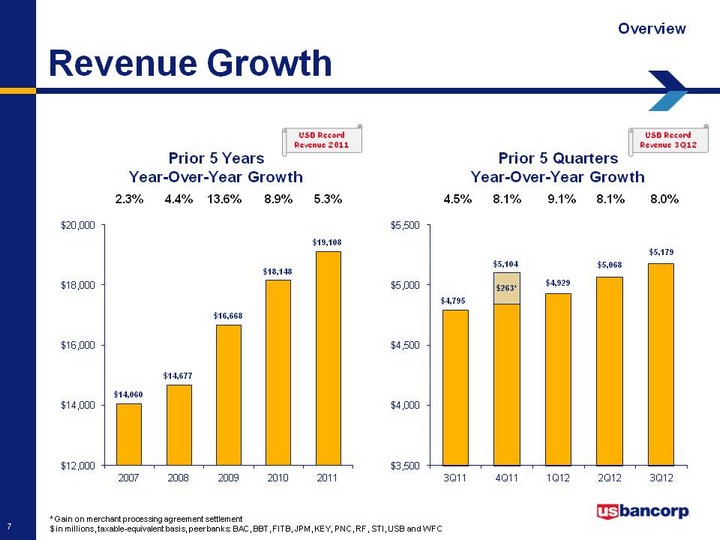
| * Gain on merchant processing agreement settlement $ in millions, taxable-equivalent basis, peer banks: BAC, BBT, FITB, JPM, KEY, PNC, RF, STI, USB and WFC Prior 5 Years Year-Over-Year Growth 2.3% 4.4% 13.6% 8.9% 5.3% Prior 5 Quarters Year-Over-Year Growth 4.5% 8.1% 9.1% 8.1% 8.0% Revenue Growth USB Record Revenue 2011 Overview USB Record Revenue 3Q12 |
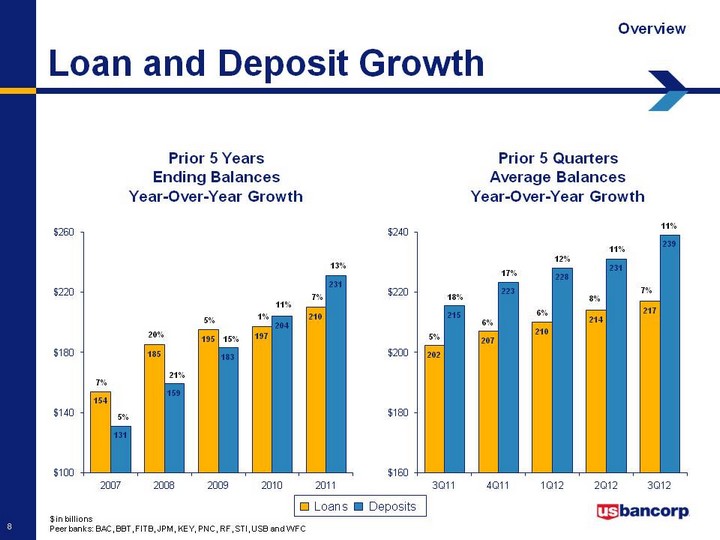
| $ in billions Peer banks: BAC, BBT, FITB, JPM, KEY, PNC, RF, STI, USB and WFC 6% 12% 8% 5% 17% 6% 11% 11% 18% 1% 7% 7% 20% 5% 11% 13% 5% 21% 15% Loans Deposits Prior 5 Years Ending Balances Year-Over-Year Growth Prior 5 Quarters Average Balances Year-Over-Year Growth Loan and Deposit Growth Overview 7% |
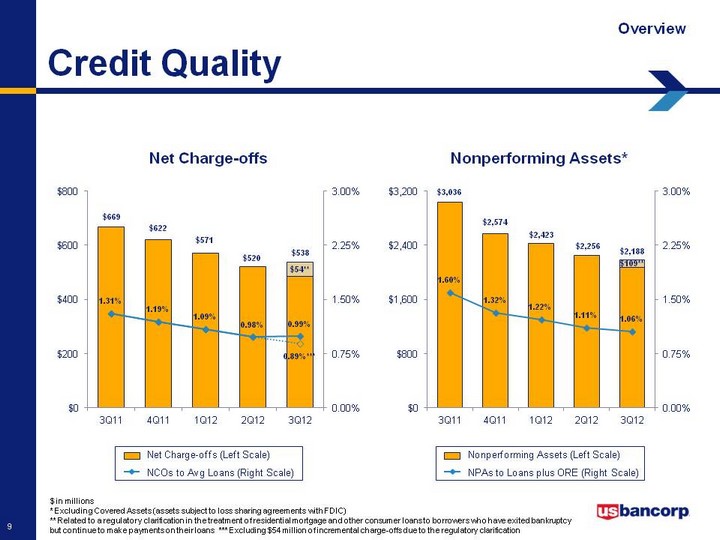
| Credit Quality Overview $ in millions * Excluding Covered Assets (assets subject to loss sharing agreements with FDIC) ** Related to a regulatory clarification in the treatment of residential mortgage and other consumer loans to borrowers who have exited bankruptcy but continue to make payments on their loans *** Excluding $54 million of incremental charge-offs due to the regulatory clarification Net Charge-offs Nonperforming Assets* Net Charge-offs (Left Scale) NCOs to Avg Loans (Right Scale) Nonperforming Assets (Left Scale) NPAs to Loans plus ORE (Right Scale) |
| U.S. Bancorp Overview Capital Management Current Topics |
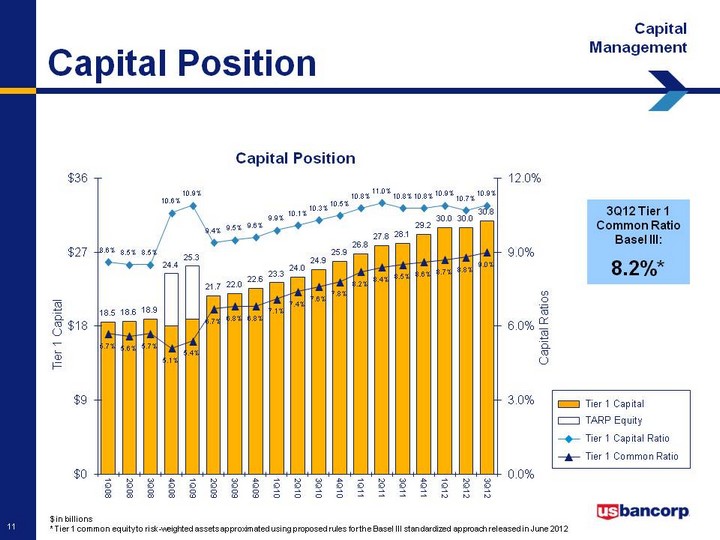
| $ in billions * Tier 1 common equity to risk-weighted assets approximated using proposed rules for the Basel III standardized approach released in June 2012 TARP Equity Tier 1 Capital Tier 1 Capital Ratio Tier 1 Common Ratio 3Q12 Tier 1 Common Ratio Basel III: 8.2%* Capital Position Capital Management Capital Position |
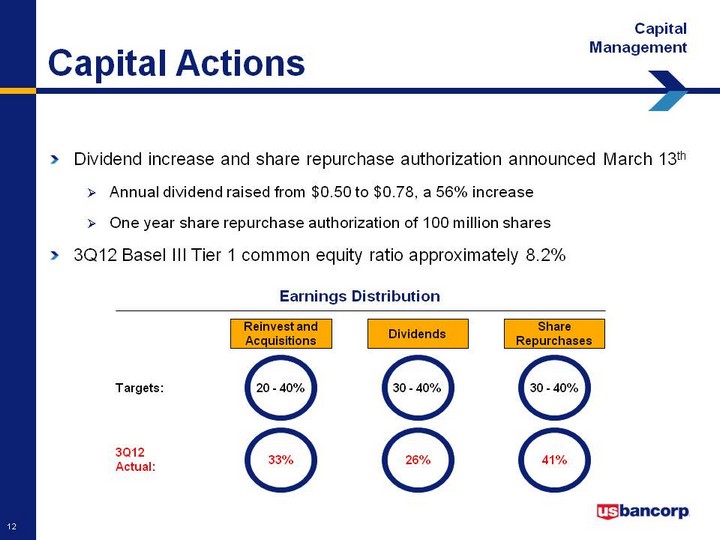
| Capital Actions Dividend increase and share repurchase authorization announced March 13th Annual dividend raised from $0.50 to $0.78, a 56% increase One year share repurchase authorization of 100 million shares 3Q12 Basel III Tier 1 common equity ratio approximately 8.2% Capital Management Reinvest and Acquisitions Dividends Share Repurchases 20 - 40% Targets: 30 - 40% 30 - 40% 33% 3Q12 Actual: 41% 26% Earnings Distribution |

| Debt Ratings Capital Management Holding company senior debt ratings as of October 26, 2012 op=outlook positive on=outlook negative s=outlook stable wn=watch negative wp=watch positive |
| U.S. Bancorp Overview Capital Management Current Topics |
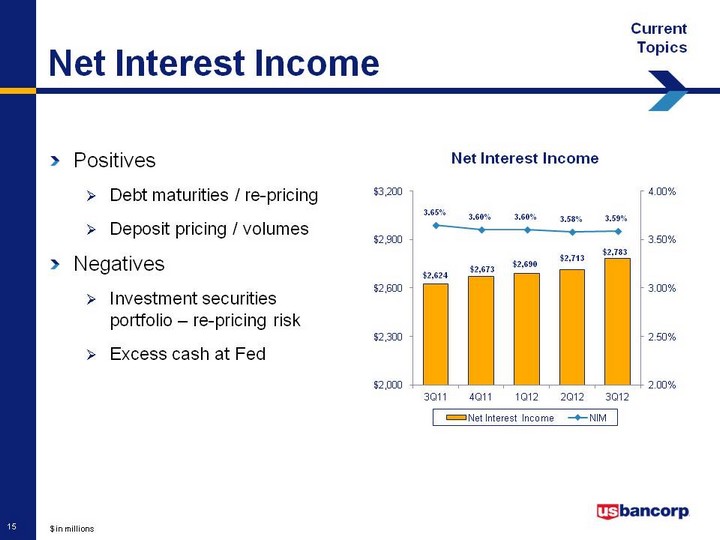
| Net Interest Income Current Topics Positives Debt maturities / re-pricing Deposit pricing / volumes Negatives Investment securities portfolio - re-pricing risk Excess cash at Fed Net Interest Income $ in millions |
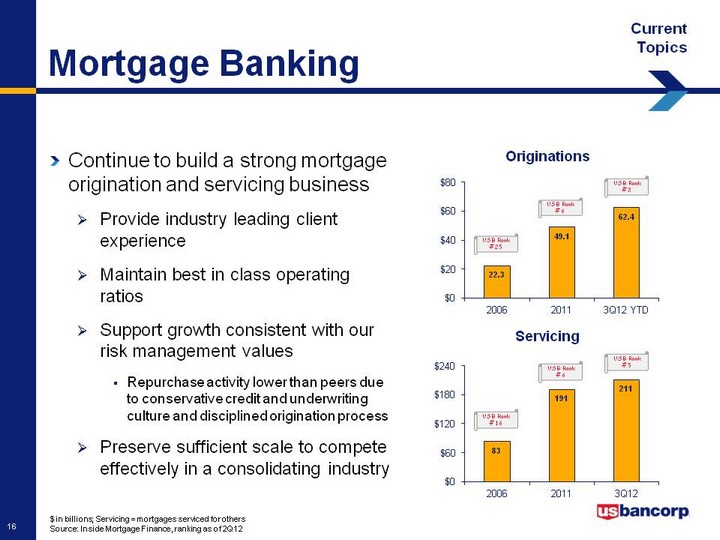
| Mortgage Banking $ in billions; Servicing = mortgages serviced for others Source: Inside Mortgage Finance, ranking as of 2Q12 Originations Servicing USB Rank #25 Continue to build a strong mortgage origination and servicing business Provide industry leading client experience Maintain best in class operating ratios Support growth consistent with our risk management values Repurchase activity lower than peers due to conservative credit and underwriting culture and disciplined origination process Preserve sufficient scale to compete effectively in a consolidating industry USB Rank #6 USB Rank #6 USB Rank #16 USB Rank #3 USB Rank #5 Current Topics |
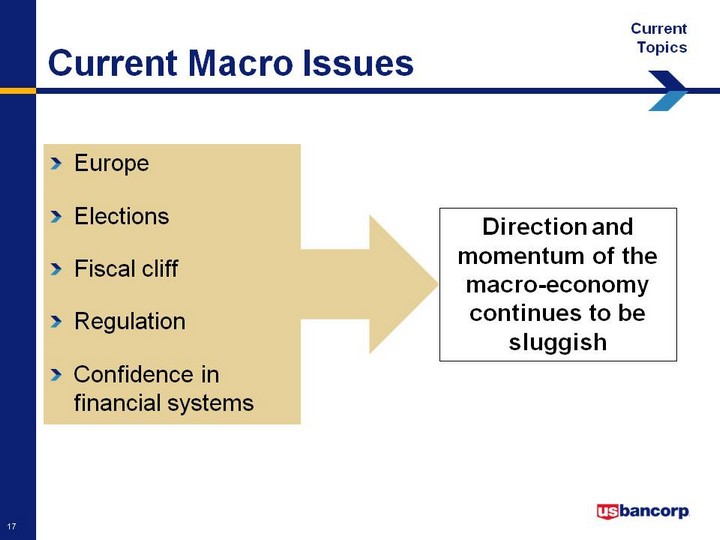
| Current Macro Issues Current Topics Europe Elections Fiscal cliff Regulation Confidence in financial systems Direction and momentum of the macro-economy continues to be sluggish |
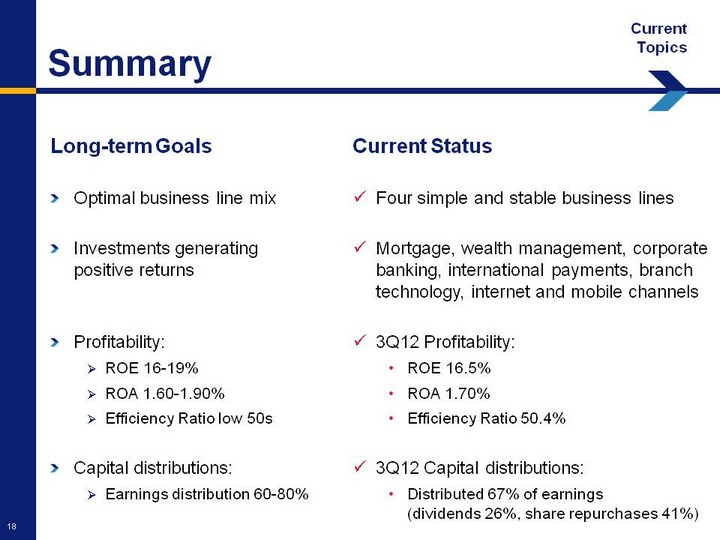
| Long-term Goals Optimal business line mix Investments generating positive returns Profitability: ROE 16-19% ROA 1.60-1.90% Efficiency Ratio low 50s Capital distributions: Earnings distribution 60-80% Summary Current Status Four simple and stable business lines Mortgage, wealth management, corporate banking, international payments, branch technology, internet and mobile channels 3Q12 Profitability: ROE 16.5% ROA 1.70% Efficiency Ratio 50.4% 3Q12 Capital distributions: Distributed 67% of earnings (dividends 26%, share repurchases 41%) Current Topics |
| continues Momentum |
| Appendix |
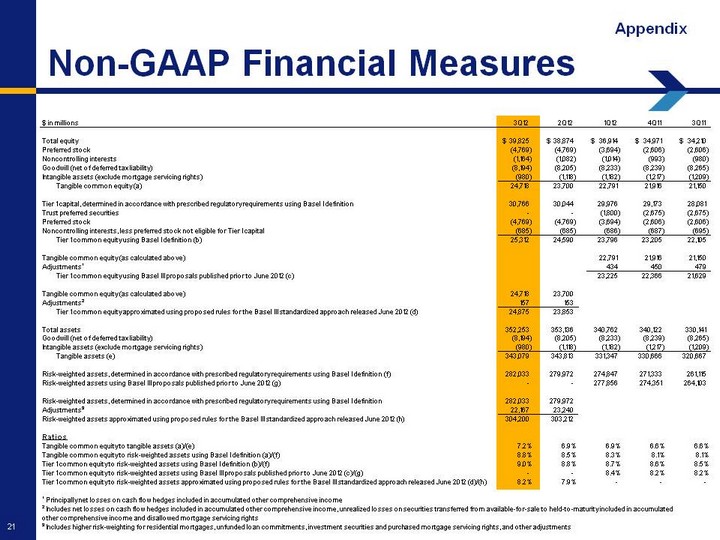
| Non-GAAP Financial Measures Appendix |
| BancAnalysts Association of Boston Conference |