Attached files
| file | filename |
|---|---|
| 8-K - FORM 8-K - SUSQUEHANNA BANCSHARES INC | d432572d8k.htm |
 Susquehanna Bancshares, Inc.
Investor Presentation
3rd Quarter 2012
Exhibit 99.1 |
 Forward-Looking Statements
During the course of this presentation, we may make projections and other
forward-looking statements regarding priorities and strategic objectives
of
Susquehanna Bancshares, Inc., as well as projected capital ratios, efficiency
ratios, net income and earnings. We encourage investors to understand
forward-looking statements to be strategic objectives rather than absolute
targets of future performance. We wish to caution you that these
forward- looking statements may differ materially from actual results
due to a number of
risks and uncertainties. For a more detailed description of the
factors that may
affect Susquehanna’s operating results, we refer you to our filings with the
Securities & Exchange Commission, including our annual report on
Form 10-K
for the year ended December 31, 2011 and Form 10-Q for the quarter ended
June 30, 2012. Susquehanna assumes no obligation to update the forward-
looking statements made during this presentation.
For more information, please visit our Web site at:
www.susquehanna.net
2 |
 Susquehanna Profile
Corporate Overview
Super-Community Bank headquartered in
Lititz, PA
261 banking offices concentrated in Central
PA, Western MD, and Philadelphia and
Baltimore MSAs
35
th
largest U.S. commercial bank by assets
Experienced management team with extensive
market knowledge
Franchise is a diversified mix of consumer and
business customers, products and revenue
sources
Non-bank affiliates offering products and
services in:
Wealth management
Insurance brokerage and employee benefits
Commercial finance
Vehicle leasing
Selected Data as of 9/30/2012
Assets:
$18.1 billion
Deposits:
$12.7 billion
Loans & Leases:
$12.7 billion
Assets under management
$7.8 billion
and administration:
Market Cap:
>$1.9 billion
Average daily volume (3 months)
>1 million shares
Institutional ownership
>
70%
Dividend yield
2.68%*
*Based on 4Q12 dividend of $.07 per share
3 |
 Main
Street Banking The Susquehanna Way
Main Street Banking
The Susquehanna Way
4
Personalized customer service of a local community bank,
backed by the lending capacity and diverse product
offerings of a regional financial services company
Regional banking model where customers have access to
local decision makers
A focus on building enduring relationships
Culture of excellence and exceeding customer expectations |
 Successful Acquisitions of
Abington (2011) and Tower (2012)
Successful Acquisitions of
Abington (2011) and Tower (2012)
Successfully converted 200,000 + accounts
Transitioned or consolidated 69 branches
Converted $2.6 billion in loans, $2.9 billion in deposits and $443 million in
assets under administration
Achieved desired cost savings of $58 million
Added critical mass to the Philadelphia metro market
Strengthened core central Pennsylvania market, increasing deposit market
share to 9.0% from 7.6%¹
and improved market share rank to 5
from 6
Strategically reorganized into regional banking model with 12 regions
reporting through 3 market CEO’s
5
1
FDIC Deposit Market Share Report for the 16 counties comprising Susquehanna’s
Pennsylvania Market. 6/30/11 versus 6/30/12 th
th |
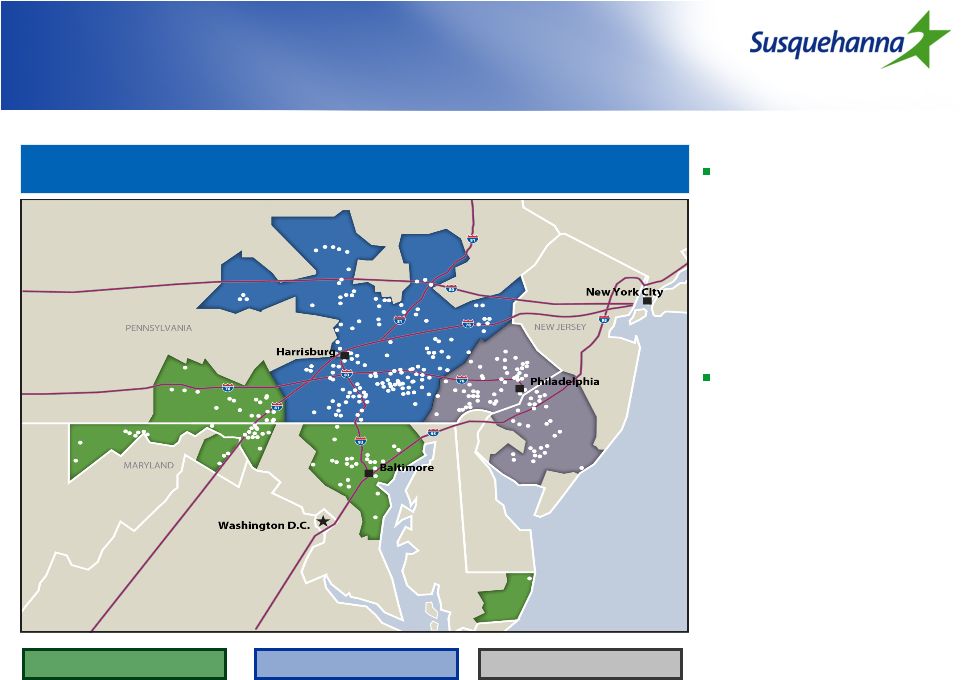 Premier Mid-Atlantic Franchise
Branch Density in Diverse and Attractive Markets
6
Strategically located
franchise with close
proximity to major
metro areas and key
East Coast
transportation hubs
Regional leadership
teams within three
markets provide
local community
banking approach
unmatched by
national and
multi-national
competitors
Pennsylvania Market
Delaware Valley Market
Maryland Market |
 Community Banking Opportunities
Source: SNL Financial
Note: Regulatory branch and deposit data as of June 30, 2012; banks and thrifts with
deposits in counties SUSQ operates in PA/NJ/MD/WV Traditional branches only,
as defined by SNL 7
Rank
Institution
Branch Count
Total Deposits
in Market
($000)
Total Market
Share (%)
1
Wells Fargo & Co.
373
41,021,142
15.3%
2
PNC Financial Services Group Inc.
357
27,078,388
10.1%
3
Bank of America Corp.
224
25,599,340
9.5%
4
M&T Bank Corp.
292
23,873,751
8.9%
5
Toronto-Dominion Bank
164
19,136,622
7.1%
6
Royal Bank of Scotland Group Plc
177
17,058,543
6.3%
7
Susquehanna Bancshares Inc.
262
12,569,634
4.7%
8
Fulton Financial Corp.
187
9,428,543
3.5%
9
Banco Santander SA
176
8,654,240
3.2%
10
National Penn Bancshares Inc.
110
5,622,573
2.1%
11
BB&T Corp.
68
4,051,430
1.5%
12
Beneficial Mutual Bancorp Inc. (MHC)
61
3,645,268
1.4%
13
First Niagara Financial Group Inc.
63
2,684,122
1.0%
14
Metro Bancorp Inc.
33
2,106,159
0.8%
15
Citigroup Inc.
26
2,015,670
0.8%
Total
(1-15)
2,573
204,545,425
76.1%
Total
(1-248)
3,970
268,686,154
100.0%
Deposit Market Share: Counties of Operation
Uniquely positioned as the largest
locally based community bank
Top 3 market share in 12
counties
Top 5 market share in half the
MSAs where we do business
1
st
overall in market share,
excluding companies with
assets greater than $100B
Increased share in 14 out of
22 MSAs from 2011 to 2012
Significant opportunities exist
to gain market share |
 Critical Mass in Attractive Markets
8
Susquehanna Bank Market¹
Pennsylvania
Delaware
Valley
Maryland
Branches
124
71
66
Loans as % of total²
45%
27%
28%
Deposits as % of total²
44%
30%
26%
Deposit market share (rank)³
2012
9.0%
(5
)
2.7%
(8
)
4.5%
(6
)
2011
7.6%
(6
)
1.3%
(9
)
3.8%
(6
)
2007
3.9%
(9
)
1.2%
(12
)
4.2%
(7
)
Pennsylvania Market
Foundation for growth with stable
commercial and retail banking base
providing ample deposits.
Home to distribution hubs for global retailers,
manufacturers and distributors serving
Northeast and Mid-Atlantic markets.
Delaware Valley Market
Includes Philadelphia and the state’s four
most-affluent counties.
4
Growth opportunities fueled by world-leading
education, health care and research
institutions.
Maryland Market
Includes Baltimore and four of the nation’s
45 most-affluent counties including no. 5,
Howard County.
4
Growth opportunities fueled by world-leading
education, health care and research
institutions, as well as major federal
agencies and contractors.
1
The 16 counties comprising the company’s Pennsylvania Market, the 10 counties comprising the
company’s Delaware Valley Market and the 13 counties comprising the company’s Maryland
Market are listed in the “Additional Materials” slides at the conclusion of this presentation
2
Company data as of 9/30/12. Percentages based on internal company commercial and retail
market allocations. Excludes leases and tax free loans and brokered and inter-company deposits.
3
FDIC June 30 deposit market share data as reported by SNL Financial for the counties comprising each of
the company’s three markets. 4
U.S. Census Bureau’s American Community Survey of median household income by county
th
th
th
th
th
th
th
th
th |
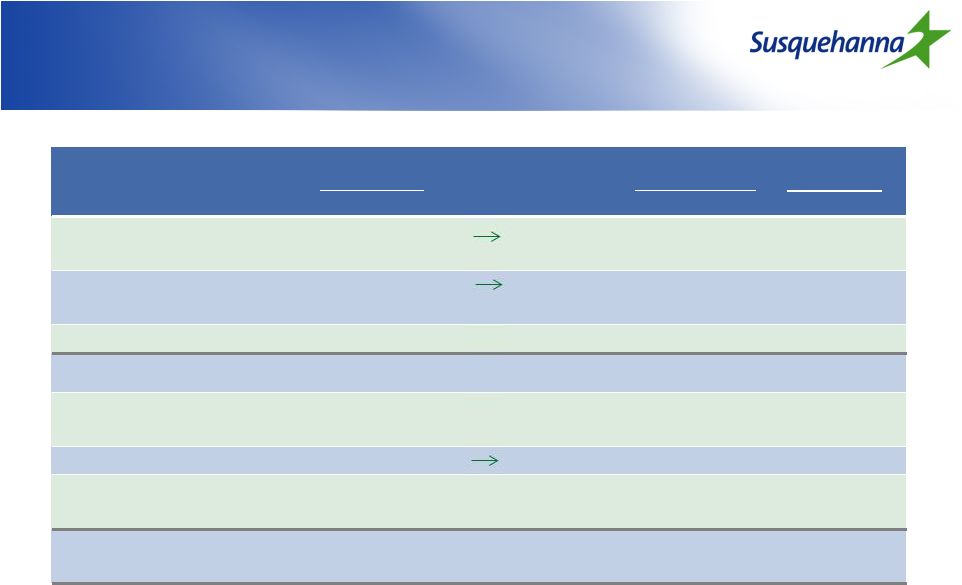 HOME MARKET:
METRO GROWTH MARKETS:
Central PA
5
Philadelphia
6
Baltimore
7
2007
Today
Today
Today
Total Deposits
$55.5 B
$65.3 B
18% Growth
$128.5 B
$63.0 B
in Current Market
1
SUSQ Deposits
$2.2 B
$5.9 B
170% Growth
$3.0 B
$1.2 B
Rank/Market Share
#9 / 3.9%
#5 / 9.0%
#8 / 2.4%
#7 / 1.9%
Primary Competitors
PNC, M&T, Fulton
TD, RBS,
PNC
M&T, PNC, BB&T
Median Household Income
$50,976
$58,051
$62,687
Estimated Household Income
19.7%
23.1%
22.8%
Growth from 2011-2016
2
Population
3.6 M
3.7 M
3.5% Growth
5.3 M
2.7 M
Estimated Population
3.1%
1.8%
2.3%
Growth from 2011-2016
3
# of Businesses with
135,105
222,902
102,402
< $10M in Sales
4
Market Growth and Opportunity
Market Growth and Opportunity
9
1
Source: FDIC Deposit Market Share Report
2
Source: SNL, ESRI. Household Income data reported for Philadelphia and
Baltimore metro markets represents Philadelphia-Camden-Wilmington and Baltimore-Towson MSAs, respectively
3
Source: SNL, ESRI
4
Source: The Nielsen Company
5
16 counties comprising Susquehanna’s Pennsylvania Market
6
Philadelphia Metro = Bucks, Burlington, Camden, Chester, Delaware, Gloucester,
Montgomery and Philadelphia counties 7
Baltimore Metro = Anne Arundel, Baltimore, Baltimore (City), Carroll, Harford and
Howard counties 2 |
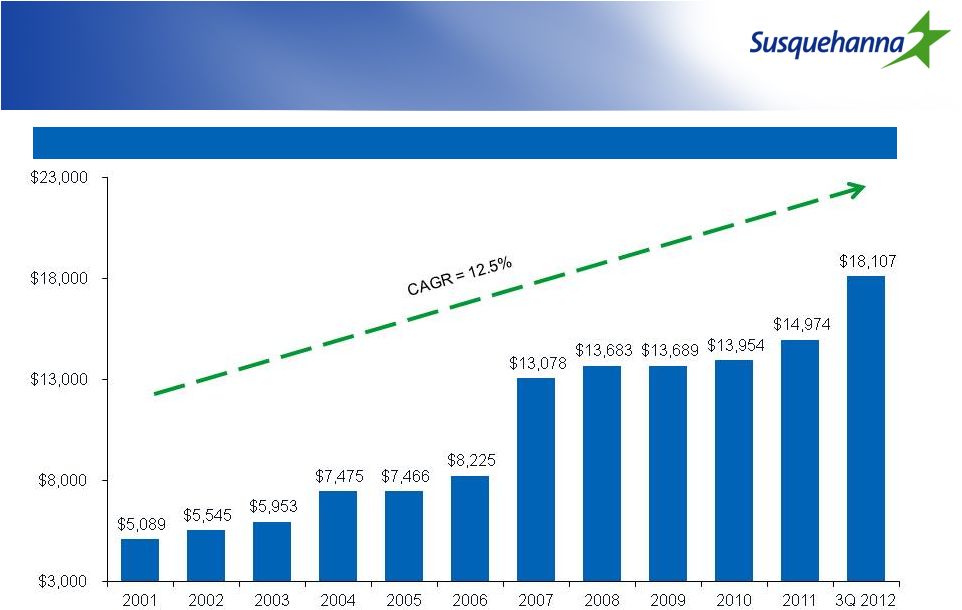 Organic Growth Supported by
Strategic Acquisitions
Organic Growth Supported by
Strategic Acquisitions
10
Assets ($ millions) |
 Deposit Composition
11
$8.9 Billion
$12.7 Billion
Total Deposits 12/31/2007
Total Deposits 9/30/2012
Successfully decreasing reliance on time deposit funding
Organic growth supported by acquisitions
Opportunity to further increase core deposits and manage deposit costs
Demand
Deposits,
14%
Interest-
bearing
demand,
32%
Savings,
8%
Time of
$100K or
more, 15%
Time <
$100K, 31%
Organic Core Deposit CAGR:
7.21%
Demand
Deposits,
15%
Interest-
bearing
demand,
45%
Savings,
8%
Time of
$100K or
more, 14%
Time <
$100K, 18% |
 Loan
Composition Loan Composition
12
$8.8 Billion
$12.7 Billion
Organic Loan CAGR:
4.93%
Total Loans 12/31/2007
Total Loans 9/30/2012
Decreased construction exposure
Organic and acquisitive growth
Opportunity to grow C&I and consumer loans |
 Asset
Quality Asset Quality
13 |
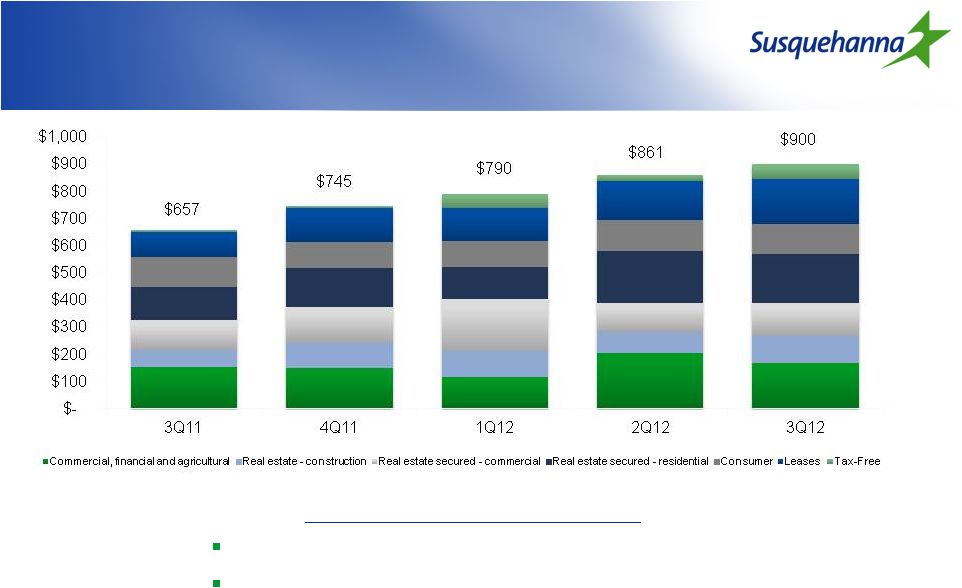 Quarterly Loan and Lease
Originations
($ in Millions)
Quarterly Loan and Lease
Originations
($ in Millions)
Loan and Lease Activity Trends
Continued origination growth with diverse mix
Overall loan originations are up 37% from 3Q 2011
14 |
 3rd Quarter 2012 Highlights
GAAP EPS of $0.20
•
Includes merger related expenses and loss on extinguishment of debt
Core deposit growth of 3.4%
Steady organic loan growth
•
Commercial loans increase 3.2%; Consumer loans increase 3.0%
•
Organic loan growth of 3.8% YOY
Efficiency ratio below 60%
Continued improvement in credit quality metrics
•
NPA’s declined to 1.16% of loans, leases and foreclosed real estate
•
Strong coverage ratio with allowance representing 158% of nonaccrual loans and
leases Increased dividend to $0.07 per share
•
Fifth dividend increase since 1Q2011
15 |
 Net
Income ($000s)
Net Income
($000s)
16 |
 Net
Interest Margin Net Interest Margin
17 |
 Efficiency Ratio*
18
*Efficiency ratio excludes net realized gain on acquisition, merger related expenses and loss on
extinguishment of debt. Please refer to the calculations on the slides titled
“Non-GAAP Reconciliation” at the conclusion of this presentation. |
 Capital Ratios
9/30/2012
Proposed
Minimum Basel III
Requirements¹
Management
Minimum
Targets
Tangible Common Equity²
7.84%
N/A
7.50%
Tier 1 Common/RWA
10.07%
7.00%
8.00%
Tier 1 Leverage
8.97%
4.00%
6.00%
Tier 1 Risk-Based
11.37%
8.50%
9.50%
Total Risk-Based
13.00%
10.50%
11.50%
Capital Planning Priorities
Support continued organic growth
Position for changing regulatory landscape
Increase quarterly cash dividends to shareholders
Consider strategic M&A opportunities
1
Including proposed conservation buffers
2
The tangible common equity ratio is a non-GAAP based financial measure.
Please refer to the calculations and management’s reasons for using this measure on the slide titled “Non-
GAAP
Reconciliation”
at
the
conclusion
of
this
presentation.
19 |
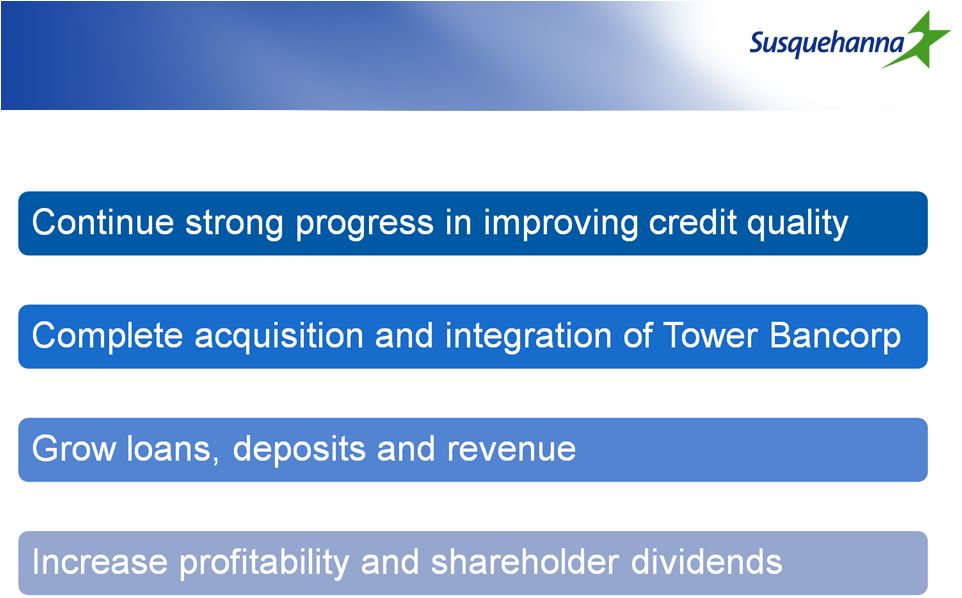 Strategic Objectives for 2012
20 |
 Shareholder Return
21
*
Return on average tangible equity is a non-GAAP based financial measure.
Please refer to the calculations and management’s reasons for using
this measure on the slide titled “Non-GAAP
Reconciliation”
at
the
conclusion
of
this
presentation.
Improving Results
Return on Average Tangible Equity* |
 Investment Merits
Attractive markets with opportunities for growth
•
Some of the best markets in the Mid-Atlantic region
Diverse loan portfolio with improving asset quality trends
Proven ability to operate efficiently
•
Target sub-60% efficiency ratio achieved in 3Q2012
Well positioned for organic and strategic growth
opportunities
Capacity to compete as a super-regional financial
company yet deliver community bank service
22 |
 Questions |
 Additional Materials |
 3
Quarter 2012 Financial Highlights
3
Quarter 2012 Financial Highlights
(Dollars in thousands, except earning per share data)
9/30/2012
6/30/2012
9/30/2011
Balance Sheet:
Loans and Leases
12,675,607
$
12,585,912
$
9,702,669
$
Deposits
12,725,379
$
12,690,524
$
9,558,631
$
Income Statement:
Net interest income
149,142
$
152,670
$
106,839
$
Pre-tax pre-provision income
69,893
$
71,006
$
42,894
$
Provision for loan and lease losses
16,000
$
16,000
$
25,000
$
GAAP Net Income
36,732
$
37,793
$
14,960
$
GAAP EPS
0.20
$
0.20
$
0.12
$
Quarterly Performance Highlights
25
rd |
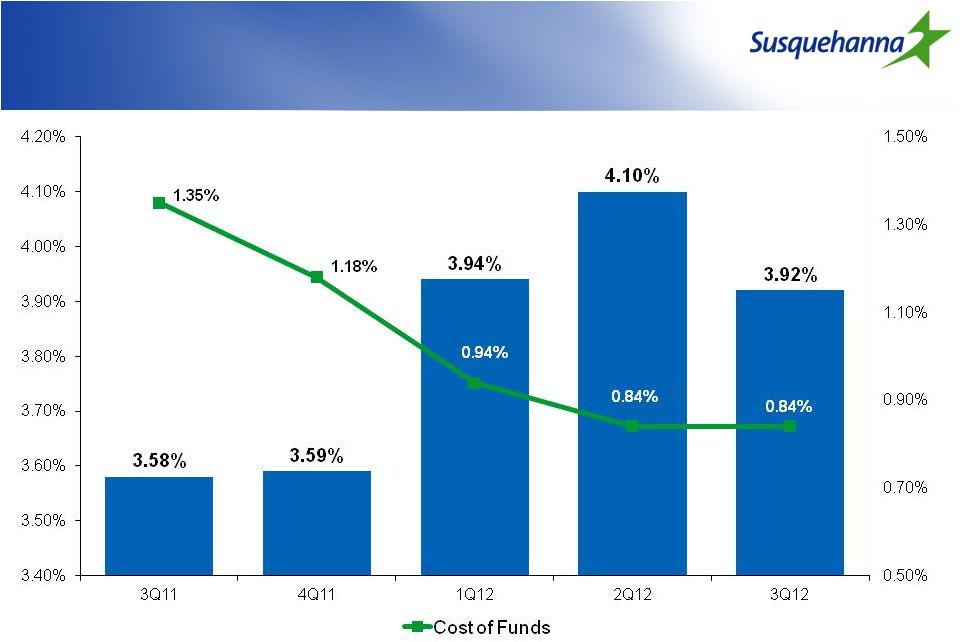
  Deposit
Mix & Cost by Product Deposit Mix & Cost by Product
$ in millions
Avg Bal QTR
INT % QTR
Demand
1,401
0.00%
1,528
0.00%
1,688
0.00%
1,922
0.00%
1,938
0.00%
Interest Bearing Demand
3,797
0.52%
4,394
0.49%
4,990
0.46%
5,480
0.39%
5,537
0.35%
Savings
797
0.14%
876
0.13%
930
0.14%
1,005
0.13%
1,003
0.11%
Certificates of Deposits
3,491
1.55%
3,503
1.29%
3,747
1.29%
4,065
1.13%
4,111
1.17%
Total Interest-Bearing Deposits
8,085
0.93%
8,773
0.77%
9,667
0.75%
10,550
0.65%
10,651
0.64%
Core Deposits/Total
Loans(excluding VIE)/Deposits
99.0%
1Q12
98.7%
67.0%
98.9%
3Q12
67.3%
98.8%
3Q11
4Q11
66.0%
63.2%
99.6%
2Q12
67.4%
26 |
 Borrowing Mix & Cost
27
$ in millions
Avg Bal QTR
INT % QTR (excludes SWAP expense)
Short-Term Borrowings
589
0.30%
0.27%
726 0.29%
0.28%
FHLB Advances
2.44%
0.21%
0.33%
0.35%
Long Term Debt
666
4.93%
5.11%
686 4.93%
4.85%
Total Borrowings
2,418
2.60%
1.66%
2,494 1.58%
1.62%
Off Balance Sheet Swap Impact
675
0.75%
0.74%
675 0.70%
0.69%
Total Borrowing Cost
Avg Borrowings / Avg Total
Assets
2.40%
2Q12
2.28%
14.0%
1Q12
3Q12
2.31%
14.1%
3Q11
4Q11
17.1%
15.8%
14.1%
3.35%
632
0.32%
1,115
2.90%
2,426
2.75%
675
0.76%
3.51%
642
985
2,301
675
4.78%
674
1,082
749
1,073
675
2,549
727
1,163
679 |
  Quarterly Loan and Lease
Originations
Quarterly Loan and Lease
Originations
Average
Balance*
($ in Millions)
Balance
Originations
Balance
Originations
Balance
Originations
Balance
Originations
Balance
Originations
Commercial
1,531
154
1,587
150
1,708
115
1,847
206
1,870
167
Real Estate - Const & Land
728
63
812
92
863
95
936
74
899
101
Real Estate - 1-4 Family Res
1,413
55
1,818
77
2,033
68
2,262
101
2,279
86
Real Estate - Commercial
3,264
108
3,348
132
3,872
191
4,350
110
4,315
121
Real Estate - HELOC
842
68
908
65
1,013
52
1,128
88
1,169
93
Tax-Free
317
7
330
7
346
53
379
22
390
55
Consumer Loans
685
109
709
97
736
96
764
116
794
110
Commercial Leases
285
51
282
82
287
76
306
79
299
81
Consumer Leases
380
42
370
43
367
43
376
65
424
86
VIE
201
-
193
-
187
-
180
-
173
-
Total
9,646
$
657
$
10,357
$
745
$
11,412
$
789
$
12,528
$
862
$
12,612
$
900
$
3Q12
2Q12
1Q12
4Q11
3Q11
28
*By collateral type |
   Loan
Mix & Yield Loan Mix & Yield
$ in millions
Avg Bal QTR*
INT % QTR
Commercial
1,531
5.38%
1,587
5.31%
1,708
5.24%
1,847
5.43%
1,870
5.31%
Real Estate - Const & Land
728
4.74%
812
4.95%
863
5.60%
936
5.66%
899
5.64%
Real Estate - 1-4 Family Res
1,413
5.81%
1,818
5.22%
2,033
5.27%
2,262
5.26%
2,279
5.03%
Real Estate - Commercial
3,264
5.47%
3,348
5.45%
3,872
5.46%
4,350
5.78%
4,315
5.60%
Real Estate - HELOC
842
3.60%
908
3.83%
1,013
3.98%
1,128
3.81%
1,169
3.82%
Tax-Free
317
6.06%
330
5.11%
346
5.60%
379
5.45%
390
5.40%
Consumer Loans
685
5.61%
709
5.48%
736
5.33%
764
5.21%
794
5.02%
Commercial Leases
285
7.92%
282
7.90%
287
7.98%
306
7.72%
299
7.48%
Consumer Leases
380
4.90%
370
4.75%
367
4.73%
376
4.60%
424
4.30%
VIE
201
4.58%
193
4.54%
187
4.47%
180
4.46%
173
4.42%
Total Loans
9,646
5.34%
10,357
5.22%
11,412
5.29%
5.33%
5.23%
3Q12
2Q12
1Q12
3Q11
4Q11
29
*By collateral type
12,528
12,612 |
 CRE
and Construction Composition CRE and Construction Composition
30 |
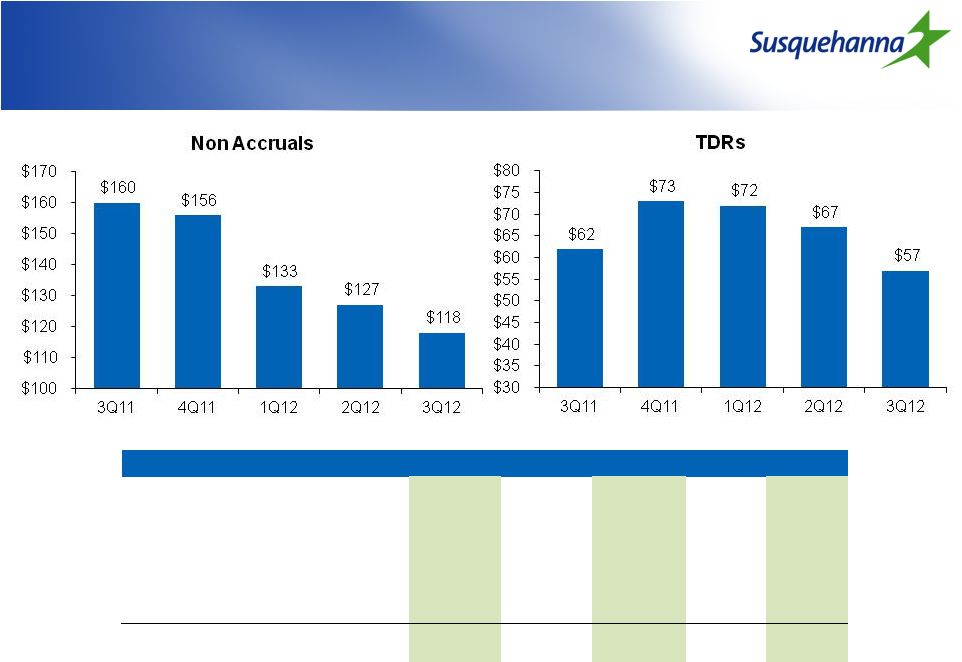 Asset
Quality ($ in Millions)
Asset Quality
($ in Millions)
($ in million)
3Q11
4Q11
1Q12
2Q12
3Q12
NPL's Beginning of Period
190.7
$
160.1
$
156.5
$
133.5
$
127.3
$
New NonAccruals
20.4
$
43.8
$
22.3
$
34.5
$
17.3
$
Cure/Exits/Other
(27.4)
$
(10.1)
$
(28.8)
$
(16.8)
$
(6.2)
$
Gross Charge-Offs
(16.2)
$
(25.6)
$
(11.0)
$
(17.3)
$
(15.8)
$
Transfer to OREO
(7.5)
$
(11.7)
$
(5.5)
$
(6.6)
$
(4.2)
$
NPL's End of Period
160.0
$
156.5
$
133.5
$
127.3
$
118.4
$
31 |
 Asset
Quality ($ in Millions)
Asset Quality
($ in Millions)
32
*Legacy Susquehanna |
  Investment Securities
$ in millions
EOP Balance
QTR Yield
Total Investment Securities
$2,691
$2,423
$2,757
$2,866
$2,908
Duration (years)
3.6
3.5
3.6
3.6
3.6
Yield
3.32%
3.02%
3.09%
2.92%
2.69%
Unrealized Gain/(Loss)
$42.0
$32.3
$30.8
$40.8
$61.9
3Q12
2Q12
3Q11
4Q11
1Q12
33 |
 Earnings Drivers
($000)
3Q11
4Q11
1Q12
2Q12
3Q12
Avg. interest-earning assets
12,275,793
13,128,969
14,065,583
15,332,806
15,537,037
Net interest margin (FTE)
3.58%
3.59%
3.94%
4.10%
3.92%
Net interest income
106,839
115,201
134,123
152,670
149,142
Noninterest income
36,800
32,204*
39,515
39,811
43,661
Total revenue
143,639
147,405
173,638
192,481
192,803
Noninterest expense
99,452*
100,164*
108,876*
118,157*
115,959*
Pre-tax, pre-provision income
44,187*
47,241*
64,762*
74,324*
76,844*
Provision for loan losses
25,000
22,000
19,000
16,000
16,000
Pre-tax income
19,187*
25,241*
45,762*
58,324*
60,844*
* Core: Excludes merger-related expenses, net gain on acquisition and loss on
extinguishment of debt 2012 Financial Targets
FTE margin
3.98%
Loan growth
23%
Deposit growth
24%
Non-interest income growth
-10%
Non-interest expense growth
0%
Tax rate
31%
reported
numbers
and
not
core
numbers.
These
percentages
do
not
include
any
one-time
merger-related costs or loss on extinguishment of debt in 2012.
34
The growth percentages included in these financial targets are based upon
2011 Note
: |
 Susquehanna Bank Markets
35
Pennsylvania Market:
Adams, PA
Berks, PA
Centre, PA
Cumberland, PA
Dauphin, PA
Lancaster, PA
Lebanon, PA
Lehigh, PA
Luzerne, PA
Lycoming, PA
Northampton, PA
Northumberland, PA
Schuylkill, PA
Snyder, PA
Union, PA
York, PA
Maryland Market:
Allegany, MD
Anne Arundel, MD
Baltimore, MD
Baltimore City, MD
Bedford, PA
Berkley, WV
Carroll, MD
Franklin, PA
Fulton, PA
Garrett, MD
Hartford, MD
Howard, MD
Washington, MD
Delaware Valley Market:
Atlantic, NJ
Bucks, PA
Burlington, NJ
Camden, NJ
Chester, PA
Cumberland, NJ
Delaware, PA
Gloucester, NJ
Montgomery, PA
Philadelphia, PA |
 Non-GAAP Reconciliation
(Dollars and share data in thousands)
Non-GAAP Reconciliation
(Dollars and share data in thousands)
36
The efficiency ratio is a non-GAAP based financial measure. Management
excludes merger-related expenses and certain other selected items when calculating this ratio,
which is used to measure the relationship of operating expenses to revenues.
Tangible Common Ratio
3Q12
2Q12
1Q12
4Q11
3Q11
End of period balance sheet data
Shareholders' equity
2,584,682
$
2,544,730
$
2,512,584
$
2,189,628
$
2,035,845
$
Goodwill and other intangible assets
(1)
(1,263,361)
(1,267,630)
(1,268,582)
(1,006,412)
(1,005,368)
Tangible common equity (numerator)
1,321,321
$
1,277,100
$
1,244,002
$
1,183,216
$
1,030,477
$
Assets
18,106,730
$
18,040,009
$
17,807,026
$
14,974,789
$
14,365,229
$
Goodwill and other intangible assets
(1)
(1,263,361)
(1,267,630)
(1,268,582)
(1,047,112)
(1,045,692)
Tangible assets (denominator)
16,843,369
$
16,772,379
$
16,538,444
$
13,927,677
$
13,319,537
$
Tangible common ratio
7.84%
7.61%
7.52%
8.50%
7.74%
(1)
Net of applicable deferred income taxes
3Q12
2Q12
1Q12
4Q11
3Q11
Efficiency Ratio
Other expense
122,910
$
121,475
$
120,355
$
162,395
$
100,745
$
Less: Merger related expenses
(1,500)
(3,318)
(11,479)
(12,211)
(1,293)
Loss on extinguishment of debt
(5,451)
0
0
(50,020)
0
Noninterest operating expense (numerator)
115,959
$
118,157
$
108,876
$
100,164
$
99,452
$
Taxable-equivalent net interest income
152,948
$
156,416
137,837
118,780
110,668
Other income
43,661
39,811
39,515
71,347
36,800
Less: Net realized gain on acquisition
0
0
0
(39,143)
0
Denominator
196,609
$
196,227
$
177,352
$
150,984
$
147,468
$
Efficiency ratio
58.98%
60.21%
61.39%
66.34%
67.44%
The tangible common ratio is a non-GAAP based financial measure using non-GAAP based
amounts. The most directly comparable GAAP-based measure is the ratio of common
shareholders’ equity to total assets. In order to calculate tangible common shareholders equity and assets, our management subtracts the
intangible assets from both the common shareholders’ equity and total assts. Tangible
common equity is then divided by the tangible assets to arrive at the ratio. Management
uses the ratio to assess the strength of our capital position. |
 Non-GAAP Reconciliation
(Dollars and share data in thousands)
Non-GAAP Reconciliation
(Dollars and share data in thousands)
37
Income statement data
Net income
36,732
$
37,793
$
23,473
$
19,129
$
14,960
$
Amortization of intangibles, net of taxes at 35%
2,169
2,211
1,789
1,489
1,377
Net tangible income (numerator)
38,901
$
40,004
$
25,262
$
20,618
$
16,337
$
Average balance sheet data
Shareholders' equity
2,562,092
$
2,537,250
$
2,348,326
$
2,217,036
$
2,019,706
$
Goodwill and other intangible assets
(1,315,071)
(1,320,658)
(1,132,344)
(1,045,580)
(1,046,719)
Tangible common equity (denominator)
1,247,021
$
1,216,592
$
1,215,982
$
1,171,456
$
972,987
$
Return on equity (GAAP basis)
5.70%
5.99%
4.02%
3.42%
2.94%
Effect of goodwill and other intangibles
6.71%
7.24%
4.34%
3.56%
3.72%
12.41%
13.23%
8.36%
6.98%
6.66%
3Q12
2Q12
1Q12
4Q11
3Q11
Return
on
Average
Tangible
Shareholders’
Equity
Return on average tangible shareholders' equity
Return on average tangible shareholders’ equity is a non-GAAP based financial measure
calculated using non-GAAP based amounts. The most directly comparable GAAP-based
measure is return on average equity. We calculate return on average tangible shareholders’ equity by excluding the balance of
intangible assets and their related amortization expense from our calculation of return on average
equity. Management uses the return on average tangible equity in order to review our core
operating results. Management believes that this is a better measure of our performance. In addition, this is consistent with the
treatment by bank regulatory agencies, which excludes goodwill and other intangible assets from the
calculation of risk-based capital ratios. |