Attached files
| file | filename |
|---|---|
| 8-K - CURRENT REPORT - ASTORIA FINANCIAL CORP | v327305_8k.htm |
Investor Presentation Third Quarter Ended September 30, 2012 Long Island’s Premier Community Bank ASTORIA FINANCIAL CORPORATION
Forward Looking Statement This presentation may contain a number of forward - looking statements within the meaning of Section 27 A of the Securities Act of 1933 , as amended, and Section 21 E of the Securities Exchange Act of 1934 , as amended . These statements may be identified by the use of the words “anticipate,” “believe,” “could,” “estimate,” “expect,” “intend,” “may,” “outlook,” “plan,” “potential,” “predict,” “project,” “should,” “will,” “would,” and similar terms and phrases, including references to assumptions . Forward - looking statements are based on various assumptions and analyses made by us in light of our management’s experience and perception of historical trends, current conditions and expected future developments, as well as other factors we believe are appropriate under the circumstances . These statements are not guarantees of future performance and are subject to risks, uncertainties and other factors (many of which are beyond our control) that could cause actual results to differ materially from future results expressed or implied by such forward - looking statements . These factors include, without limitation, the following : the timing and occurrence or non - occurrence of events may be subject to circumstances beyond our control ; there may be increases in competitive pressure among financial institutions or from non - financial institutions ; changes in the interest rate environment may reduce interest margins or affect the value of our investments ; changes in deposit flows, loan demand or real estate values may adversely affect our business ; changes in accounting principles, policies or guidelines may cause our financial condition to be perceived differently ; general economic conditions, either nationally or locally in some or all areas in which we do business, or conditions in the real estate or securities markets or the banking industry may be less favorable than we currently anticipate ; legislative or regulatory changes, including the implementation of the Dodd - Frank Wall Street Reform and Consumer Protection Act of 2010 and any actions regarding foreclosures, may adversely affect our business ; transition of our regulatory supervisor from the Office of Thrift Supervision to the Office of the Comptroller of the Currency and the Board of Governors of the Federal Reserve Board, or FRB ; effects of changes in existing U . S . government or government - sponsored mortgage programs ; technological changes may be more difficult or expensive than we anticipate ; success or consummation of new business initiatives may be more difficult or expensive than we anticipate ; or litigation or other matters before regulatory agencies, whether currently existing or commencing in the future, may be determined adverse to us or may delay occurrence or non - occurrence of events longer than we anticipate . We have no obligation to update any forward - looking statements to reflect events or circumstances after the date of this document .
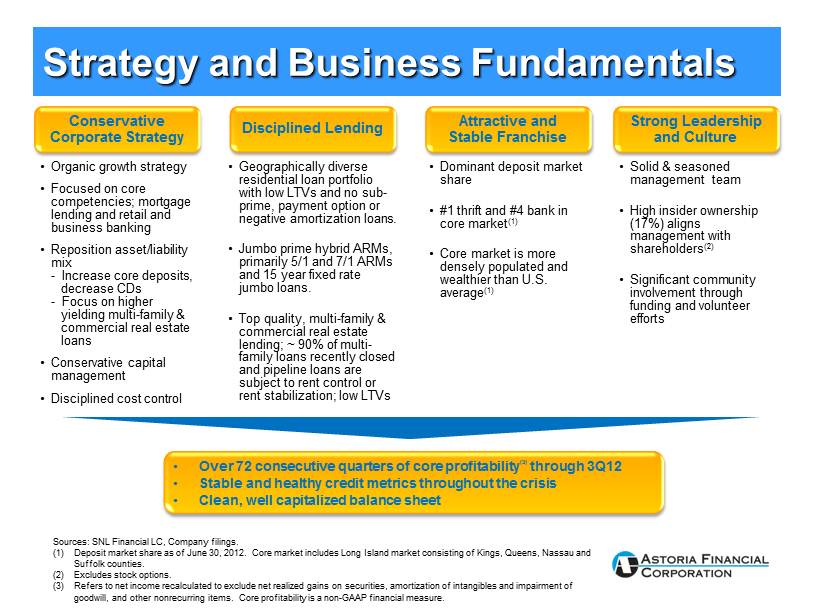
Strategy and Business Fundamentals Conservative Corporate Strategy • Organic growth strategy • Focused on core competencies; mortgage lending and retail and business banking • Reposition asset/liability mix - Increase core deposits, decrease CDs - Focus on higher yielding multi - family & commercial real estate loans • Conservative capital management • Disciplined cost contro l Disciplined Lending • Geographically diverse residential loan portfolio with low LTVs and no sub - prime, payment option or negative amortization loans. • Jumbo prime hybrid ARMs, primarily 5/1 and 7/1 ARMs and 15 year fixed rate jumbo loans. • Top quality, multi - family & commercial real estate lending; ~ 90% of multi - family loans recently closed and pipeline loans are subject to rent control or rent stabilization; low LTVs Attractive and Stable Franchise • Dominant deposit market share • #1 thrift and #4 bank in core market (1) • Core market is more densely populated and wealthier than U.S. average (1) Strong Leadership and Culture • Solid & seasoned management team • High insider ownership (17%) aligns management with shareholders (2) • Significant community involvement through funding and volunteer efforts • Over 72 consecutive quarters of core profitability (3) through 3Q12 • Stable and healthy credit metrics throughout the crisis • Clean, well capitalized balance sheet Sources: SNL Financial LC, Company filings. (1) Deposit market share as of June 30, 2012. Core market includes Long Island market consisting of Kings, Queens, Nassau and Suffolk counties. (2) Excludes stock options. (3) Refers to net income recalculated to exclude net realized gains on securities, amortization of intangibles and impairment of goodwill, and other nonrecurring items. Core profitability is a non - GAAP financial measure .
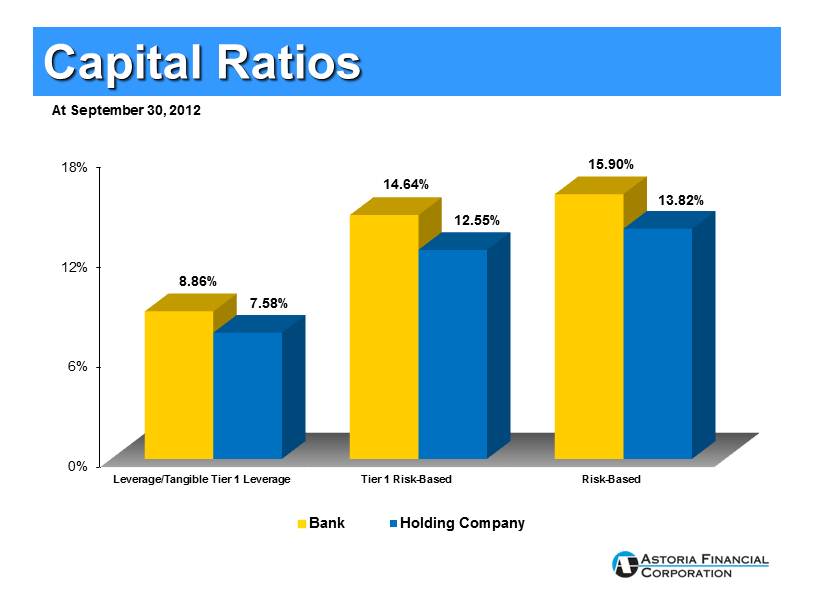
Capital Ratios 0% 6% 12% 18% Leverage/Tangible Tier 1 Leverage Tier 1 Risk-Based Risk-Based 8.86% 14.64% 15.90% 7.58% 12.55% 13.82% Bank Holding Company At September 30, 2012
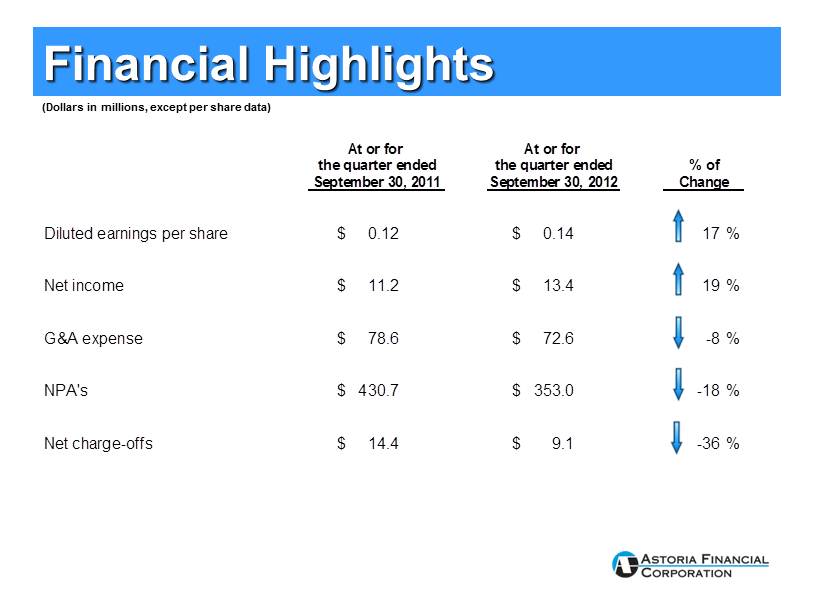
Financial Highlights At or for At or for % of Change Diluted earnings per share $ 0.12 $ 0.14 17% Net income $ 11.2 $ 13.4 19% G&A expense $ 78.6 $ 72.6 -8% NPA's $ 430.7 $ 353.0 -18% Net charge-offs $ 14.4 $ 9.1 -36% September 30, 2011 September 30, 2012 the quarter ended the quarter ended (Dollars in millions, except per share data)
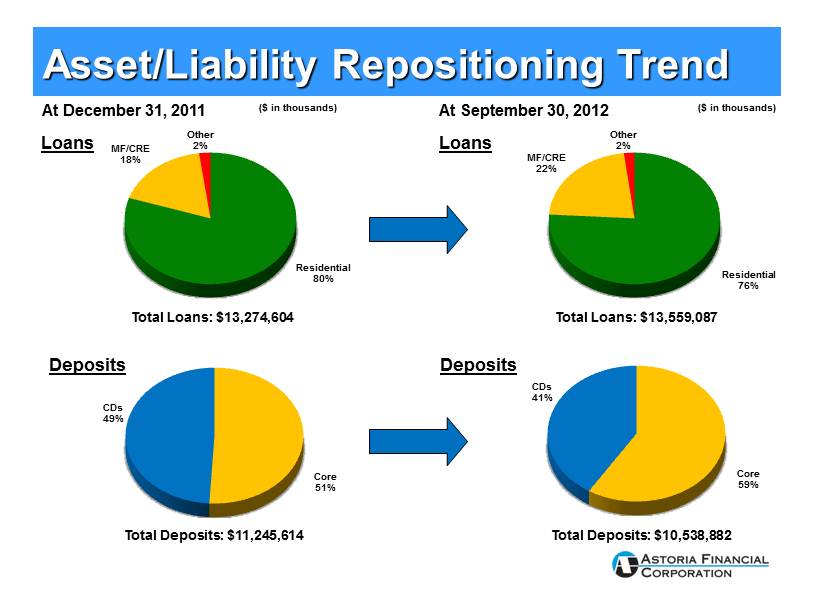
At December 31, 2011 Loans Loans At September 30, 2012 ($ in thousands) ($ in thousands) Asset/Liability Repositioning Trend Deposits Deposits Residential 80% MF/CRE 18% Other 2% Residential 76% MF/CRE 22% Other 2% Total Loans: $13,274,604 Core 51% CDs 49% Total Loans: $13,559,087 Core 59% CDs 41% Total Deposits: $11,245,614 Total Deposits: $10,538,882
Core Competency • Mortgage Lending ─ Multi - family and CRE lending expertise ─ Residential lending expertise ─ Solid asset quality • Retail Banking ─ Premier community bank on Long Island ─ Dominant deposit market share ─ #1 thrift depository in core market, #4 among all banks
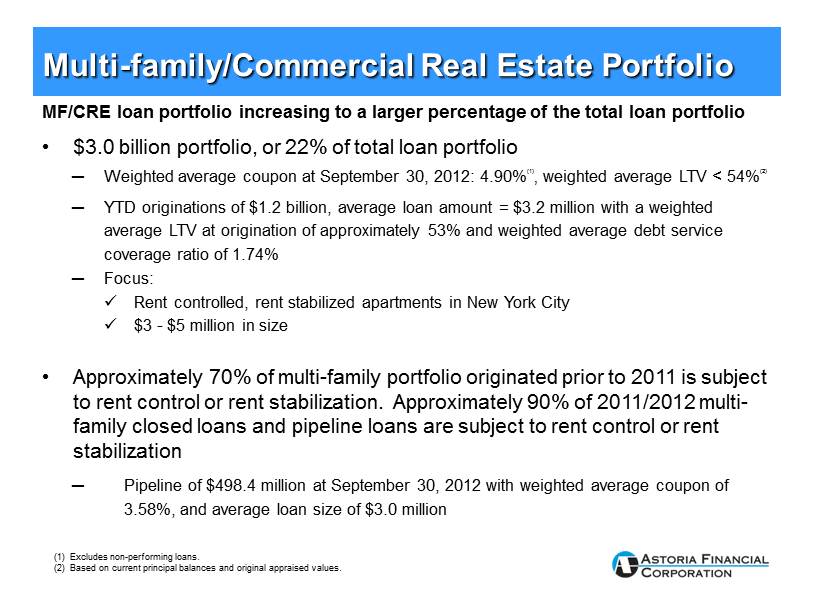
Multi - family/Commercial Real Estate Portfolio • $3.0 billion portfolio, or 22% of total loan portfolio ─ Weighted average coupon at September 30, 2012: 4.90% (1) , weighted average LTV < 54% (2) ─ YTD originations of $1.2 billion, average loan amount = $3.2 million with a weighted average LTV at origination of approximately 53% and weighted average debt service coverage ratio of 1.74% ─ Focus: x Rent controlled, rent stabilized apartments in New York City x $3 - $5 million in size • Approximately 70% of multi - family portfolio originated prior to 2011 is subject to rent control or rent stabilization. Approximately 90% of 2011/2012 multi - family closed loans and pipeline loans are subject to rent control or rent stabilization ─ Pipeline of $498.4 million at September 30, 2012 with weighted average coupon of 3.58%, and average loan size of $3.0 million (1) Excludes non - performing loans. (2) Based on current principal balances and original appraised values. MF/CRE loan portfolio increasing to a larger percentage of the total loan portfolio
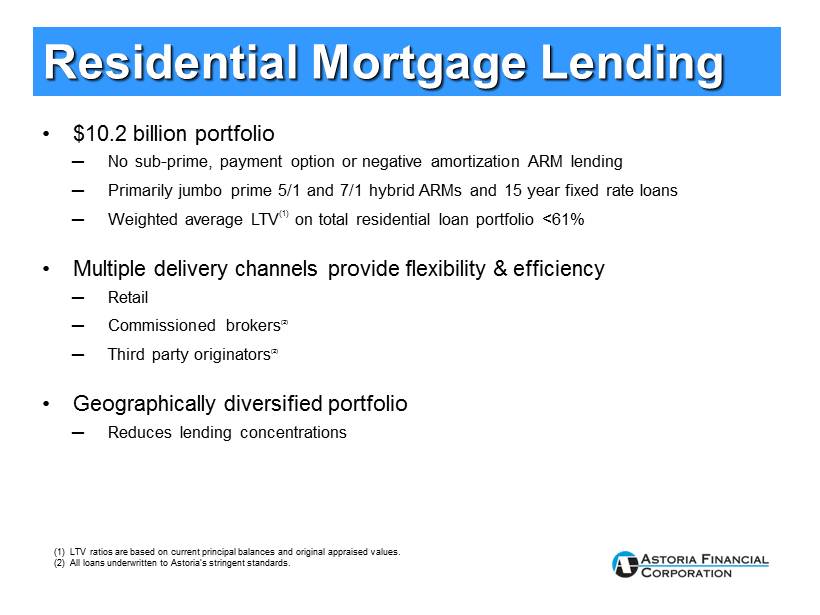
Residential Mortgage Lending • $10.2 billion portfolio ─ No sub - prime, payment option or negative amortization ARM lending ─ Primarily jumbo prime 5/1 and 7/1 hybrid ARMs and 15 year fixed rate loans ─ Weighted average LTV (1) on total residential loan portfolio <61% • Multiple delivery channels provide flexibility & efficiency ─ Retail ─ Commissioned brokers (2) ─ Third party originators (2) • Geographically diversified portfolio ─ Reduces lending concentrations (1) LTV ratios are based on current principal balances and original appraised values. (2) All loans underwritten to Astoria’s stringent standards .
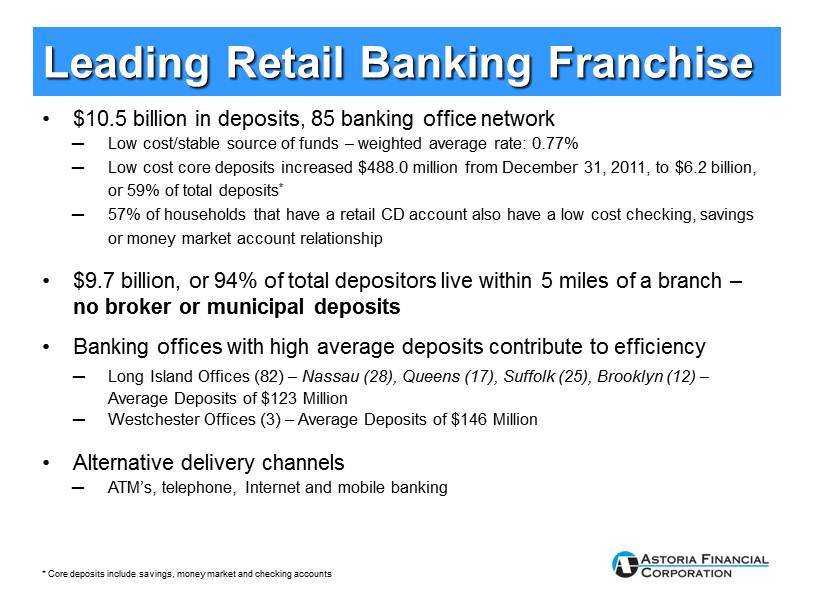
Leading Retail Banking Franchise • $10.5 billion in deposits, 85 banking office network ─ Low cost/stable source of funds – weighted average rate: 0.77% ─ L ow cost core deposits increased $488.0 million from December 31, 2011, to $6.2 billion, or 59% of total deposits * ─ 57% of households that have a retail CD account also have a low cost checking, savings or money market account relationship • $9.7 billion, or 94% of total depositors live within 5 miles of a branch – no broker or municipal deposits • Banking offices with high average deposits contribute to efficiency ─ Long Island Offices (82) – Nassau (28), Queens (17), Suffolk (25), Brooklyn (12) – Average Deposits of $123 Million ─ Westchester Offices (3) – Average Deposits of $146 Million • Alternative delivery channels ─ ATM’s, telephone, Internet and mobile banking * Core deposits include savings, money market and checking accounts
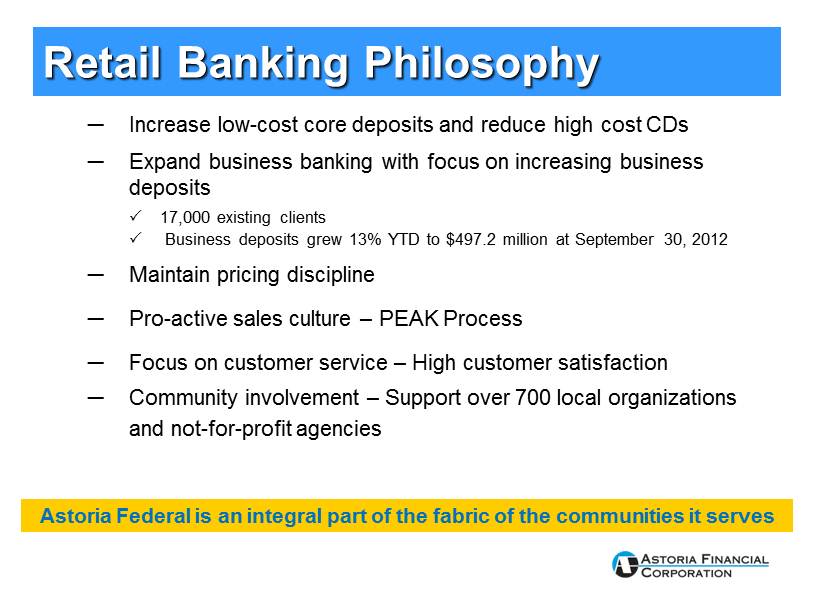
Retail Banking Philosophy ─ Increase low - cost core deposits and reduce high cost CDs ─ Expand business banking with focus on increasing business deposits 17,000 existing clients Business deposits grew 13 % YTD to $497.2 million at September 30, 2012 ─ Maintain pricing discipline ─ Pro - active sales culture – PEAK Process ─ Focus on customer service – High customer satisfaction ─ Community involvement – Support over 700 local organizations and not - for - profit agencies Astoria Federal is an integral part of the fabric of the communities it serves
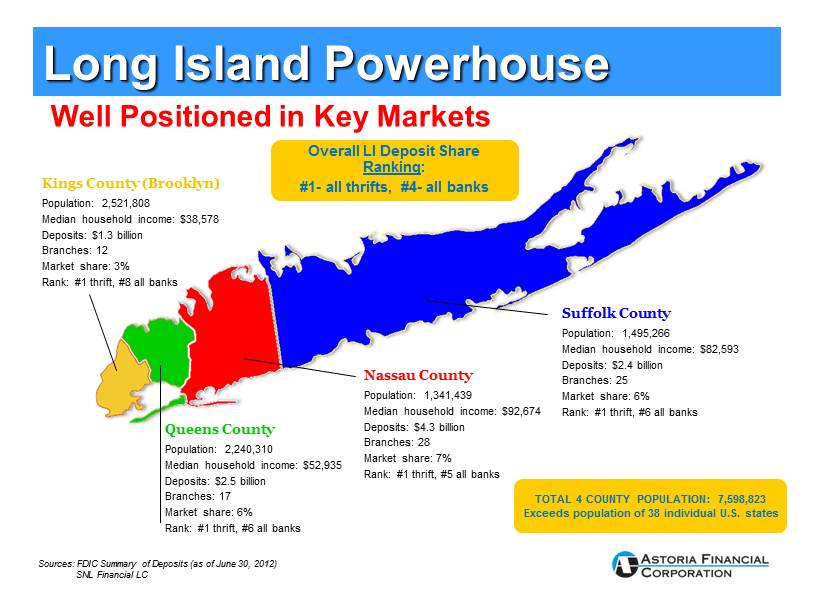
TOTAL 4 COUNTY POPULATION: 7,598,823 Exceeds population of 38 individual U.S. states Overall LI Deposit Share Ranking : #1 - all thrifts, #4 - all banks Sources: FDIC Summary of Deposits (as of June 30, 2012) SNL Financial LC Kings County (Brooklyn) Population: 2,521,808 Median household income: $38,578 Deposits: $1.3 billion Branches: 12 Market share: 3% Rank: #1 thrift, #8 all banks Queens County Population: 2,240,310 Median household income: $52,935 Deposits: $ 2.5 billion Branches: 17 Market share: 6% Rank: #1 thrift, #6 all banks Nassau County Population: 1,341,439 Median household income: $92,674 Deposits: $ 4.3 billion Branches: 28 Market share: 7% Rank: #1 thrift, #5 all banks Suffolk County Population: 1,495,266 Median household income: $82,593 Deposits: $ 2.4 billion Branches: 25 Market share: 6% Rank: #1 thrift, #6 all banks Well Positioned in Key Markets Long Island Powerhouse
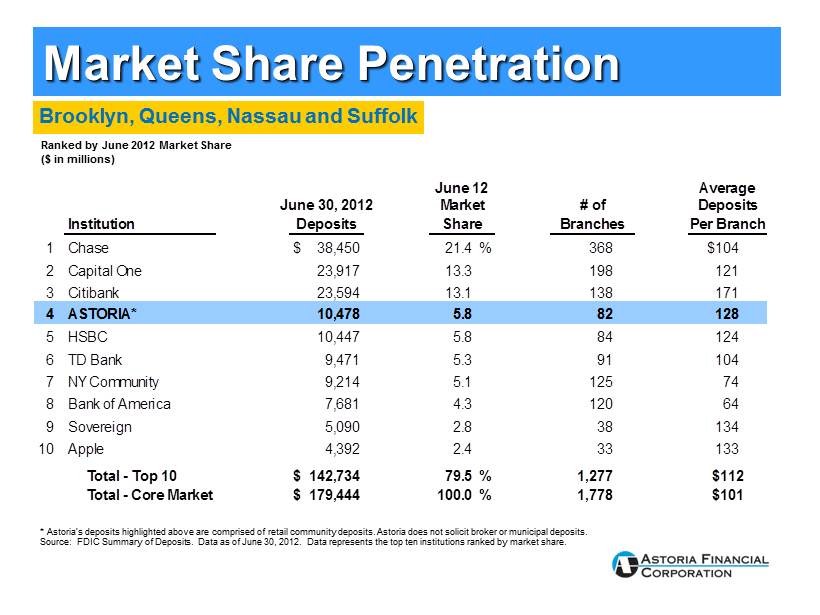
Brooklyn, Queens, Nassau and Suffolk June 12 Average June 30, 2012 Market # of Deposits Institution Deposits Share Branches Per Branch 1 Chase $ 38,450 21.4% 368 $104 2 Capital One 23,917 13.3 198 121 3 Citibank 23,594 13.1 138 171 4 ASTORIA* 10,478 5.8 82 128 5 HSBC 10,447 5.8 84 124 6 TD Bank 9,471 5.3 91 104 7 NY Community 9,214 5.1 125 74 8 Bank of America 7,681 4.3 120 64 9 Sovereign 5,090 2.8 38 134 10 Apple 4,392 2.4 33 133 Total - Top 10 $ 142,734 79.5% 1,277 $112 Total - Core Market $ 179,444 100.0% 1,778 $101 Ranked by June 2012 Market Share ($ in millions) * Astoria’s deposits highlighted above are comprised of retail community deposits. Astoria does not solicit broker or municipal de posits. Source: FDIC Summary of Deposits. Data as of June 30, 2012. Data represents the top ten i nstitutions ranked by market share. Market Share Penetration
• Operating Efficiency • Credit • Interest Rate Risk • Margin • Growth Current Focus
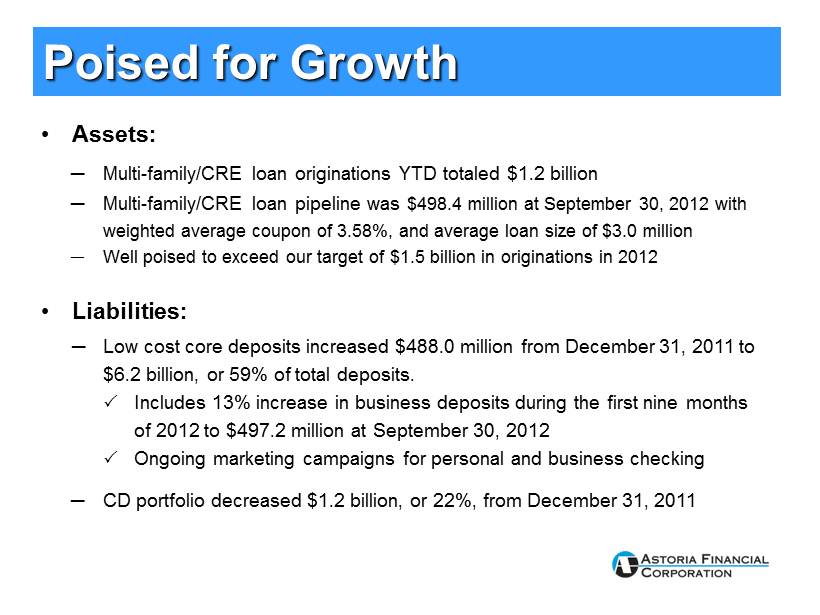
Poised for Growth • Assets: ─ Multi - family/CRE loan originations YTD totaled $1.2 billion ─ Multi - family/CRE loan pipeline was $498.4 million at September 30, 2012 with weighted average coupon of 3.58%, and average loan size of $3.0 million ─ Well poised to exceed our target of $1.5 billion in originations in 2012 • Liabilities: ─ Low cost core deposits increased $488.0 million from December 31, 2011 to $6.2 billion, or 59% of total deposits. Includes 13% increase in business deposits during the first nine months of 2012 to $497.2 million at September 30, 2012 Ongoing marketing campaigns for personal and business checking ─ CD portfolio decreased $1.2 billion, or 22%, from December 31, 2011
Current Focus • Growth • Credit • Interest Rate Risk • Margin • Operating Efficiency
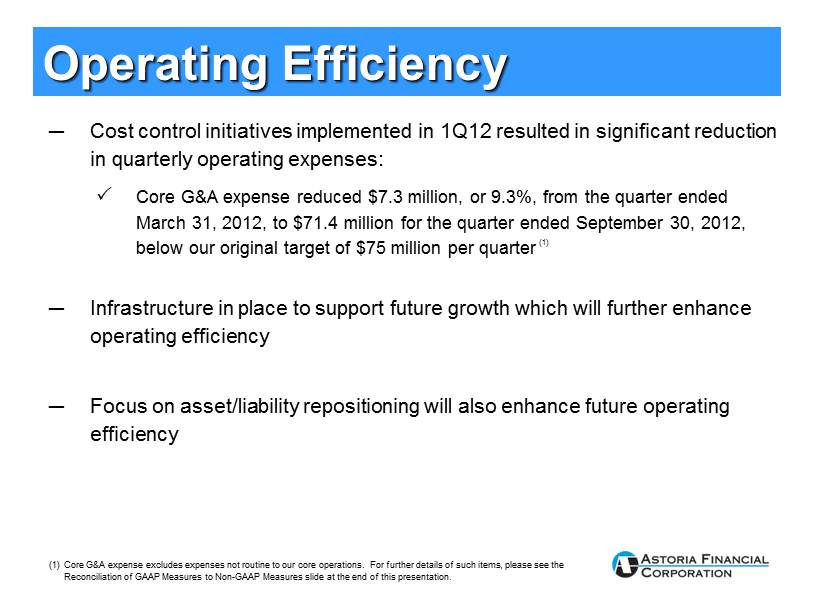
Operating Efficiency ─ Cost control initiatives implemented in 1Q12 resulted in significant reduction in quarterly operating expenses: Core G&A expense reduced $7.3 million, or 9.3%, from the quarter ended March 31, 2012, to $71.4 million for the quarter ended September 30, 2012, below our original target of $75 million per quarter (1) ─ Infrastructure in place to support future growth which will further enhance operating efficiency ─ Focus on asset/liability repositioning will also enhance future operating efficiency (1) Core G&A expense excludes expenses not routine to our core operations. For further details of such items, please see the Reconciliation of GAAP Measures to Non - GAAP Measures slide at the end of this presentation.
Current Focus • Growth • Operating Efficiency • Credit • Interest Rate Risk • Margin • Credit
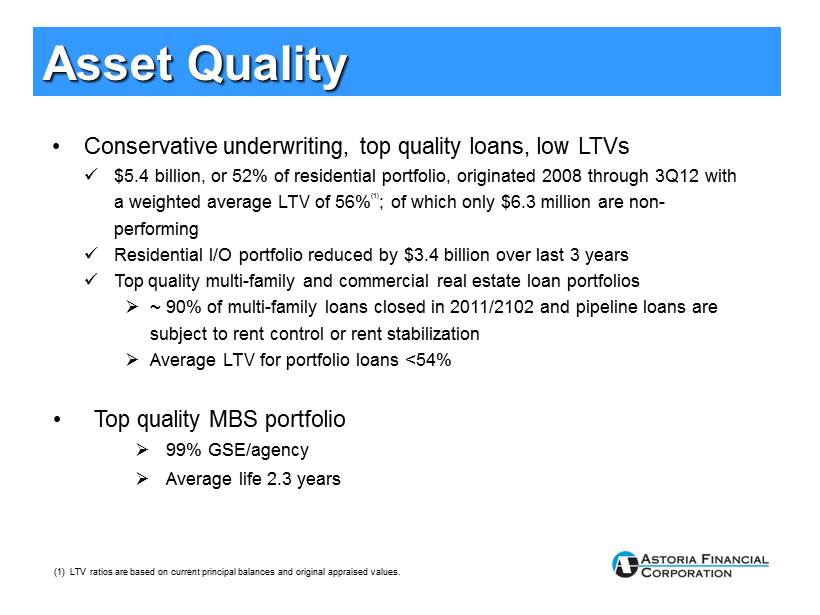
Asset Quality • Conservative underwriting, top quality loans, low LTVs x $5.4 billion, or 52% of residential portfolio, originated 2008 through 3Q12 with a weighted average LTV of 56% ( 1) ; of which only $6.3 million are non - performing x Residential I/O portfolio reduced by $3.4 billion over last 3 years x Top quality multi - family and commercial real estate loan portfolios » ~ 90% of multi - family loans closed in 2011/2102 and pipeline loans are subject to rent control or rent stabilization » Average LTV for portfolio loans <54% • Top quality MBS portfolio » 99% GSE/agency » Average life 2.3 years (1) LTV ratios are based on current principal balances and original appraised values .
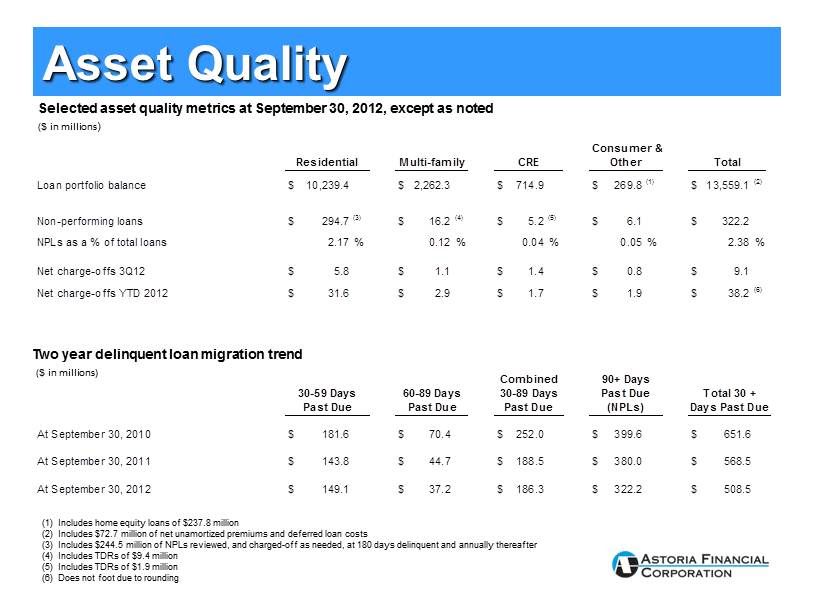
Asset Quality (1) Includes home equity loans of $237.8 million (2) Includes $72.7 million of net unamortized premiums and deferred loan costs (3) Includes $244.5 million of NPLs reviewed, and charged - off as needed, at 180 days delinquent and annually thereafter (4) Includes TDRs of $9.4 million (5) Includes TDRs of $1.9 million (6) Does not foot due to rounding Consumer & Multi-family Loan portfolio balance $ 10,239.4 $ 2,262.3 $ 714.9 $ 269.8 (1) $ 13,559.1 (2) Non-performing loans $ 294.7 (3) $ 16.2 (4) $ 5.2 (5) $ 6.1 $ 322.2 NPLs as a % of total loans 2.17% 0.12% 0.04% 0.05% 2.38% Net charge-offs 3Q12 $ 5.8 $ 1.1 $ 1.4 $ 0.8 $ 9.1 Net charge-offs YTD 2012 $ 31.6 $ 2.9 $ 1.7 $ 1.9 $ 38.2 (6) Other Residential TotalCRE At September 30, 2010 $ 181.6 $ 70.4 $ 252.0 $ 399.6 $ 651.6 At September 30, 2011 $ 143.8 $ 44.7 $ 188.5 $ 380.0 $ 568.5 At September 30, 2012 $ 149.1 $ 37.2 $ 186.3 $ 322.2 $ 508.5 30-59 Days Past Due Days Past DuePast Due 60-89 Days Past Due 90+ Days Past Due30-89 Days Combined Total 30 + (NPLs) Selected asset quality metrics at September 30, 2012, except as noted ($ in millions ) Two year delinquent loan migration trend ($ in millions)
Current Focus • Growth • Operating Efficiency • Credit • Margin • Interest Rate Risk
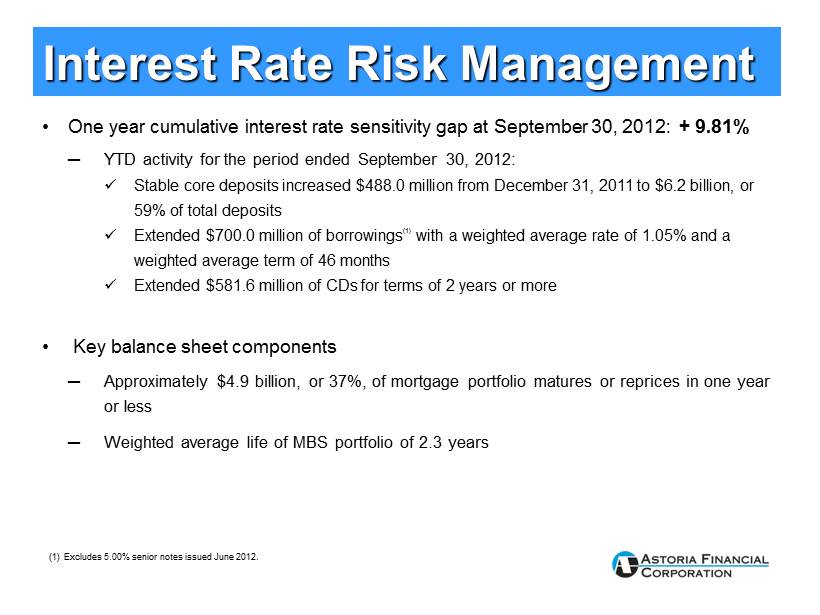
• One year cumulative interest rate sensitivity gap at September 30, 2012: + 9.81% ─ YTD activity for the period ended September 30, 2012: x Stable core deposits increased $488.0 million from December 31, 2011 to $6.2 billion, or 59% of total deposits x Extended $700.0 million of borrowings (1) with a weighted average rate of 1.05% and a weighted average term of 46 months x Extended $581.6 million of CDs for terms of 2 years or more • Key balance sheet components ─ Approximately $4.9 billion, or 37%, of mortgage portfolio matures or reprices in one year or less ─ Weighted average life of MBS portfolio of 2.3 years Interest Rate Risk Management (1) Excludes 5.00% senior notes issued June 2012.
• Growth • Operating Efficiency • Credit • Interest Rate Risk • Margin Current Focus
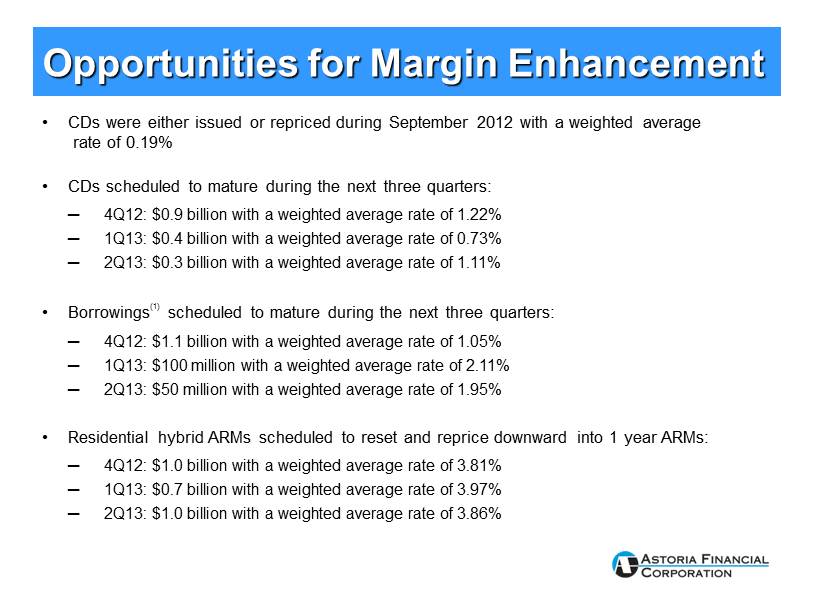
Opportunities for Margin Enhancement • CDs were either issued or repriced during September 2012 with a weighted average rate of 0.19% • CDs scheduled to mature during the next three quarters: ─ 4Q12 : $0.9 billion with a weighted average rate of 1.22% ─ 1Q13: $ 0.4 billion with a weighted average rate of 0.73% ─ 2Q13: $0.3 billion with a weighted average rate of 1.11% • Borrowings (1) scheduled to mature during the next three quarters: ─ 4 Q12 : $1.1 billion with a weighted average rate of 1.05% ─ 1Q13: $100 million with a weighted average rate of 2.11% ─ 2Q13: $50 million with a weighted average rate of 1.95% • Residential hybrid ARMs scheduled to reset and reprice downward into 1 year ARMs: ─ 4 Q12 : $1.0 billion with a weighted average rate of 3.81% ─ 1Q13: $0.7 billion with a weighted average rate of 3.97% ─ 2Q13: $1.0 billion with a weighted average rate of 3.86%
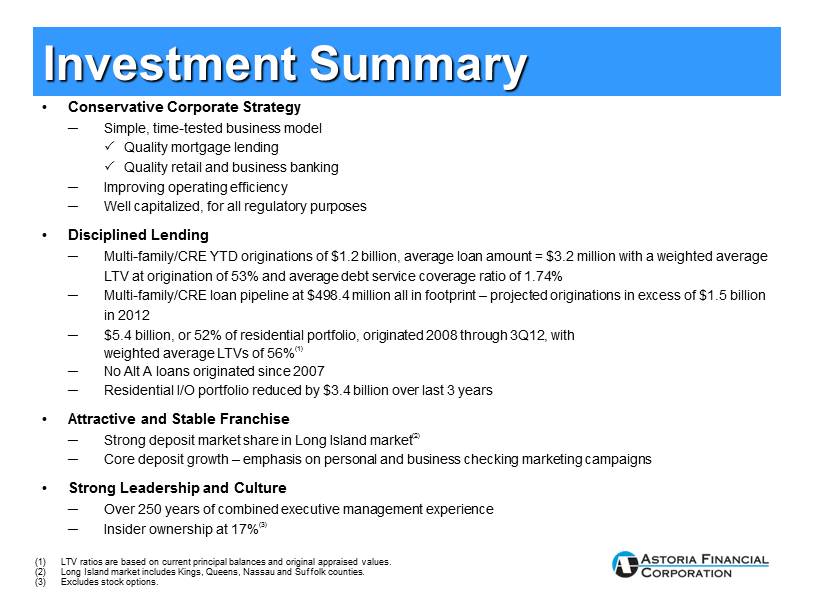
• Conservative Corporate Strategy ─ Simple, time - tested business model Quality mortgage lending Quality retail and business banking ─ Improving operating efficiency ─ Well capitalized, for all regulatory purposes • Disciplined Lending ─ Multi - family/CRE YTD originations of $1.2 billion, average loan amount = $3.2 million with a weighted average LTV at origination of 53 % and average debt service coverage ratio of 1.74% ─ Multi - family/CRE loan pipeline at $498.4 million all in footprint – projected originations in excess of $1.5 billion in 2012 ─ $5.4 billion, or 52% of residential portfolio, originated 2008 through 3Q12, with weighted average LTVs of 56% (1) ─ No Alt A loans originated since 2007 ─ Residential I/O portfolio reduced by $3.4 billion over last 3 years • Attractive and Stable Franchise ─ Strong deposit market share in Long Island market (2) ─ Core deposit growth – emphasis on personal and business checking marketing campaigns • Strong Leadership and Culture ─ Over 250 years of combined executive management experience ─ Insider ownership at 17% (3) (1) LTV ratios are based on current principal balances and original appraised values. (2) Long Island market includes Kings, Queens, Nassau and Suffolk counties. (3) Excludes stock options . Investment Summary

Addendum
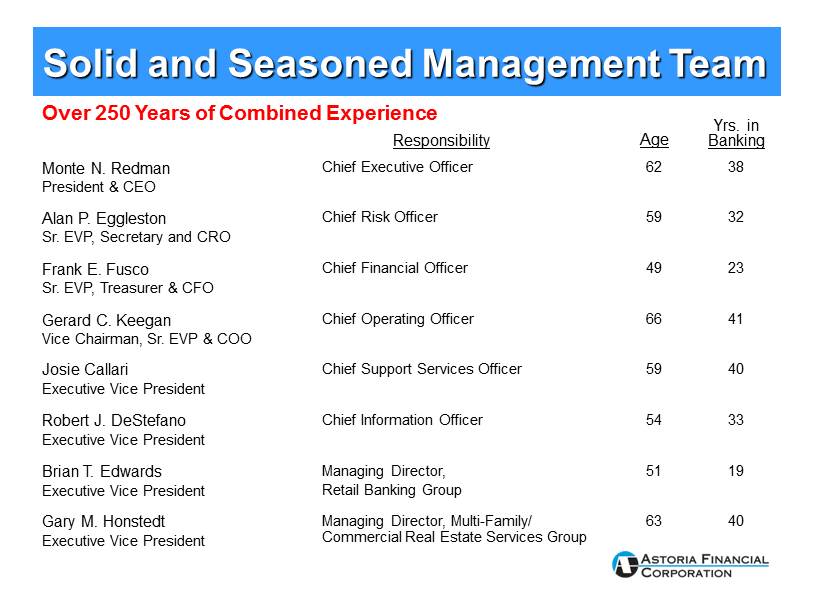
Solid and Seasoned Management Team Responsibility Age Yrs. in Banking Monte N. Redman President & CEO Chief Executive Officer 62 38 Alan P. Eggleston Sr. EVP, Secretary and CRO Chief Risk Officer 59 32 Frank E. Fusco Sr. EVP, Treasurer & CFO Chief Financial Officer 49 23 Gerard C. Keegan Vice Chairman, Sr. EVP & COO Chief Operating Officer 66 41 Josie Callari Executive Vice President Chief Support Services Officer 59 40 Robert J. DeStefano Executive Vice President Chief Information Officer 54 33 Brian T. Edwards Executive Vice President Managing Director, Retail Banking Group 51 19 Gary M. Honstedt Executive Vice President Managing Director, Multi - Family/ Commercial Real Estate Services Group 63 40 Over 250 Years of Combined Experience
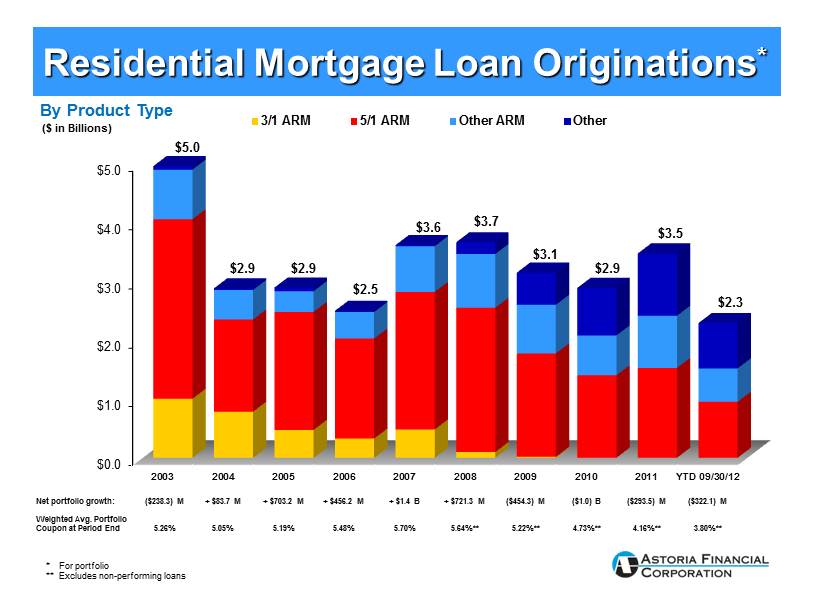
$0.0 $1.0 $2.0 $3.0 $4.0 $5.0 2003 2004 2005 2006 2007 2008 2009 2010 2011 YTD 09/30/12 $5.0 $2.9 $2.9 $2.5 $3.6 $3.7 $3.1 $2.9 $3.5 $ 2.3 3/1 ARM 5/1 ARM Other ARM Other Net portfolio growth: ($238.3) M + $83.7 M + $703.2 M + $456.2 M + $1.4 B + $721.3 M ($454.3) M ($1.0) B ($293.5) M ($322.1) M Weighted Avg. Portfolio Coupon at Period End 5.26% 5.05% 5.19% 5.48% 5.70% 5.64%** 5.22%** 4.73%** 4.16%** 3.80%** Residential Mortgage Loan Originations * By Product Type * For portfolio ** Excludes non - performing loans ($ in Billions )
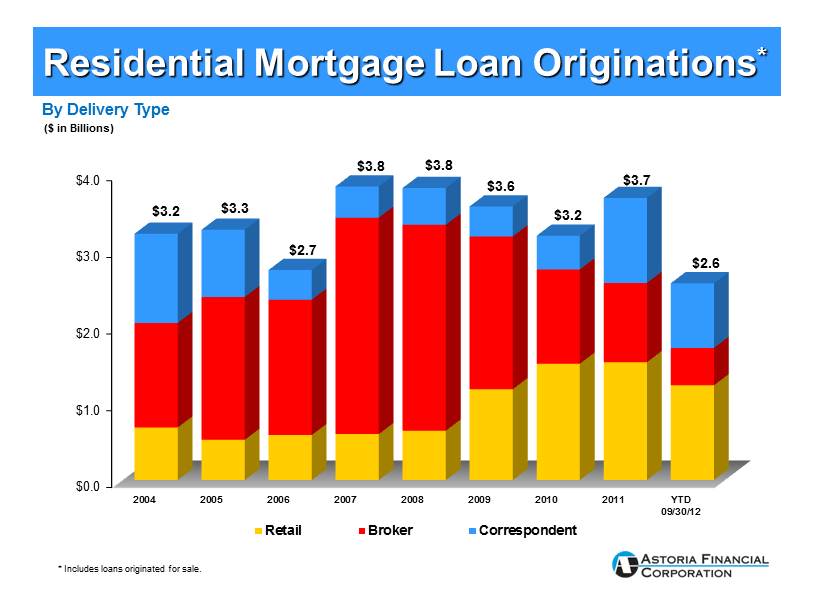
$0.0 $1.0 $2.0 $3.0 $4.0 2004 2005 2006 2007 2008 2009 2010 2011 YTD 09/30/12 $3.2 $3.3 $2.7 $3.8 $3.8 $3.6 $3.2 $3.7 $2.6 Retail Broker Correspondent Residential Mortgage Loan Originations * By Delivery Type ($ in Billions ) * Includes loans originated for sale.
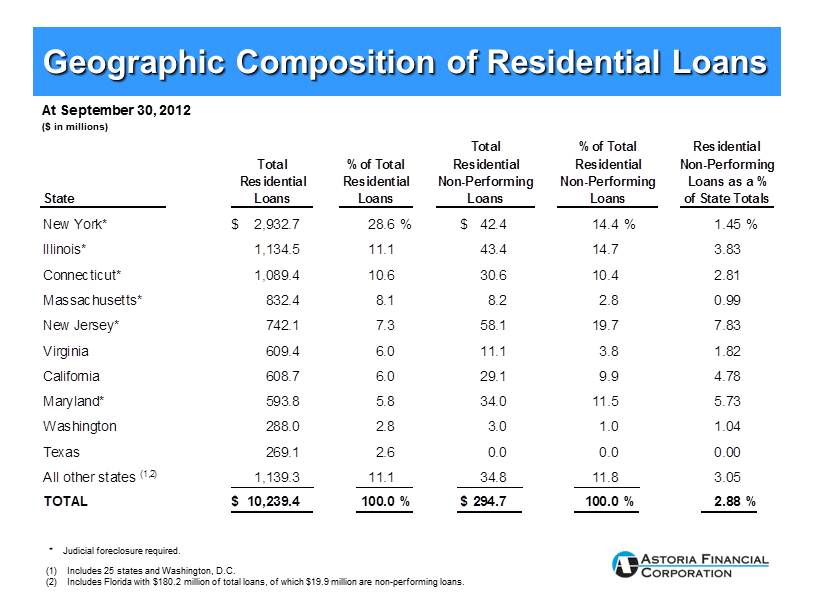
Total % of Total Residential % of Total Residential Residential Non-Performing Residential Non-Performing Non-Performing Loans as a % State Loans Loans Loans of State Totals New York* $ 2,932.7 28.6% $ 42.4 14.4% 1.45% Illinois* 1,134.5 11.1 43.4 14.7 3.83 Connecticut* 1,089.4 10.6 30.6 10.4 2.81 Massachusetts* 832.4 8.1 8.2 2.8 0.99 New Jersey* 742.1 7.3 58.1 19.7 7.83 Virginia 609.4 6.0 11.1 3.8 1.82 California 608.7 6.0 29.1 9.9 4.78 Maryland* 593.8 5.8 34.0 11.5 5.73 Washington 288.0 2.8 3.0 1.0 1.04 Texas 269.1 2.6 0.0 0.0 0.00 All other states (1,2) 1,139.3 11.1 34.8 11.8 3.05 TOTAL $ 10,239.4 100.0% $294.7 100.0% 2.88% Total Residential Loans ($ in millions) At September 30, 2012 (1) Includes 25 states and Washington, D.C. (2) Includes Florida with $180.2 million of total loans, of which $19.9 million are non - performing loans . * Judicial foreclosure required. Geographic Composition of Residential Loans
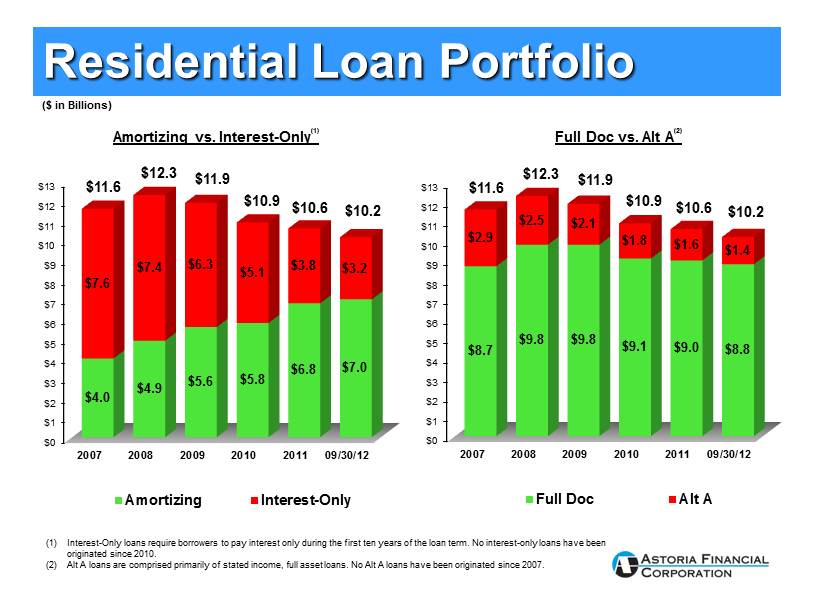
($ in Billions ) $0 $1 $2 $3 $4 $5 $6 $7 $8 $9 $10 $11 $12 $13 2007 2008 2009 2010 2011 09/30/12 $4.0 $4.9 $5.6 $5.8 $6.8 $7.0 $7.6 $7.4 $6.3 $5.1 $3.8 $3.2 $11.6 $12.3 $11.9 $10.9 $10.6 $10.2 Amortizing Interest-Only $0 $1 $2 $3 $4 $5 $6 $7 $8 $9 $10 $11 $12 $13 2007 2008 2009 2010 2011 09/30/12 $8.7 $9.8 $9.8 $9.1 $9.0 $8.8 $2.9 $2.5 $2.1 $1.8 $1.6 $1.4 $11.6 $12.3 $11.9 $10.9 $10.6 $10.2 Full Doc Alt A (1) Interest - Only loans require borrowers to pay interest only during the first ten years of the loan term. No interest - only loans h ave been originated since 2010. (2) Alt A loans are comprised primarily of stated income, full asset loans. No Alt A loans have been originated since 2007. Amortizing vs. Interest - Only (1) Full Doc vs. Alt A (2) Residential Loan Portfolio
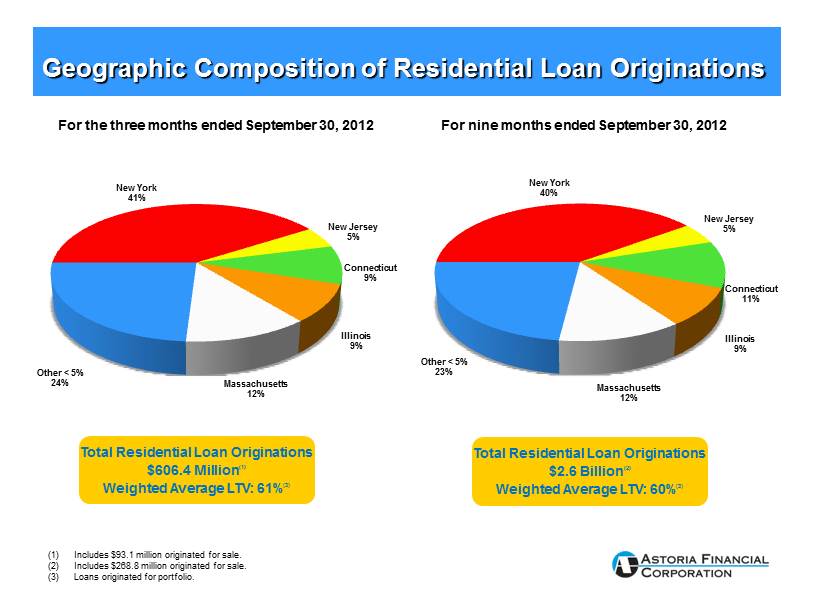
Total Residential Loan Originations $2.6 Billion (2) Weighted Average LTV: 60% (3) New York 40% New Jersey 5% Connecticut 11% Illinois 9% Massachusetts 12% Other < 5% 23% For the three months ended September 30, 2012 Geographic Composition of Residential Loan Originations New York 41 % New Jersey 5% Connecticut 9% Illinois 9% Massachusetts 12% Other < 5% 24% Total Residential Loan Originations $606.4 Million (1) Weighted Average LTV: 61% (3) (1) Includes $93.1 million originated for sale. (2) Includes $268.8 million originated for sale. (3) Loans originated for portfolio. For nine months ended September 30, 2012
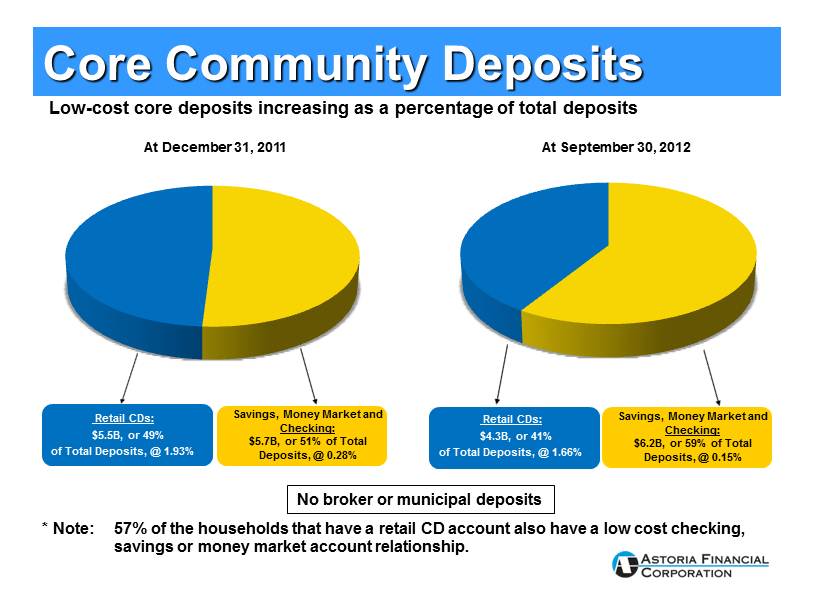
Savings, Money Market and Checking: $6.2B , or 59% of Total Deposits, @ 0.15% Retail CDs: $4.3B , or 41% of Total Deposits, @ 1.66% At December 31, 2011 No broker or municipal deposits Core Community Deposits * Note: 57% of the households that have a retail CD account also have a low cost checking, savings or money market account relationship. Savings, Money Market and Checking: $5.7B , or 51% of Total Deposits, @ 0.28% Retail CDs: $5.5B , or 49% of Total Deposits, @ 1.93% At September 30, 2012 Low - cost core deposits increasing as a percentage of total deposits
P erformance based on E nthusiasm, A ctions and K nowledge “Sales Oriented and Service Obsessed” • A “needs” based approach to sales rather than “product” based approach • Highly interactive program – daily and weekly meetings create a focus that is shared throughout the branch network • Incentives for strong performance, both individual and team Sales – PEAK Process
Customer Satisfaction Key Findings : Favorably Positioned Against Competitors • 77% of Astoria customers are highly satisfied • 75% of Astoria customers are highly likely to recommend Astoria to friend/family member • Astoria customers are 30% more likely to net increase their deposit relationship than are competitor customers • Satisfaction with the branch is by far the strongest driver of overall satisfaction – 85% of Astoria customers are highly satisfied with quality of branch service Survey results are based on a 2010 Independent Customer Satisfaction Survey.
Key Initiatives • Education First ─ Supports lifelong learning, promotes savings and provides meaningful financial solutions to improve the way our customers live and the neighborhoods we serve • Neighborhood Outreach ─ Through funding and volunteer efforts, supports over 700 community - based organizations and not - for - profit agencies that enrich the communities within our market area ─ Reinforces community involvement by promoting neighborhood news and events in our local community branches • Results/Recognition ─ Seven consecutive “Outstanding” Community Reinvestment Act ratings by our primary banking regulator Astoria Federal is an integral part of the fabric of the communities it serves Community Involvement
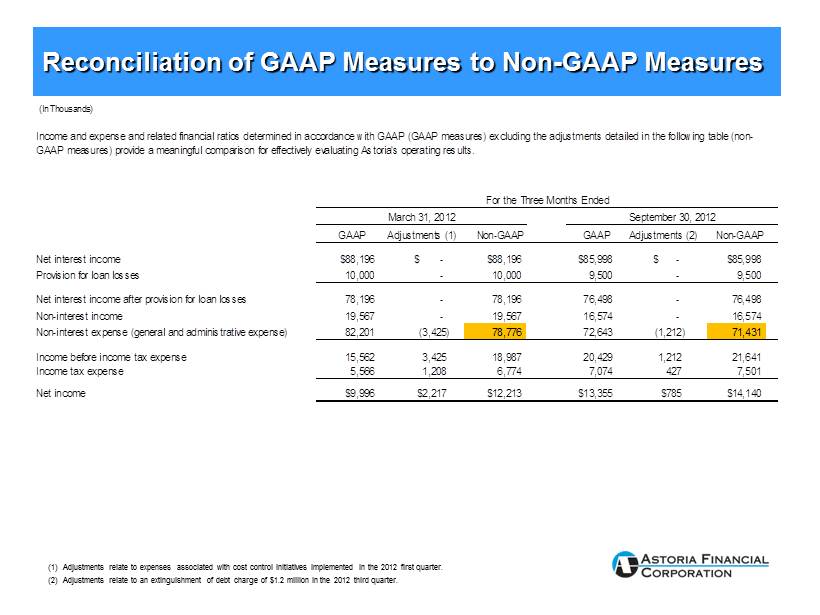
(In Thousands) GAAP Non-GAAP GAAP Non-GAAP Net interest income $88,196 $ - $88,196 $85,998 $ - $85,998 Provision for loan losses 10,000 - 10,000 9,500 - 9,500 Net interest income after provision for loan losses 78,196 - 78,196 76,498 - 76,498 Non-interest income 19,567 - 19,567 16,574 - 16,574 Non-interest expense (general and administrative expense) 82,201 (3,425) 78,776 72,643 (1,212) 71,431 Income before income tax expense 15,562 3,425 18,987 20,429 1,212 21,641 Income tax expense 5,566 1,208 6,774 7,074 427 7,501 Net income $9,996 $2,217 $12,213 $13,355 $785 $14,140 Income and expense and related financial ratios determined in accordance with GAAP (GAAP measures) excluding the adjustments detailed in the following table (non- GAAP measures) provide a meaningful comparison for effectively evaluating Astoria's operating results. March 31, 2012 Adjustments (1) Adjustments (2) September 30, 2012 For the Three Months Ended (1) Adjustments relate to expenses associated with cost control initiatives implemented in the 2012 first quarter. (2) Adjustments relate to an extinguishment of debt charge of $1.2 million in the 2012 third quarter. Reconciliation of GAAP Measures to Non - GAAP Measures
Glossary ARM ─ Adjustable Rate Mortgage CRE ─ Commercial Real Estate ESOP ─ Employee Stock Ownership Plan GAAP ─ Generally Accepted Accounting Principles GSE ─ Government Sponsored Enterprise I/O ─ Interest - Only LTV ─ Loan - To - Value Ratio MBS ─ Mortgage - Backed Securities NPL ─ Non - Performing Loan
Contact Information Web site: www.astoriafederal.com Email: ir@astoriafederal.com Telephone: (516) 327 - 7869 Address: Astoria Financial Corporation Attn: Investor Relations One Astoria Federal Plaza Lake Success, NY 11042