Attached files
| file | filename |
|---|---|
| EX-99.1 - NEWS RELEASE - Xylem Inc. | d429180dex991.htm |
| 8-K - FORM 8-K - Xylem Inc. | d429180d8k.htm |
 Q3
2012 Earnings Release November 1, 2012
Exhibit 99.2 |
 Forward
Looking Statements 2
This
document
contains
information
that
may
constitute
“forward-looking
statements.”
Forward-looking
statements
by
their
nature
address
matters
that
are,
to
different
degrees,
uncertain.
Generally,
the
words
“anticipate,”
“estimate,”
“expect,”
“project,”
“intend,”
“plan,”
“believe,”
“target”
and similar expressions identify forward-looking statements, which
generally are not historical in nature. However, the absence of these words or
similar expressions does not mean that a statement is not
forward-looking. These forward-looking statements include, but are
not limited to, statements about the separation of Xylem Inc. (the
“Company”) from ITT Corporation, the terms and the effect of the
separation, the nature and impact of the separation, capitalization of the
Company, future strategic plans and other statements that describe the Company’s business
strategy, outlook, objectives, plans, intentions or goals, and any discussion of
future operating or financial performance. All statements that address
operating performance, events or developments that we expect or anticipate will occur in
the
future
—
including
statements
relating
to
orders,
revenues,
operating
margins
and
earnings
per
share
growth,
and
statements
expressing
general
views
about
future
operating
results
—
are
forward-looking
statements.
Caution should be taken not to place undue reliance on any such forward-looking
statements because they involve risks, uncertainties and other factors that
could cause actual results to differ materially from those expressed or implied
in,
or
reasonably
inferred
from,
such
statements.
The
Company
undertakes
no
obligation
to
publicly
update
or
revise
any forward-looking statements, whether as a result of new information, future
events or otherwise, except as required by law. In addition,
forward-looking statements are subject to certain risks and uncertainties that could cause actual
results to differ materially from the Company’s historical experience and our
present expectations or projections. These risks and uncertainties include,
but are not limited to, those set forth in Item 1A of our Annual Report on Form 10-K, and
those described from time to time in subsequent reports filed with the Securities
and Exchange Commission. |
 Q3’12 Xylem Results
3
Solid Operating Performance, Despite Continued Market Challenges
Solid Operating Performance, Despite Continued Market Challenges
* See Appendix for Non-GAAP Reconciliations
Financial
Financial
Performance Summary
Performance Summary
Orders
Revenue
Gross Margin
Operating Margin *
EPS *
$882M
$931M
40.2%
12.9%
$0.44
Book to Bill 0.95
+3% (Constant Currency Basis)*
+130 bps
+50 bps Adjusted for Stand-Alone Costs
Solid Performance from Core Operations & YSI |
 Business Update
4
Advancing Our Strategic Position •
Executing Acquisition Strategy MJK Integration into
Analytics Platform Well Underway
Heartland Pump Acquisition … Increases Geographic Reach of Dewatering
Platform
•
Selected to Dow Jones Sustainability Global and North America Indices Deploying Innovative New Product Applications and Services
•
U.S. Launch of the Sanitaire Bioloop Oxidation Ditch •
Launched Energy Efficient Lowara Ecocirc – Meeting New European Regulations •
Recognized by The Coca-Cola Company as Supplier of the Year
Continued Strong Execution
•
Q3’12 Emerging Market Growth up 9% (Constant Currency Basis) •
Gross Margin >40% … Record Performance •
Executing on Restructuring & Realignment Actions
Advancing
Advancing
Strategic
Strategic
Position
Position
&
&
Increasing
Increasing
Profitability
Profitability |
 Acquisition Overview
5
Overview
-
Purchase Price $29M
-
‘11 Rev $33M
-
100 Employees
-
4 locations
-
Industrial & Muni;
•
Mining
•
Energy
•
Disaster Recovery
-
Expands Geographic Reach
-
Increases Rental Opportunities
-
Leverage Xylem Portfolio
-
Cost Synergies
-
Capex Synergies
Sales
~60%
Rental
~40%
Revenue Mix
Strategic Rationale
Heartland Pump Rental & Sales, Inc.
Expands Xylem’s Dewatering Platform in Attractive U.S. Rental Markets
Expands Xylem’s Dewatering Platform in Attractive U.S. Rental Markets
|
 YTD
Xylem Results 6
On Track to Deliver in 2012 …
On Track to Deliver in 2012 …
Positioned for Long-Term Growth
Positioned for Long-Term Growth
* See Appendix for Non-GAAP Reconciliations
Orders
Revenue
Gross Margin
Operating Margin *
EPS *
Free Cash Flow *
$2.9B
$2.8B
39.7%
12.7%
$1.29
$171M
Book to Bill 1.01
+4% (Constant Currency Basis)*
+110 bps
Includes Impact from Stand-Alone Costs -90bps
Solid Performance from Core Operations & YSI
73% Conversion ... Typical Seasonality
Financial Performance Summary
Financial Performance Summary |
 Full
Year Outlook 7
*See appendix for non-GAAP reconciliations
4th Quarter Execution Sets up 2013
•
Executing on Restructuring & Realignment Actions
•
Accelerating Additional Actions in 2012
•
Continued Disciplined Capital Deployment
•
Successful Integration of MJK & Heartland Acquisitions
2012 Guidance
•
Full Year Revenue ~$3.8B; Organic Growth ~1%
•
Delivering Solid Operating Margin Expansion
•
EPS Mid Point of $1.76* … Includes Heartland Pump Acquisition Impact ($0.01)
•
Solid Free Cash Flow Conversion*
•
Executing ~$20M Total Restructuring & Realignment Actions
Solid Execution in 2012 …
Solid Execution in 2012 …
Positioning for Long-Term Growth
Positioning for Long-Term Growth |
 Q3’12 Xylem Performance
8
Op Margins +50 bps …
Op Margins +50 bps …
Cost Actions/Price Enable Investments for Growth
Cost Actions/Price Enable Investments for Growth
*See appendix for non-GAAP reconciliations
(Dollars, In Millions)
(Dollars, In Millions)
Revenue
Revenue
Operating Income *
Operating Income *
Organic
Acquisition
Constant Currency
FX
Total
+1%
+2%
+3%
-
4%
-
1%
By End Market
By Geography
Industrial
+
Public Utility
Commercial
Residential
+
Agriculture
+
Europe
U.S.
+
Emerging Markets
Cost Reductions
+3.2%
Price
+1.3%
Vol/Mix/Invest
-
0.5%
120
125
-
4%
Q3’11
Q3’12
Q3’11
Q3’12
13.3%
4.0%
0.6%
2.9%
13.8%
0.9%
12.9%
Q3’11
Op Margin*
Operations
FX
Material,
Labor,
& OH
Inflation
Q3’12
Op Margin
Before Stand-
Alone Costs*
Stand-
Alone
Costs
Q3’12
Op Margin*
Q3 Growth
Q3 Growth
Organic Performance
Organic Performance
931
939
-
1% |
 Q3’12 Xylem Performance
9
EPS Growth Negatively Impacted by FX and Taxes
EPS Growth Negatively Impacted by FX and Taxes
Interest
($0.06)
Stand-Alone
($0.03)
Separation Costs
$0.13
Special Tax
($0.01)
* See Appendix for Non-GAAP Reconciliations
Separation Costs
($0.02)
Restruct. &
Realign. Costs
($0.02)
Special Tax
($0.02)
-2% Normalized
-2% Normalized
2% Normalized
EPS Performance
EPS Performance
Operational Performance:
Core Operations
Acquisitions
Operating Tax Rate
FX Translation
$0.01
$0.01
($0.01)
($0.02)
$0.42
$0.03
$0.45
$0.01
$0.44
$0.06
$0.38
Q3’11
GAAP EPS
Adjustments
Normalized
Q3’11 EPS
Operational
Performance
Adjusted
Q3’12 EPS
Q3’12
GAAP EPS
Adjustments
Q3’12 EPS * |
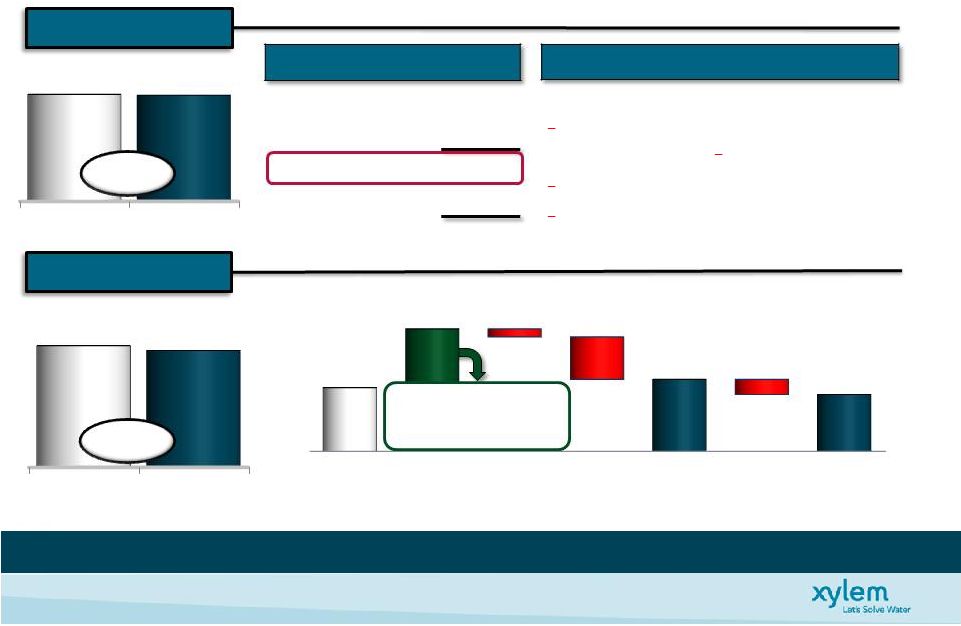
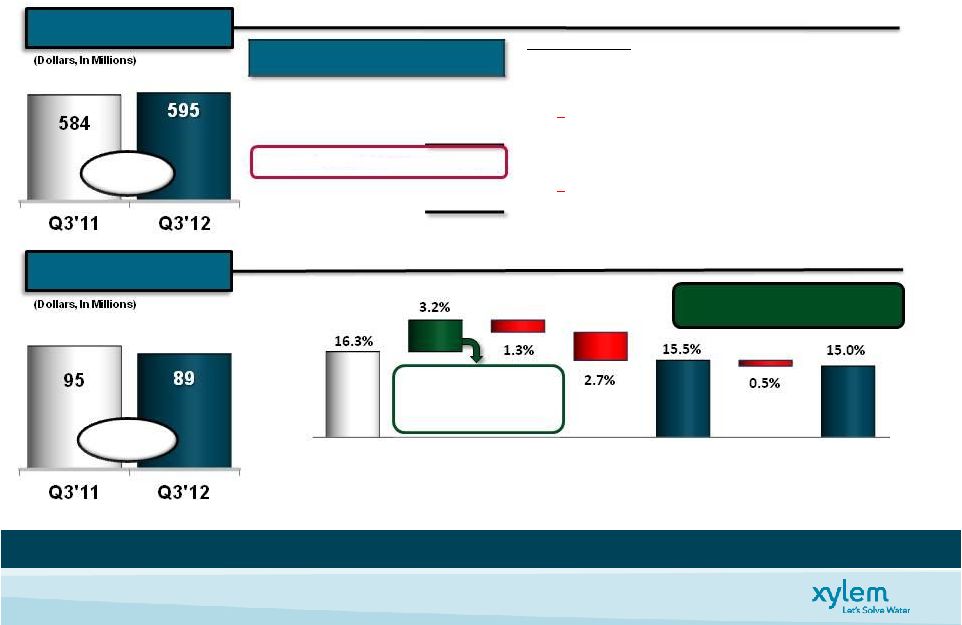 Q3’12 Water Infrastructure Performance
10
Revenue Up 7%* …
Revenue Up 7%* …
Operating Margin Impacted by Unfavorable Mix & FX
Operating Margin Impacted by Unfavorable Mix & FX
* See appendix for non-GAAP reconciliations
(Constant Currency)
•
+
Public Utility …
US & Europe Up, EM Strong
Industrial …
US Drought Impact on Dewatering
•
+
Global Public Utility Strength
Project Orders Continue to Delay
•
+
Strength in US & AP …
Europe Flat
+2%
-6%
Organic
Acquisition
Constant Currency
+3%
+4%
Operating Income *
Operating Income *
Cost Reductions
+2.9%
Price
+0.7%
Vol/Mix/Invest
-
0.4%
Incremental Margin ~23%
Incremental Margin ~23%
(Ex. FX & Stand Alone Costs)
(Ex. FX & Stand Alone Costs)
Q3 Growth
Q3 Growth
+2%
Revenue
Revenue
+7%
-5%
FX
Total
Transport +1%
Treatment +11%
Test +44%
Q3'11
Op Margin*
Operations
FX
Material,
Labor,
& OH
Inflation
Q3'12
Op Margin
Before
Stand-Alone
Stand-
Alone
Q3'12
Op Margin* |
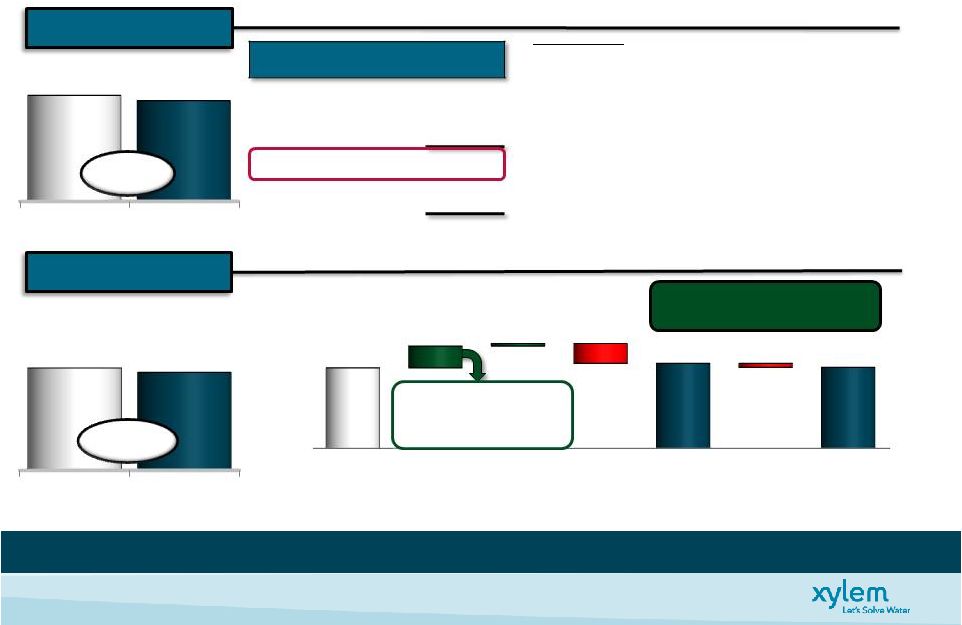 Q3’12 Applied Water Performance
11
Price
&
Cost
Reduction
Initiatives
Offset
Challenging
Market
Conditions
* See appendix for non-GAAP reconciliations
Revenue
Operating Income *
(Dollars, In Millions)
(Dollars, In Millions)
-4%
(Constant Currency)
•
Building Services -6%
–
Commercial …
Lag in Major Projects, Tough PY Comp
–
Residential …
Tough PY Comp (U.S. Up Double Digit)
•
Industrial Water +1%
+
Favorable Across Most Regions
–
U.S. & Europe showing signs of weakness
•
Irrigation +9%
+
Double Digit U.S. Growth, Europe Improving
Preserving Profitability While
Investing for Growth
Organic
-2%
Acquisition
-%
Constant Currency
2%
FX
-3%
Total
-5%
Q3'11
Op Margin
Operations
FX
Material,
Labor,
& OH
Inflation
Q3'12
Op Margin
Before
Stand-Alone
Stand-
Alone
Q3'12
Op Margin *
12.5%
13.2%
12.6%
3.1%
0.6%
3.4%
0.4%
Q3'11
Q3'12
368
350
Q3'11
Q3'12
46
44
Cost Reductions
+3.7%
Price
+2.3%
Vol/Mix/Invest
-
2.6%
-5%
Q3 Growth |
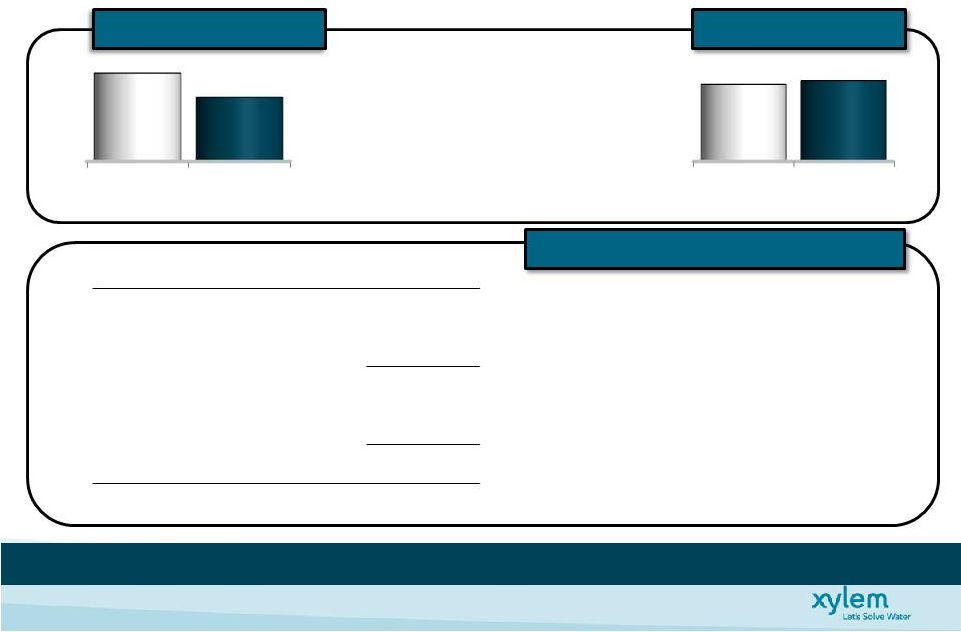 Xylem
Financial Position 12
FY Cash Flow On Track …
FY Cash Flow On Track …
Strong Balance Sheet Provides Flexibility
Strong Balance Sheet Provides Flexibility
•
Free Cash Flow $171M
•
Higher Cash Taxes
•
Full Year of Interest
•
Stand
Alone Costs
•
Capex > 1 Reinvestment Ratio
•
Strong Cash Position
•
No Significant Debt Maturities Until 2016
•
28% Net Debt to Net Capital
•
1.2x Net Debt/Adj. TTM EBITDA
•
$600M
Revolving
Credit
Facility
-
Unutilized
•
Access
to
Commercial
Paper
-
Unutilized
FCF%
84%
73%
W/C%**
23.7%
24.8%
(Dollars, In Millions)
(Dollars, In Millions)
(Dollars, In Millions)
* See Appendix for Non-GAAP Reconciliations
** (AR+INV-AP)/ TTM Revenue (Adjusted for Acquisitions)
Free Cash Flow *
Free Cash Flow *
Working Capital
Working Capital
Capital Summary/Liquidity
Capital Summary/Liquidity
September 30, 2012
Cash
Debt
Net Debt
Stockholders’
Equity
Net Capital
Net Debt to Net Capital
424
1,212
788
2,054
2,842
28%
907
952
171
235
Q3’11 YTD
Q3’12 YTD
Q3’11
Q3’12
- |
 2012 Guidance |
 2012
EPS Guidance Walk 14
Mid Point 6% Earnings Growth Versus Prior Year On Normalized Basis
Illustration of Mid Point Guidance
* See Appendix for Non-GAAP Reconciliations
Offsetting Volume Reduction
Operational Performance:
FX Translation
Vol. Net of Cost Initiatives
$0.02
($0.02)
Heartland Pump
Heartland Pump
Acquisition
Acquisition
$(0.01) in 4Q
$(0.01) in 4Q
$1.77
$1.77
$0.01
$1.76
Previous
Guidance
Guidance
Before Heartlnd
Acquisition
Heartland
Acquisition
FY 2012
Guidance |
 2012
Financial Guidance Summary 15
* See Appendix for Non-GAAP Reconciliations
Revenue
Xylem Consolidated
Water Infrastructure
Applied Water
Segment Margin *
Operating Margin *
EPS *
Free Cash Flow Conversion
Guidance Assumptions:
Stand-Alone Costs
Operating Tax Rate
Share Count
Items Excluded from Guidance:
(1) Separation Costs
(2) Restructuring &
Realignment Costs
Constant Currency
Organic
Acquisition
~$3.8B
~$2.4B
~$1.4B
14.1% -
14.3%
12.7% -
12.9%
$1.72 -
$1.79
95%
~186.2M
~$28M
~$25%
~$20M
~$20M
+10 to +30 bps
+0 to +20 bps
$1.76 Mid Point incl. Heartland Pump Acq. impact -
$0.01
Excluding one-time separation costs
Included in EPS Guidance; In Line with Expectations
Excludes Special Tax Items
In Line with Expectations
Additional Actions Identified in 3Q’12
~$11MTotal Run Rate Savings Beginning 2013
~3%
~1% 2%
~5%
~1% 4%
~1%
~1% 0%
2012 Full Year
2012 Full Year
Financial Outlook
Financial Outlook
Growth
Growth
2012E vs. 2011
2012E vs. 2011 |
 Key
Takeaways 16
Positioning for Long-Term Growth
•
Investing in Strategic Growth Platforms
•
Executing M&A Strategy
•
Advancing Our Geographic Position
•
Launching New Products & Investing in Future Growth
•
Customer Excellence & Operational Discipline
Restructuring & Realignment Actions Underway
•
Executing Actions to Preserve Investments
•
Defending and Improving Our Competitive Advantage
•
Providing for Stronger Operating Leverage
Strong Financial Position
•
Flexibility to Execute Long-Term Strategy |
 Appendix |
 Quarterly Financial Performance
18
($M, Except
EPS)
Q1’10
Q2’10
Q3’10
Q4’10
FY’10
Q1’11
Q2’11
Q3’11
Q4’11
FY’11
Q1’12
Q2’12
Q3’12
Revenue
686
775
806
935
3,202
890
971
939
1,003
3,803
925
966
931
COGS
431
484
497
576
1,988
553
592
574
623
2,342
562
583
557
Gross Profit
255
291
309
359
1,214
337
379
365
380
1,461
363
383
374
SG&A
164
170
183
220
737
210
219
215
233
877
231
220
231
R&D
18
17
18
21
74
24
26
23
27
100
28
28
24
Separation Costs
-
-
-
-
-
3
18
46
20
87
5
6
4
Restructuring &
Asset Impairment
Charges, net
4
3
1
7
15
-
-
2
-
2
-
-
4
Op Income
69
101
107
111
388
100
116
79
100
395
99
129
111
Interest Expense
-
-
-
-
-
-
1
1
15
17
14
13
14
Other Non-Op
-2
-1
3
-
-
1
-
4
-
5
(1)
(1)
3
Income before Tax
67
100
110
111
388
101
115
82
85
383
84
115
100
Tax
11
15
19
14
59
23
43
5
33
104
21
26
28
Net Income
56
85
91
97
329
78
72
77
52
279
63
89
72
EPS –
Diluted *
$0.30
$0.46
$0.49
$0.53
$1.78
$0.42
$0.39
$0.42
$0.28
$1.50
$0.34
$0.48
$0.38
* On October 31, 2011, Xylem Inc. completed the spin-off through a tax-free stock dividend to
ITT Corporation’s shareholders. ITT Corporation shareholders received one share of
our common stock for each share of ITT common stock. As a result on October 31, 2011, we
had 184.6 million shares of common stock outstanding and this share amount is being utilized to
calculate earnings per share for all periods presented prior to the spin-off. |
 Non-GAAP Measures
19
Management views key performance indicators including revenue, gross margins, segment operating
income and margins, orders growth, free cash flow, working capital, and backlog, among
others. In addition, we consider certain measures to be useful to management and investors evaluating our operating performance for the periods
presented, and provide a tool for evaluating our ongoing operations, liquidity and management
of assets. This information can assist investors in assessing our financial
measures of financial performance under GAAP and should not be considered a substitute for
revenue, operating income, net income, earnings per share (basic and diluted) or net
cash from operations as determined in accordance with GAAP. We consider the following non-GAAP measures, which may not be comparable to similarly titled
measures reported by other companies, to be key performance indicators:
“Organic revenue" and "Organic orders”
defined as revenue and orders, respectively, excluding the impact of foreign currency
fluctuations, intercompany transactions, and contributions from acquisitions and
divestitures. Divestitures include sales of portions of our business that did not meet the criteria for classification as a discontinued
operation or insignificant portions of our business that we did not classify as a discontinued
operation. The period-over-period change resulting from foreign currency
fluctuations assumes no change in exchange rates from the prior period.
“Constant currency”
defined as financial results adjusted for currency translation impacts by translating current
period and prior period activity using the same currency conversion rate. This
approach is used for countries whose functional currency is not the U.S. dollar.
“EBITDA”
EBITDA to exclude for non-recurring separation costs associated with the Xylem
spin-off from ITT Corporation as well as non-recurring restructuring and realignment costs.
"Adjusted Operating Income", "Adjusted Segment Operating Income", and
“Adjusted EPS” defined as operating income and earnings per share, adjusted
to exclude non-recurring separation costs associated with the Xylem spin-off
from ITT Corporation, non-recurring restructuring and realignment costs and tax-related special items.
“Normalized EPS”
defined as adjusted earnings per share, as well as adjustments to reflect the incremental
current period amount of interest expense and stand alone costs in the prior comparable
period. “Free Cash Flow”
defined as net cash from operating activities, as reported in the Statement of Cash Flow,
less capital expenditures as well as adjustments for other significant items that
impact current results which management believes are not related to our ongoing operations and performance. Our definition of free cash flows
does not consider non-discretionary cash payments, such as debt.
performance and measures our ability to generate capital for deployment among competing
strategic alternatives and initiatives. These metrics, however, are not
defined as earnings before interest, taxes, depreciation, amortization expense, and
share-based compensation. “Adjusted EBITDA” reflects the adjustment to |
 Non-GAAP Reconciliation:
Organic & Constant Currency Revenue Growth
20 |
 Non-GAAP Reconciliation:
Organic & Constant Currency Order Growth
21
Constant Currency
(A)
(B)
(C)
(D)
(E)
(F) = B+C+D+E
(G) = F/A
(H) = (B + D) / A
Change
% Change
Change
% Change
Orders
Orders
2012 v. 2011
2012 v. 2011
FX Contribution
Eliminations
Adj. 2012 v. 2011
Adj. 2012 v. 2011
2012
2011
Nine Months Ended September 30
Xylem Inc.
2,856
2,942
(86)
-2.9%
(88)
108
-
(66)
-2.2%
0.7%
Water infrastructure
1,819
1,865
(46)
-2.5%
(88)
82
-
(52)
-2.8%
1.9%
Applied Water
1,086
1,122
(36)
-3.2%
-
30
(8)
(14)
-1.2%
-0.5%
Quarter Ended September 30, 2012
Xylem Inc.
882
966
(84)
-8.7%
(21)
39
-
(66)
-6.8%
-4.7%
Water infrastructure
564
621
(57)
-9.2%
(21)
29
-
(49)
-7.9%
-4.5%
Applied Water
334
358
(24)
-6.7%
-
12
(5)
(17)
-4.7%
-3.4%
Quarter Ended June 30
Xylem Inc.
970
998
(28)
-2.8%
(30)
51
-
(7)
-0.7%
2.3%
Water infrastructure
617
632
(15)
-2.4%
(30)
40
-
(5)
-0.8%
4.0%
Applied Water
370
383
(13)
-3.4%
-
13
(2)
(2)
-0.5%
0.0%
Quarter Ended March 31
Xylem Inc.
1,004
978
26
2.7%
(37)
18
-
7
0.7%
4.5%
Water infrastructure
638
612
26
4.2%
(37)
13
-
2
0.3%
6.4%
Applied Water
382
381
1
0.3%
-
5
(1)
5
1.3%
1.6%
Note: Due to rounding the sum of segment amounts may not agree to Xylem totals.
Acquisitions /
Divestitures
Xylem Inc. Non-GAAP Reconciliation
Reported vs. Organic & Constant Currency Order Growth
($ Millions)
(As Reported - GAAP)
(As Adjusted - Organic) |
  Non-GAAP Reconciliation: Adjusted Diluted EPS
22
Q1 2012
Q2 2012
Q3 2012
YTD 2012
Net Income
63
89
72
224
Separation Costs, Net of Tax
4
4
3
11
Restructuring & Realignment, Net of Tax
-
-
4
4
Adjusted Net Income before Special Tax Items
67
93
79
239
Special Tax Items
-
(1)
4
3
Adjusted Net Income
67
92
83
242
Diluted Earnings per Share
$0.34
$0.48
$0.38
$1.20
Separation Costs per Share
$0.02
$0.02
$0.02
$0.06
Restructuring & Realignment Costs per Share
$0.00
$0.00
$0.02
$0.02
Adjusted Diluted EPS before Special Tax Items
$0.36
$0.50
$0.42
$1.28
Special Tax Items per Share
$0.00
($0.01)
$0.02
$0.01
Adjusted Diluted EPS
$0.36
$0.49
$0.44
$1.29
Q1 2011
Q2 2011
Q3 2011
YTD 2011
Net Income
78
72
77
227
Separation Costs, Net of Tax
2
27
25
54
Adjusted Net Income before Special Tax Items
80
99
102
281
Special Tax Items
-
4
(1)
3
Adjusted Net Income
80
103
101
284
Diluted Earnings per Share
$0.42
$0.39
$0.42
$1.23
Separation Costs per Share
$0.01
$0.15
$0.13
$0.29
Adjusted Diluted EPS before Special Tax Items
$0.43
$0.54
$0.55
$1.52
Special Tax Items per Share
$0.00
$0.02
($0.01)
$0.01
Adjusted Diluted EPS
$0.43
$0.56
$0.54
$1.53
Adjusted Diluted EPS
For The Three and Nine Months Ended September 30, 2012 & 2011
($ Millions, except per share amounts)
Xylem Inc. Non-GAAP Reconciliation |
 Non-GAAP Reconciliation: Normalized and Adjusted EPS
23
Q3 2011
Q3 2012
As Reported
Adjustments
Adjusted
Adjustments
Normalized
As Reported
Adjustments
Adjusted
Total Revenue
939
939
939
931
931
Operating Income
79
46
a
125
(8)
c
117
111
9
a
120
Operating Margin
8.4%
13.3%
12.5%
11.9%
12.9%
Interest Expense
(1)
(1)
(13)
d
(14)
(14)
(14)
Other Non-Operating Income (Expense)
4
4
4
3
3
Income before Taxes
82
46
128
(21)
107
100
9
109
Provision for Income Taxes
(5)
(22)
b
(27)
4
e
(23)
(28)
2
b
(26)
Net Income
77
24
101
(17)
84
72
11
83
Diluted Shares
184.6
184.6
186.3
186.3
Diluted EPS
0.42
$
0.12
$
0.54
$
(0.09)
$
0.45
$
0.38
$
0.06
$
0.44
$
a
One time separation, restructuring & realignment costs
b
Tax impact of one time separation costs and special tax items
c
Incremental stand alone costs incurred in 2012
d
Incremental interest expense on long-term debt entered into in conjunction with the spin
e
Tax impact of incremental interest expense and stand alone costs incurred in 2012
Xylem Inc. Non-GAAP Reconciliation
Normalized and Adjusted Diluted EPS
($ Millions, except per share amounts) |
 24
Non-GAAP Reconciliation: Operating Income
Q3
YTD
'12
'11
'12
'11
Total Revenue
• Total Xylem
931
939
2,822
2,800
• Water Infrastructure
595
584
1,788
1,737
• Applied Water
350
368
1,078
1,108
Operating Income
• Total Xylem
111
79
339
296
• Water Infrastructure
85
87
253
245
• Applied Water
43
37
135
133
Operating Margin
• Total Xylem
11.9%
8.4%
12.0%
10.6%
• Water Infrastructure
14.3%
14.9%
14.1%
14.1%
• Applied Water
12.3%
10.0%
12.5%
12.0%
Separation Costs
• Total Xylem
4
46
15
67
• Water Infrastructure
-
8
3
10
• Applied Water
1
9
2
9
Restructuring & Realignment Costs
• Total Xylem
5
-
5
-
• Water Infrastructure
4
-
4
-
• Applied Water
-
-
-
-
Adjusted Operating Income*
• Total Xylem
120
125
359
363
• Water Infrastructure
89
95
260
255
• Applied Water
44
46
137
142
Adjusted Operating Margin*
• Total Xylem
12.9%
13.3%
12.7%
13.0%
• Water Infrastructure
15.0%
16.3%
14.5%
14.7%
• Applied Water
12.6%
12.5%
12.7%
12.8%
*Adjusted Operating Income excludes non-recurring separation, restructuring &
realignment costs Xylem Inc. Non-GAAP Reconciliation
Adjusted Operating Income
($ Millions) |
  Non-GAAP Reconciliation: Free Cash Flow
25
2012
2011
Net Cash - Operating Activities
230
252
Capital Expenditures
(81)
(79)
Free Cash Flow, including separation costs
149
173
Cash Paid for Separation Costs (incl. Capex)
22
62
Free Cash Flow, excluding separation costs
171
235
Net Income
224
227
Separation Costs, net of tax (incl. tax friction)
11
54
Adjusted Net Income
235
281
Free Cash Flow Conversion
73%
84%
Xylem Inc. Non-GAAP Reconciliation
Net Cash - Operating Activities vs. Free Cash Flow
For The Nine Months Ended September 30, 2012 & 2011
($ Millions)
Nine Months Ended |
  26
Non-GAAP Reconciliation: 2012 Xylem EBITDA & Adj. EBITDA
Q1
Q2
Q3
YTD
Income Before Taxes
84
115
100
299
Interest, net
13
13
12
38
Depreciation
23
21
24
68
Amortization
11
12
12
35
Stock
Compensation 5
5
6
16
EBITDA
136
166
154
456
Separation Costs
5
6
4
15
Restructuring &
Realignment Costs -
-
5
5
Adjusted
EBITDA 141
172
163
476
Revenue
925
966
931
2,822
Adjusted EBITDA Margin
15.2%
17.8%
17.5%
16.9%
Xylem Inc. Non-GAAP Reconciliation
EBITDA and Adjusted EBITDA by Quarter
Total Xylem
($ Millions)
2012 |
  27
Non-GAAP Reconciliation: 2011 Xylem EBITDA & Adj. EBITDA
Q1
Q2
Q3
Q4
Total
Pre-Tax Net Income
101
115
82
85
383
Interest, net
-
-
1
16
17
Depreciation
22
25
25
21
93
Amortization
11
10
11
12
44
Stock
Compensation 3
2
2
6
13
EBITDA
137
152
121
140
550
Separation Costs
3
18
46
20
87
Adjusted EBITDA
140
170
167
160
637
Revenues
890
971
939
1,003
3,803
Adjusted EBITDA Margin
15.7%
17.5%
17.8%
16.0%
16.7%
Xylem Inc. Non-GAAP Reconciliation
EBITDA and Adjusted EBITDA by Quarter
($ Millions)
2011
Total Xylem |
  28
Non-GAAP Reconciliation: 2012 Water Infrastructure EBITDA & Adj. EBITDA
Q1
Q2
Q3
YTD
Income Before Taxes
75
93
86
254
Interest, net
-
-
(1)
(1)
Depreciation
16
15
17
48
Amortization
10
9
10
29
Stock
Compensation 1
1
3
5
EBITDA
102
118
115
335
Separation Costs
2
1
-
3
Restructuring & Realignment Costs
-
-
4
4
Adjusted
EBITDA 104
119
119
342
Revenue
584
609
595
1,788
Adjusted EBITDA Margin
17.8%
19.5%
20.0%
19.1%
Xylem Inc. Non-GAAP Reconciliation
EBITDA and Adjusted EBITDA by Quarter
Water Infrastructure
($ Millions)
2012 |
 29
Non-GAAP Reconciliation: 2011 Water Infrastructure EBITDA & Adj. EBITDA
Q1
Q2
Q3
Q4
Total
Pre-Tax Net Income
65
93
88
99
345
Interest, net
(1)
-
(1)
Depreciation
16
19
19
14
68
Amortization
9
9
9
9
36
Stock
Compensation -
-
1
1
2
EBITDA
90
121
116
123
450
Separation Costs
-
2
8
6
16
Adjusted EBITDA
90
123
124
129
466
Revenues
551
602
584
679
2,416
Adjusted EBITDA Margin
16.3%
20.4%
21.2%
19.0%
19.3%
Xylem Inc. Non-GAAP Reconciliation
EBITDA and Adjusted EBITDA by Quarter
Water Infrastructure
($ Millions)
2011 |
 30
Non-GAAP Reconciliation: 2012 Applied Water EBITDA & Adj. EBITDA
Q1
Q2
Q3
YTD
Income Before Taxes
40
52
43
135
Interest, net
-
-
-
-
Depreciation
6
6
6
18
Amortization
1
1
1
3
Stock
Compensation 1
-
2
3
EBITDA
48
59
52
159
Separation Costs
1
-
1
2
Restructuring & Realignment Costs
-
-
-
-
Adjusted EBITDA
49
59
53
161
Revenue
355
373
350
1,078
Adjusted EBITDA Margin
13.8%
15.8%
15.1%
14.9%
Xylem Inc. Non-GAAP Reconciliation
EBITDA and Adjusted EBITDA by Quarter
Applied Water
($ Millions)
2012 |
  31
Non-GAAP Reconciliation: 2011 Applied Water EBITDA & Adj. EBITDA
Q1
Q2
Q3
Q4
Total
Pre-Tax Net Income
46
51
37
25
159
Interest, net
-
-
-
-
-
Depreciation
6
6
6
7
25
Amortization
2
1
2
1
6
Stock
Compensation -
-
1
1
2
EBITDA
54
58
46
34
192
Separation Costs
-
-
9
4
13
Adjusted EBITDA
54
58
55
38
205
Revenues
355
385
368
336
1,444
Adjusted EBITDA Margin
15.2%
15.1%
14.9%
11.3%
14.2%
Xylem Inc. Non-GAAP Reconciliation
EBITDA and Adjusted EBITDA by Quarter
Applied Water
($ Millions)
2011 |
 Non-GAAP Reconciliation: Guidance
32
Illustration of Mid Point Guidance
2012 Guidance
FY '11
FY '12
As Reported
Adjustments
Adjusted
Adjustments
Normalized
As Projected
Adjustments
Adjusted
Total Revenue
3,803
3,803
3,803
3,800
3,800
Segment Operating Income
503
29
a
532
(10)
d
522
516
25
h,i
541
Segment Operating Margin
13.2%
14.0%
13.7%
13.6%
14.2%
Corporate Expense
108
(58)
b
50
18
e
68
68
(15)
h
53
Operating Income
395
87
482
(28)
454
448
40
488
Operating Margin
10.4%
12.7%
11.9%
11.8%
12.8%
Interest Expense
(17)
(17)
(39)
f
(56)
(54)
(54)
Other Non-Operating Income (Expense)
5
5
5
(1)
(1)
Income before Taxes
383
87
470
(67)
403
393
40
433
Provision for Income Taxes
(104)
(8)
c
(112)
16
g
(96)
(99)
(7)
j
(106)
Net Income
279
79
358
(51)
307
294
33
327
Diluted Shares
185.3
185.3
186.2
186.2
Diluted EPS
1.50
$
0.43
$
1.93
$
(0.27)
$
1.66
1.58
0.18
1.76
a
One time separation costs incurred at the segment level
b
One time separation costs incurred at the corporate level
c
Net tax impact of above items, plus the addition of 2011 special
tax items
d
Incremental stand alone costs to be incurred in 2012 at the segment level ($10M)
e
Incremental stand alone costs to be incurred in 2012 at the corporate level ($18M)
f
Incremental interest expense on long-term debt to be incurred in 2012
g
Tax impact of incremental interest expense and stand alone costs
to be incurred in 2012
h
Expected one time separation costs of $5M and $15M to be incurred at the segments and
headquarters, respectively. i
Restructuring & realignment costs of $20M to be incurred at the segments.
j
Tax impact of one time separation, restructuring & realignment costs expected to be
incurred in 2012 and tax special items realized through Q3 2012. |
 Non-GAAP Reconciliation: Adj. Operating Income & Margin
33
Mid Point Guidance
2008
2009
2010
2011
2012E
Revenue
3,291
2,849
3,202
3,803
3,800
Operating Income
315
276
388
395
448
Operating Margin
9.6%
9.7%
12.1%
10.4%
11.8%
Restructuring & Realignment
41
31
15
-
20
Separation Costs
-
-
-
87
20
Adjusted Operating
Income 356
307
403
482
488
Adjusted Operating Margin
10.8%
10.8%
12.6%
12.7%
12.8%
Standalone Costs
-
-
-
5
28
Adj. Operating Income, excl.
Standalone Costs 356
307
403
487
516
Adjusted Operating Margin, excl.
Standalone Costs 10.8%
10.8%
12.6%
12.8%
13.6%
Xylem Inc. Non-GAAP Reconciliation
Adjusted Operating Income
($ Millions) |
 34
Phil De Sousa, Investor Relations Officer
(914) 323-5930
Janice Tedesco, Investor Relations Coordinator
(914) 323-5931
NYSE: XYL
http://investors.xyleminc.com |