Attached files
| file | filename |
|---|---|
| 8-K - 8-K - STATE STREET CORP | bancanalystsconference8-k.htm |

Edward J. Resch Executive Vice President and Chief Financial Officer BancAnalysts Association of Boston Conference November 1, 2012 Path to the Future
LIMITED ACCESS Path to the Future Agenda Introduction Long-Term Goals Resilience Amid Global Headwinds Successfully Navigating Headwinds Summary 2

LIMITED ACCESS Forward-Looking Statements This presentation contains forward-looking statements as defined by United States securities laws, including statements relating to our goals and expectations regarding our business, financial and capital condition, including, without limitation our capital ratios under Basel III, results of operations, investment portfolio performance and strategies, the financial and market outlook, governmental and regulatory initiatives and developments, and the business environment. Forward-looking statements are often, but not always, identified by such forward-looking terminology as “plan,” “program,” “expect,” “look,” “believe,” “anticipate,” “estimate,” “seek,” “may,” “will,” “trend,” “target,” and “goal,” or similar statements or variations of such terms. These statements are not guarantees of future performance, are inherently uncertain, are based on current assumptions that are difficult to predict and involve a number of risks and uncertainties. Therefore, actual outcomes and results may differ materially from what is expressed in those statements, and those statements should not be relied upon as representing our expectations or beliefs as of any date subsequent to November 1, 2012. Important factors that may affect future results and outcomes include, but are not limited to: the financial strength and continuing viability of the counterparties with which we or our clients do business and to which we have investment, credit or financial exposure, including, for example, the direct and indirect effects on counterparties to the current sovereign debt risks in Europe and other regions; financial market disruptions or economic recession, whether in the U.S., Europe or other regions internationally; increases in the volatility of, or declines in the level of, our net interest revenue, changes in the composition of the assets recorded in our consolidated statement of condition and the possibility that we may be required to change the manner in which we fund those assets; the liquidity of the U.S. and international securities markets, particularly the markets for fixed-income securities and inter-bank credits, and the liquidity requirements of our clients; the level and volatility of interest rates and the performance and volatility of securities, credit, currency and other markets in the U.S. and internationally; the credit quality, credit agency ratings, and fair values of the securities in our investment securities portfolio, a deterioration or downgrade of which could lead to other-than-temporary impairment of the respective securities and the recognition of an impairment loss in our consolidated statement of income; our ability to attract deposits and other low-cost, short-term funding, and our ability to deploy deposits in a profitable manner consistent with our liquidity requirements and risk profile; the manner in which the Federal Reserve and other regulators implement the Dodd-Frank Act, Basel III, European legislation with respect to banking and financial activities and other regulatory initiatives in the U.S. and internationally, including regulatory developments that result in changes to our structure or operating model, increased costs or other changes to the provision of our services; adverse changes in required regulatory capital ratios, whether arising under the Dodd-Frank Act, Basel II or Basel III, or due to changes in regulatory positions or regulations in jurisdictions in which we engage in banking activities; increasing requirements to obtain necessary approvals of the Federal Reserve and our other regulators for the use, allocation or distribution of our capital or for other specific capital actions or programs, including acquisitions, dividends and equity repurchases, without which our growth plans, distributions to shareholders, equity purchase programs or other capital initiatives may be restricted; changes in law or regulation that may adversely affect our, our clients' or our counterparties' business activities and the products or services that we sell, including additional or increased taxes or assessments thereon, capital adequacy requirements and changes that expose us to risks related to compliance; the maintenance of credit agency ratings for our debt and depository obligations as well as the level of credibility of credit agency ratings; delays or difficulties in the execution of our previously announced Business Operations and Information Technology Transformation program, which could lead to changes in our estimates of the charges, expenses or savings associated with the planned program, resulting in increased volatility of our earnings; the results of, and costs associated with, government investigations, litigation, and similar claims, disputes, or proceedings; the possibility that our clients will incur substantial losses in investment pools for which we act as agent, and the possibility of significant reductions in the valuation of assets; adverse publicity or other reputational harm; dependencies on information technology, complexities and costs of protecting the security of our systems and difficulties with protecting our intellectual property rights; our ability to grow revenue, attract and/or retain and compensate highly skilled people, control expenses and attract the capital necessary to achieve our business goals and comply with regulatory requirements; potential changes to the competitive environment, including changes due to regulatory and technological changes, the effects of consolidation, and perceptions of State Street as a suitable service provider or counterparty; potential changes in how clients compensate us for our services, and the mix of services that clients choose from us; the risks that acquired businesses and joint ventures will not achieve their anticipated financial and operational benefits or will not be integrated successfully, or that the integration will take longer than anticipated, that expected synergies will not be achieved or unexpected disynergies will be experienced, that client and deposit retention goals will not be met, that other regulatory or operational challenges will be experienced and that disruptions from the transaction will harm relationships with clients, employees or regulators; the ability to complete acquisitions, divestitures and joint ventures, including the ability to obtain regulatory approvals, the ability to arrange financing as required and the ability to satisfy closing conditions; our ability to recognize emerging needs of clients and to develop products that are responsive to such trends and profitable to the company; the performance of and demand for the products and services we offer, including the level and timing of redemptions and withdrawals from our collateral pools and other collective investment products; and the potential for new products and services to impose additional costs on us and expose us to increased operational risk; our ability to measure the fair value of the investment securities recorded in our consolidated statement of condition; our ability to control operating risks, data security breach risks, information technology systems risks and outsourcing risks, and our ability to protect our intellectual property rights, the possibility of errors in the quantitative models we use to manage our business and the possibility that our controls will prove insufficient, fail or be circumvented; changes in accounting standards and practices; and changes in tax legislation and in the interpretation of existing tax laws by U.S. and non-U.S. tax authorities that affect the amount of taxes due. Other important factors that could cause actual results to differ materially from those indicated by any forward-looking statements are set forth in our 2011 Annual Report on Form 10-K and our subsequent SEC filings. We encourage investors to read these filings, particularly the sections on risk factors, for additional information with respect to any forward-looking statements and prior to making any investment decision. The forward-looking statements contained in this presentation speak only as of the date hereof, November 1, 2012, and we do not undertake efforts to revise those forward-looking statements to reflect events after that date. 3

4 Long-Term Goals

LIMITED ACCESS Long-Term Goals Secular Trends, Financial Goals and Strategy Remain Intact 1 Financial information is presented on an operating, or non-GAAP, basis. For a description of GAAP- and operating-basis results, see the Appendix. Leverage the Power of the Core Franchise Drive New Revenue Growth Through Innovation Optimize Capital Strategy • Globalization • Retirement Savings • Regulation and Complexity Secular Trends Long-Term Annual Financial Goals (Operating Basis1) • Revenue growth of 8% to 12% • Earnings per share growth of 10% to 15% • Return on equity of 12% to 15% 5

6 Resilience Amid Global Headwinds

LIMITED ACCESS Resilience Amid Global Headwinds • Eurozone debt challenges, reduced industrial production and high unemployment exacerbate global uncertainty • Subdued economic outlook is reflected in historically low interest rates in developed markets • Global headwinds continue to affect client behavior – Volatility of global equity markets – Lower cross-border trading, reducing foreign-exchange trading – Less risk taking, affecting growth in international markets – Heightened complexity and increased regulation Current Environment 7

LIMITED ACCESS Resilience Amid Global Headwinds Strategy Strategy Current Priorities Leverage the Power of the Core Franchise • Deepen share in high-growth markets • Continue improvement in client pricing • Drive operating efficiencies through operational transformation and expense management • Execute IT transformation to enable creation of new services Drive New Revenue Growth Through Innovation • Increase Exchange-Traded Fund (ETF) offerings • Expand investment manager operations outsourcing • Enhance derivatives clearing and collateral management initiative • Create new data and information-based services Optimize Capital • Execute current quarterly common stock dividend and share purchase plan • Continue to target common dividend payout ratio of 20% to 25% 8
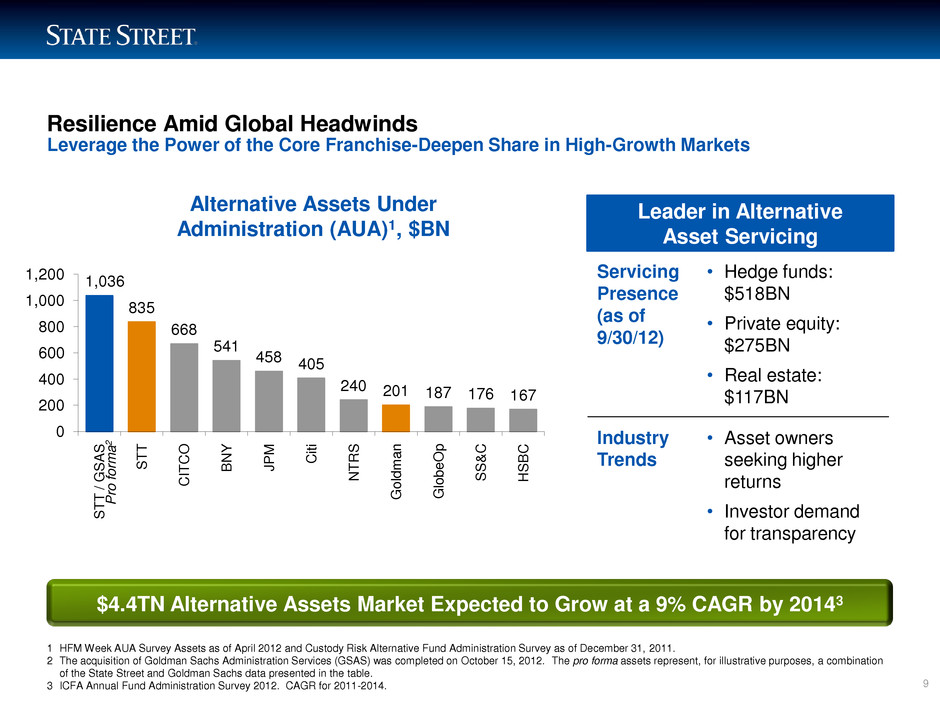
LIMITED ACCESS Resilience Amid Global Headwinds Leverage the Power of the Core Franchise-Deepen Share in High-Growth Markets Leader in Alternative Asset Servicing Alternative Assets Under Administration (AUA)1, $BN 1 HFM Week AUA Survey Assets as of April 2012 and Custody Risk Alternative Fund Administration Survey as of December 31, 2011. 2 The acquisition of Goldman Sachs Administration Services (GSAS) was completed on October 15, 2012. The pro forma assets represent, for illustrative purposes, a combination of the State Street and Goldman Sachs data presented in the table. 3 ICFA Annual Fund Administration Survey 2012. CAGR for 2011-2014. $4.4TN Alternative Assets Market Expected to Grow at a 9% CAGR by 20143 Servicing Presence (as of 9/30/12) • Hedge funds: $518BN • Private equity: $275BN • Real estate: $117BN Industry Trends • Asset owners seeking higher returns • Investor demand for transparency 1,036 835 668 541 458 405 240 201 187 176 167 0 200 400 600 800 1,000 1,200 S T T / G S A S S T T C IT C O B N Y J P M C it i N T R S G o ld m a n G lobeO p S S & C H S B C P ro f or m a 2 9
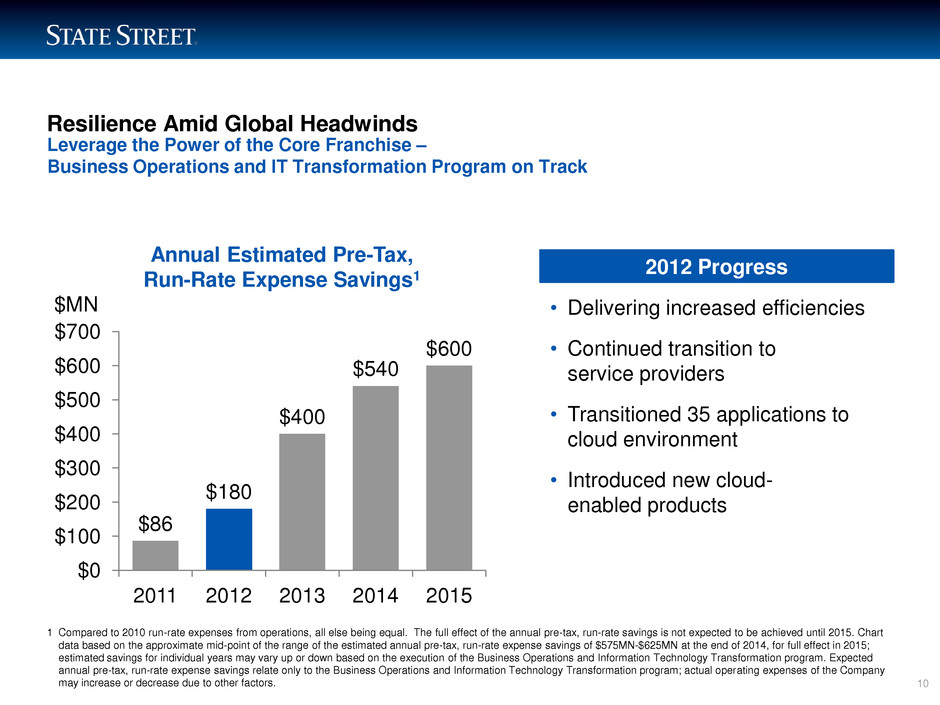
LIMITED ACCESS Resilience Amid Global Headwinds Leverage the Power of the Core Franchise ‒ Business Operations and IT Transformation Program on Track 1 Compared to 2010 run-rate expenses from operations, all else being equal. The full effect of the annual pre-tax, run-rate savings is not expected to be achieved until 2015. Chart data based on the approximate mid-point of the range of the estimated annual pre-tax, run-rate expense savings of $575MN-$625MN at the end of 2014, for full effect in 2015; estimated savings for individual years may vary up or down based on the execution of the Business Operations and Information Technology Transformation program. Expected annual pre-tax, run-rate expense savings relate only to the Business Operations and Information Technology Transformation program; actual operating expenses of the Company may increase or decrease due to other factors. $86 $180 $400 $540 $600 $0 $100 $200 $300 $400 $500 $600 $700 2011 2012 2013 2014 2015 Annual Estimated Pre-Tax, Run-Rate Expense Savings1 2012 Progress • Delivering increased efficiencies • Continued transition to service providers • Transitioned 35 applications to cloud environment • Introduced new cloud- enabled products $MN 10
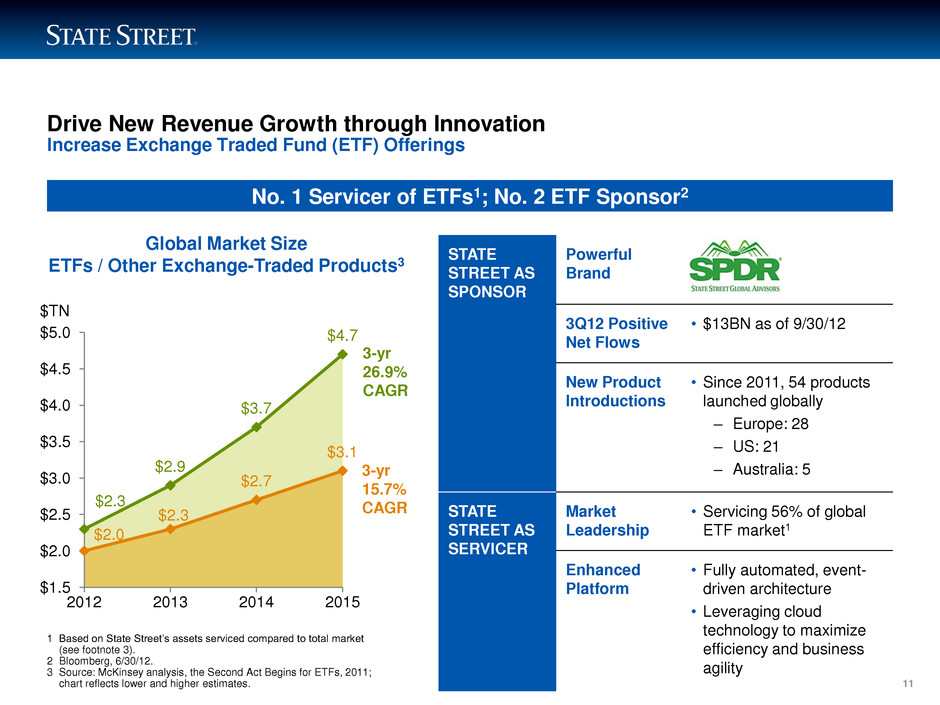
LIMITED ACCESS $2.0 $2.3 $2.7 $3.1 $2.3 $2.9 $3.7 $4.7 $1.5 $2.0 $2.5 $3.0 $3.5 $4.0 $4.5 $5.0 2012 2013 2014 2015 1 Based on State Street’s assets serviced compared to total market (see footnote 3). 2 Bloomberg, 6/30/12. 3 Source: McKinsey analysis, the Second Act Begins for ETFs, 2011; chart reflects lower and higher estimates. Drive New Revenue Growth through Innovation Increase Exchange Traded Fund (ETF) Offerings STATE STREET AS SPONSOR Powerful Brand 3Q12 Positive Net Flows • $13BN as of 9/30/12 New Product Introductions • Since 2011, 54 products launched globally ‒ Europe: 28 ‒ US: 21 ‒ Australia: 5 STATE STREET AS SERVICER Market Leadership • Servicing 56% of global ETF market1 Enhanced Platform • Fully automated, event- driven architecture • Leveraging cloud technology to maximize efficiency and business agility $TN Global Market Size ETFs / Other Exchange-Traded Products3 No. 1 Servicer of ETFs1; No. 2 ETF Sponsor2 3-yr 26.9% CAGR 3-yr 15.7% CAGR 11

LIMITED ACCESS Resilience Amid Global Headwinds Drive New Revenue Growth Through Innovation ‒ Investment Manager Operations Outsourcing Global Middle Office Outsourced Assets, $TN 6/30/121 $TN 1 Scrip Issue Global Report (9/2012). 2 PwC 15th Global CEO Survey, Asset Management Industry Insights, 2012. State Street Highlights • Capitalizing on growing demand for middle-office outsourcing ‒ 40% of global asset managers plan to outsource a key business function in 20132 • Multi-asset class capability fueled by integrated global servicing platform • Clients include AXA Investment Managers, Alliance Bernstein, PIMCO, Lloyds Banking Group, Lazard, Investec Asset Management and SSgA • Continue to enhance platform with new capabilities: collateral tracking, data and analytics and derivative servicing $8.8 $1.6 $1.4 $1.3 $0.7 $0.7 $0.3 $0 $2 $4 $6 $8 $10 STT BNY BBH NTRS JPM CITI BNP 12

LIMITED ACCESS Resilience Amid Global Headwinds • Return capital to shareholders in the form of dividends and share purchases – 2012 CCAR stress test: Highest tier 1 common ratio of the 19 banks tested under stress by the Federal Reserve1 – YTD: Paid three quarterly common share dividends of $0.24 per common share – YTD: Repurchased approximately 22.5MN common shares at a total cost of $960MN through September 30, 2012 under the $1.8BN share purchase program announced in March 2012 and effective through March 2013 • Plan to manage capital to achieve a 10% tier 1 common ratio under Basel III – Prudent management of capital due to regulatory uncertainty – Consistent with targeted long-term annual operating-basis ROE goal Optimize Capital Returning Capital to Shareholders is a Priority 1 Board of Governors of the Federal Reserve System, “Comprehensive Capital Analysis and Review 2012: Methodology and Results for Stress Scenario Projections”, 3/13/12. 13

14 Successfully Navigating Headwinds

LIMITED ACCESS Successfully Navigating Headwinds Summary of 3Q 2012 Operating-Basis (Non-GAAP) Financial Results1 % Change $ in millions, except per share data Q3 ’12 Q2 ’12 Q3 ’11 Revenue $2,348 (3.2)% (2.7)% Expenses $1,664 (3.7)% (2.9)% EPS $0.99 (2.0)% 3.1% ROE 9.6% (70) bps (20) bps Pre-Tax Operating Margin 29.1% 30 bps 10 bps Average Diluted Shares Outstanding2 480.0 488.5 494.8 1 Results presented on an operating basis, a non-GAAP presentation. Refer to the addendum included with this presentation for explanations of our non-GAAP financial measures and for reconciliations of our operating-basis financial information. 2 For the quarters ended September 30, 2012, June 30, 2012 and September 30, 2011. 3 Operating leverage is defined as the rate of growth of total revenue less the rate of growth of expenses, each as determined on an operating basis. Achieved Positive Operating Leverage3 15
LIMITED ACCESS Successfully Navigating Headwinds • Business Operations and Information Technology Transformation program on track – Successful use of global locations to improve operating efficiency, enhance service and reduce cost • Headcount controlled and actively monitored – Expect compensation-to-revenue ratio to be pressured due primarily to weak trading services revenue • Continued focus on controlling “other expenses” line Expense Management Highlights 16
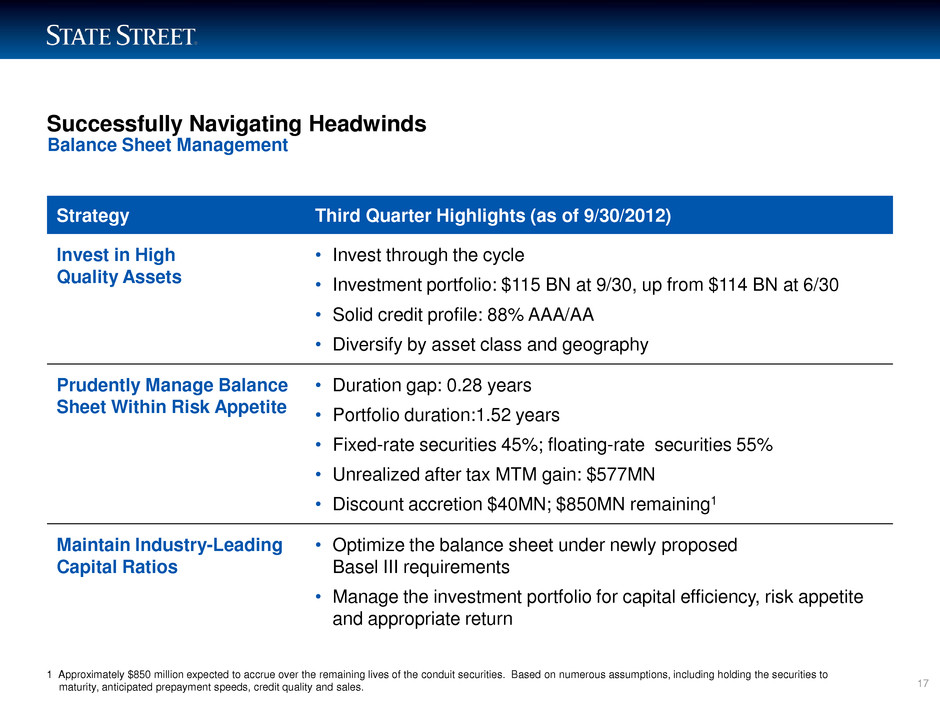
LIMITED ACCESS Successfully Navigating Headwinds Balance Sheet Management Strategy Third Quarter Highlights (as of 9/30/2012) Invest in High Quality Assets • Invest through the cycle • Investment portfolio: $115 BN at 9/30, up from $114 BN at 6/30 • Solid credit profile: 88% AAA/AA • Diversify by asset class and geography Prudently Manage Balance Sheet Within Risk Appetite • Duration gap: 0.28 years • Portfolio duration:1.52 years • Fixed-rate securities 45%; floating-rate securities 55% • Unrealized after tax MTM gain: $577MN • Discount accretion $40MN; $850MN remaining1 Maintain Industry-Leading Capital Ratios • Optimize the balance sheet under newly proposed Basel III requirements • Manage the investment portfolio for capital efficiency, risk appetite and appropriate return 1 Approximately $850 million expected to accrue over the remaining lives of the conduit securities. Based on numerous assumptions, including holding the securities to maturity, anticipated prepayment speeds, credit quality and sales. 17
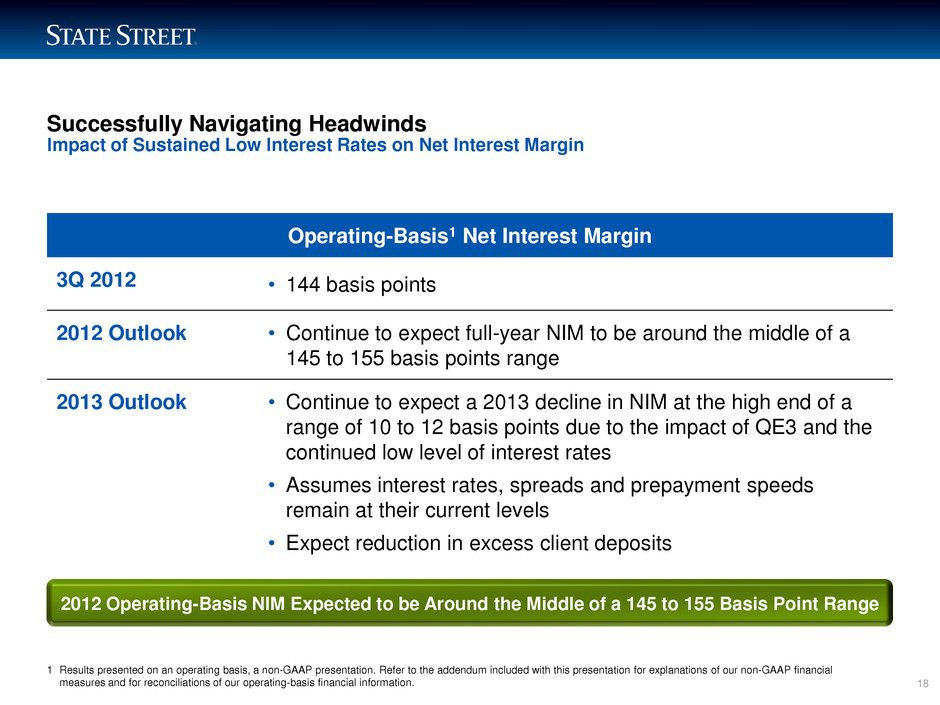
LIMITED ACCESS Successfully Navigating Headwinds Impact of Sustained Low Interest Rates on Net Interest Margin Operating-Basis1 Net Interest Margin 3Q 2012 • 144 basis points 2012 Outlook • Continue to expect full-year NIM to be around the middle of a 145 to 155 basis points range 2013 Outlook • Continue to expect a 2013 decline in NIM at the high end of a range of 10 to 12 basis points due to the impact of QE3 and the continued low level of interest rates • Assumes interest rates, spreads and prepayment speeds remain at their current levels • Expect reduction in excess client deposits 2012 Operating-Basis NIM Expected to be Around the Middle of a 145 to 155 Basis Point Range 1 Results presented on an operating basis, a non-GAAP presentation. Refer to the addendum included with this presentation for explanations of our non-GAAP financial measures and for reconciliations of our operating-basis financial information. 18
LIMITED ACCESS Successful Navigating Headwinds • Achieving solid performance amid headwinds – Solid core asset servicing and asset management revenue; good new business growth and strong pipeline – Market-driven revenues under pressure due to weak environment, client risk aversion and weak trading activity • Managing expenses aggressively – Executing on Business Operations and Information Technology Transformation program – Controlling costs firm-wide • Maintaining a strong capital position and returning capital to shareholders Key Takeaways 19

20 Summary

21 Path to the Future Globalization Retirement Savings Regulation and Complexity Long-Term Annual Operating-Basis1 Goals: Revenue Growth 8% ‒ 12% EPS Growth 10% ‒ 15% ROE 12% ‒ 15% 1 Financial information is presented on an operating, or non-GAAP, basis. For a description of GAAP- and operating-basis results, see the Appendix. Committed to Delivering Long-Term Shareholder Value Leverage the Power of the Core Franchise Drive New Revenue Growth Through Innovation Optimize Capital

LIMITED ACCESS 22

LIMITED ACCESS 23
LIMITED ACCESS 24 Appendix The foregoing presentation includes financial information presented on a GAAP basis as well as on a non-GAAP, or “operating” basis, in addition to other measures not presented in accordance with GAAP and used in the calculation of identified capital ratios. Management measures and compares certain financial information on an operating basis, as it believes that this presentation supports meaningful comparisons from period to period and the analysis of comparable financial trends with respect to State Street’s normal ongoing business operations. Management believes that operating-basis financial information, which reports revenue from non-taxable sources on a fully taxable-equivalent basis and excludes the impact of revenue and expenses outside of the normal course of business, facilitates an investor’s understanding and analysis of State Street’s underlying financial performance and trends in addition to financial information prepared and reported in accordance with GAAP. Non-GAAP financial measures should be considered in addition to, not as a substitute for or superior to, financial measures determined in accordance with GAAP.

LIMITED ACCESS 25 Q3 2012 Q3 2012 vs. vs. (Dollars in millions, except per share amounts) Q2 2012 Q3 2011 Total Revenue: Total revenue, GAAP basis $ 2,356 $ 2,423 $ 2,427 Add: Tax-equivalent adjustment not included in reported results 32 31 32 Loss on sale of Greek investment securities - 46 - Less: Discount accretion related to former conduit securities (40) (74) (46) Total revenue, operating basis (1) (2) $ 2,348 $ 2,426 $ 2,413 (3.2) % (2.7) % Expenses: Total expenses, GAAP basis $ 1,415 $ 1,772 $ 1,798 Add: Benefit related to claims associated with Lehman bankruptcy 362 - - Less: Provision for litigation settlement expenses and other costs (85) (7) - Acquisition costs (13) (15) (20) Restructuring charges (15) (22) (65) Total expenses, operating basis (1) (2) $ 1,664 $ 1,728 $ 1,713 (3.7) (2.9) Net Interest Revenue: Net interest revenue, GAAP basis $ 619 $ 672 $ 578 Add: Tax-equivalent adjustment not included in reported results 32 31 32 Less: Discount accretion related to former conduit securities (40) (74) (46) Net interest revenue, operating basis $ 611 $ 629 $ 564 (2.9) 8.3 Net interest margin (3): Net interest margin, fully taxable-equivalent basis 1.53 % 1.72 % 1.56 % Net effect of non-operating adjustments (0.09) (0.18) (0.12) Net interest margin, operating basis 1.44 % 1.54 % 1.44 % (10) bps - STATE STREET CORPORATION RECONCILIATIONS OF OPERATING-BASIS (NON-GAAP) FINANCIAL INFORMATION In addition to presenting State Street’s financial results in conformity with GAAP, management also presents results on a non-GAAP, or "operating" basis, in order to highlight comparable financial trends and other characteristics with respect to State Street’s ongoing business operations from period to period. Refer to the preceding page of this Appendix for further information concerning our use of non-GAAP financial measures. The following tables reconcile operating-basis financial information presented in the foregoing to financial information prepared and reported in conformity with GAAP. % ChangeQuarters Ended (3) For the quarters ended September 30, 2012, June 30, 2012 and September 30, 2011, respectively, net interest margin represents annualized fully taxable-equivalent net interest revenue of $651 million, $672 million and $578 million (GAAP-basis net interest revenue of $619 million, $672 million and $578 million plus tax-equivalent adjustments of $32 million, $31 million and $32 million, respectively) as a percentage of total average interest-earning assets for the periods presented. (2) For the quarters ended September 30, 2012 and 2011, positive operating leverage in the year-over-year comparison was approximately 20 basis points, based on a decrease in total operating-basis revenue of 2.7% and a decrease in total operating-basis expenses of 2.9%. June 30, September 30, 2012 2011 September 30, 2012 (1) For the quarters ended September 30, 2012 and June 30, 2012, positive operating leverage in the quarter-over-quarter comparison was approximately 50 basis points, based on a decrease in total operating-basis revenue of 3.2% and a decrease in total operating-basis expenses of 3.7%.

LIMITED ACCESS 26 Q3 2012 Q3 2012 vs. vs. (Dollars in millions, except per share amounts) Q2 2012 Q3 2011 Pre-Tax Operating Margin(4): Income before income tax expense, GAAP basis $ 941 $ 651 $ 629 Net adjustments to revenue (8) 3 (14) Net adjustments to expenses (249) 44 85 Income before income tax expense, operating basis $ 684 $ 698 $ 700 Pre-Tax Operating Margin 29.1 % 28.8 % 29.0 % 30 bps 10 bps Diluted Earnings per Common Share: Diluted earnings per common share, GAAP basis $ 1.36 $ .98 $ 1.10 Add: Loss on sale of Greek investment securities - .06 - Provision for litigation settlement expenses and other costs .11 .01 - Acquisition costs .02 .02 .02 Restructuring charges .02 .03 .08 Less: Benefit related to claims associated with Lehman bankruptcy (.46) - - Effect on income tax rate of non-operating adjustments (.01) - - Discount accretion related to former conduit securities (.05) (.09) (.06) Discrete tax benefit related to former conduit securities - - (.18) Diluted earnings per common share, operating basis $ .99 $ 1.01 $ .96 (2.0) % 3.1 % Return on Average Common Equity: Return on average common equity, GAAP basis 13.3 % 10.0 % 11.2 % Add: Loss on sale of Greek investment securities - 0.6 - Provision for litigation settlement expenses and other costs 1.0 0.1 - Acquisition costs 0.2 0.2 0.2 Restructuring charges 0.2 0.3 0.8 Less: Benefit related to claims associated with Lehman bankruptcy (4.4) - - Effect on income tax rate of non-operating adjustments (0.2) - - Discount accretion related to former conduit securities (0.5) (0.9) (0.6) Discrete tax benefit related to former conduit securities - - (1.8) Return on average common equity, operating basis 9.6 % 10.3 % 9.8 % (70) bps (20) bps (4) Represents income before income tax expense as a percentage of total revenue. September 30, June 30, September 30, 2012 2012 2011 STATE STREET CORPORATION RECONCILIATIONS OF OPERATING-BASIS (NON-GAAP) FINANCIAL INFORMATION (CONTINUED) Quarters Ended % Change
