Attached files
| file | filename |
|---|---|
| EX-99.1 - PRESS RELEASE AND EARNINGS RELEASE ATTACHMENTS - EXELON GENERATION CO LLC | d431480dex991.htm |
| 8-K - 8-K - EXELON GENERATION CO LLC | d431480d8k.htm |
 Earnings Conference Call
3
rd
Quarter 2012
November 1
, 2012
Exhibit 99.2
st |
 Cautionary Statements Regarding
Forward-Looking Information
1
2012 3Q Earnings Release Slides
2012 3Q Earnings Release Slides
This presentation contains certain forward-looking statements within the
meaning of the Private Securities Litigation Reform Act of 1995, that
are subject to risks and uncertainties. The factors that could cause actual
results to differ materially from the forward-looking statements made by
Exelon Corporation, Commonwealth Edison Company, PECO Energy Company,
Baltimore Gas and Electric Company and Exelon Generation Company, LLC
(Registrants) include those factors discussed herein, as well as the items discussed in (1)
Exelon’s 2011 Annual Report on Form 10-K in (a) ITEM 1A. Risk Factors,
(b) ITEM 7. Management’s Discussion and Analysis of Financial
Condition and Results of Operations and (c) ITEM 8. Financial Statements
and Supplementary Data: Note 18; (2) Constellation Energy Group’s 2011 Annual Report on Form
10-K in (a) ITEM 1A. Risk Factors, (b) ITEM 7. Management’s Discussion
and Analysis of Financial Condition and Results of Operations and (c)
ITEM 8. Financial Statements and Supplementary Data: Note 12; (3) the
Registrant’s Second Quarter 2012 Quarterly Report on Form 10-Q in (a)
Part II, Other Information, ITEM 1A. Risk Factors; (b) Part 1, Financial
Information, ITEM 2. Management’s Discussion and Analysis of Financial
Condition and Results of Operations and (c) Part I, Financial Information, ITEM
1. Financial Statements: Note 16; and (4) other factors discussed in
filings with the SEC by the Registrants. Readers are cautioned not to
place undue reliance on these forward-looking statements, which apply only
as of the date of this presentation. None of the Registrants undertakes
any obligation to publicly release any revision to its forward-
looking statements to reflect events or circumstances after the date of this
presentation.
|
 2012 3Q Earnings Release Slides
2
3Q Update
•
Strong 3Q financial performance
Operating
earnings
of
$0.77/share,
above
$0.65
-
$0.75/share
guidance
range
•
Expect 2012 full year operating earnings of $2.75 -
$2.95/share
Guidance increase driven by year-to-date financial performance and ICC
Rehearing Order
•
Merger is working
Expect
to
achieve
$170M
in
merger
related
O&M
synergies
for
2012
and
$550M
run
rate synergies starting in 2014
Includes additional $50M of O&M reductions starting in 2014
Expect to close Maryland asset divestiture in 4Q 2012
Benefiting from well-matched generation and load footprint
Integrated operations are seamless |
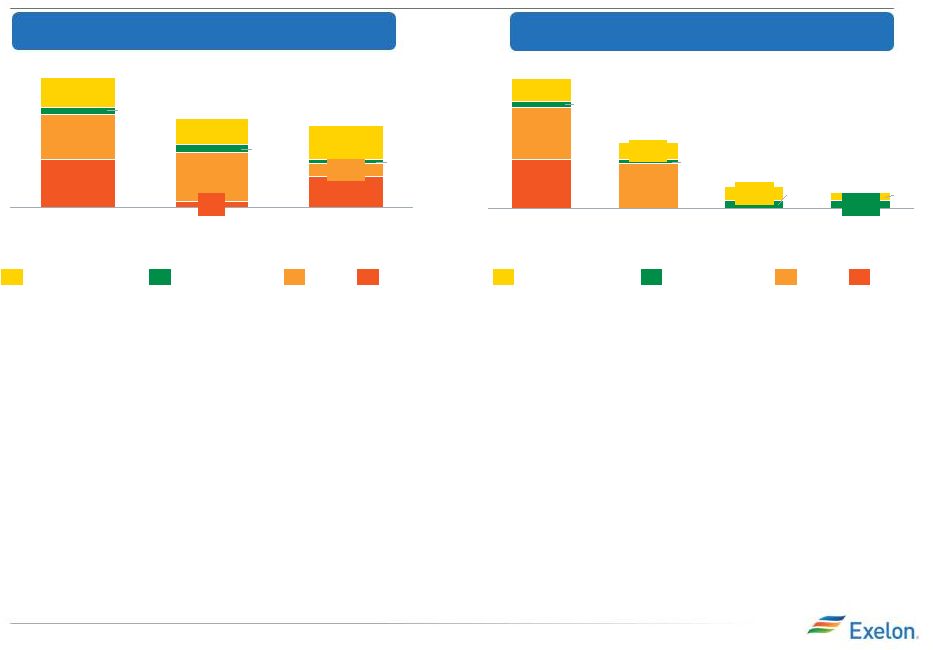
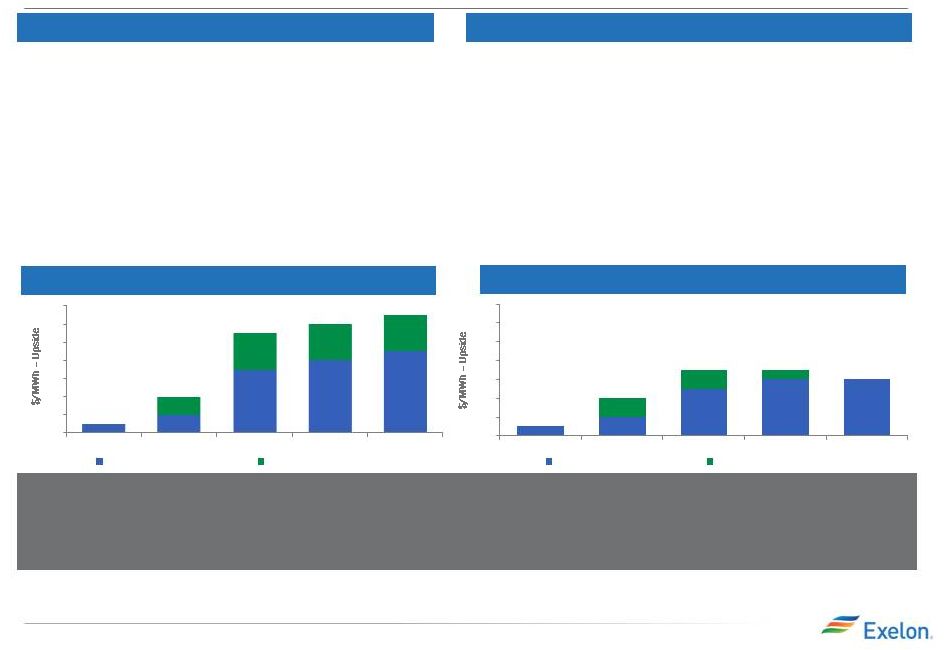 Market Fundamentals: Upside in Power Prices
3
Medium & Long Term (2014+)
Market Dynamics
•
Low
gas
prices
and
MATS
(4)
rule
are
major
drivers
of
coal
retirements
•
~42
GW
of
coal
retirements
expected
(2)
.
Includes
~27
GW
of
retirements in 2014-2016
•
Internal view of $3-6/MWh upside in power prices not currently
reflected in forward prices
•
Over 40% open in 2014, over 75% open in 2015 and mostly open in
2016 and beyond
•
Use of cross-commodity hedges leaves even more upside to heat rate
expansion
Expected upside is the result of plant retirements, higher operating costs for
compliance with environmental standards and a continued disconnect
between heat rates and gas prices
PJM NiHub
ATC Power
(Forecast vs
Market)
(5)
-
1
2
3
4
5
6
7
2013
2014
2015
2016
2017
Retirement/Environmental
Market Discount/Other
PJM West Hub ATC Power (Forecast vs
Market)
(5)
-
1
2
3
4
5
6
7
2013
2014
2015
2016
2017
Retirement/Environmental
Market Discount/Other
(1)
Cross State Air Pollution Rule.
(2)
Retirements estimate is for the Eastern Interconnect as per Exelon’s
internal
projections.
(3)
Portfolio hedge percentages are shown as of 9/30/12.
(5)
Mercury and Air Toxics Standards.
(6)
Upside figures are rounded to the nearest $0.50/MWh and are based on 9/30/12
pricing.
Note: Internal views assume
normal weather patterns.
Market Dynamics
•
No
major
impact
on
power
prices
from
CSAPR
(1)
being
vacated
•
~15 GW of retirements expected
(2)
•
Volatile heat rates in 2012 due to volatile gas prices and
weather
•
Fully hedged in 2012 and greater than 85% hedged in 2013
Current & Near Term (2012/2013)
2012 3Q Earnings Release Slides
Portfolio
Portfolio
Impact
(3)
Impact
(3) |
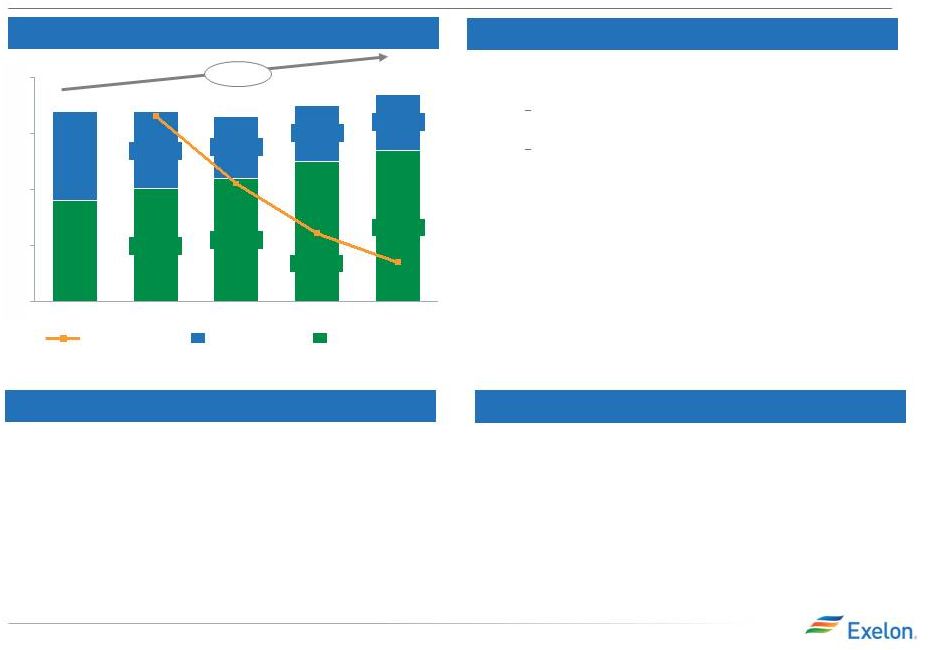 4
Exelon Generation: Load Serving Update
2012 3Q Earnings Release Slides
Strategy
•
Serve new customers as existing markets grow
and new markets open
Retail expected to grow at ~11% CAGR for 2011-
2015
Wholesale expected to remain static starting in
2013
•
Improve market share in existing markets
•
Cross sell suite of products to existing
customers to create higher retention
•
Leverage operational efficiency and national
footprint
2012E
30-40%
60-70%
165
175
2013E
25-35%
185
2015E
2014E
20-30%
170
55-65%
35-45%
2011A
170
90
80
Wholesale Load
Total Contracted
Retail Load
Retail & Wholesale Load (TWh)
(1)
65-75%
70-80%
(1)
(2)
(2)
2012 3Q Earnings Release Slides
+9%
0
50
100
150
200
•
Expected load growth of 1% across the U.S.
•
Switched market expected to grow by
approximately 11% in C&I from 2011 to 2015
•
Switched market expected to grow by
approximately 22% in residential from 2011 to
2015
Retail Landscape
•
Recently, the market has been impacted by
increased competition and aggressive pricing
•
Our disciplined approach to pricing has led to a
reduction in expected volumes and margins
•
Various channels to market are available to
optimize our generation
Execution
Numbers and percentages are rounded to the nearest 5.
Index load expected to be 20% to 30% of total forecasted retail load. |
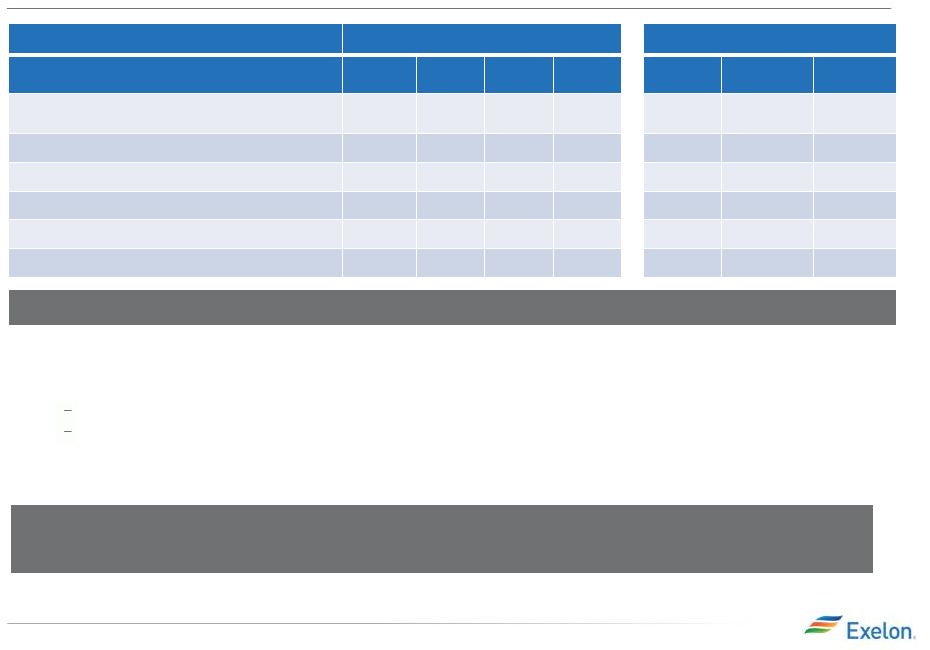 2012 3Q Earnings Release Slides
5
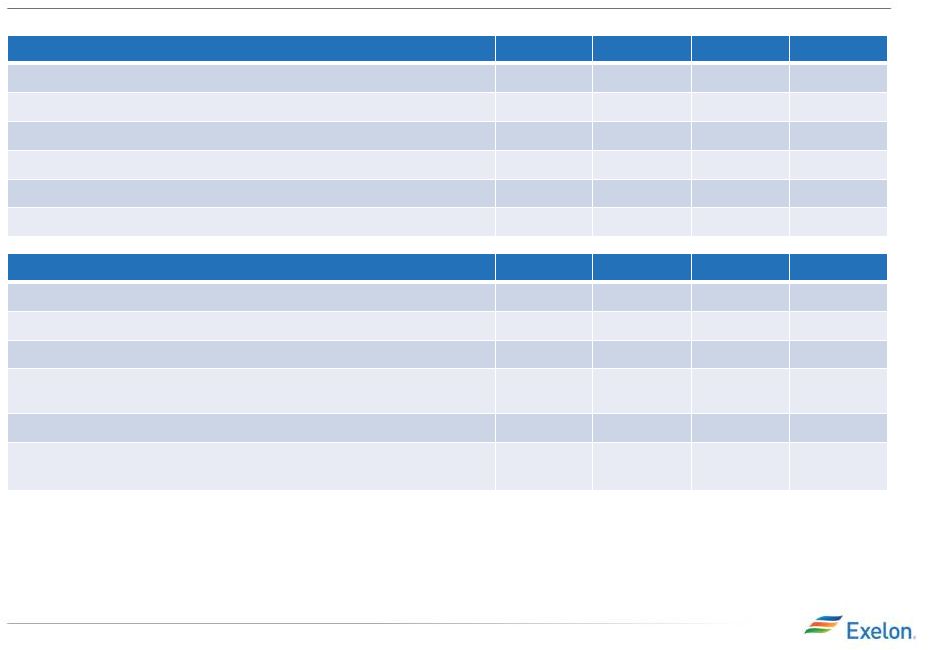
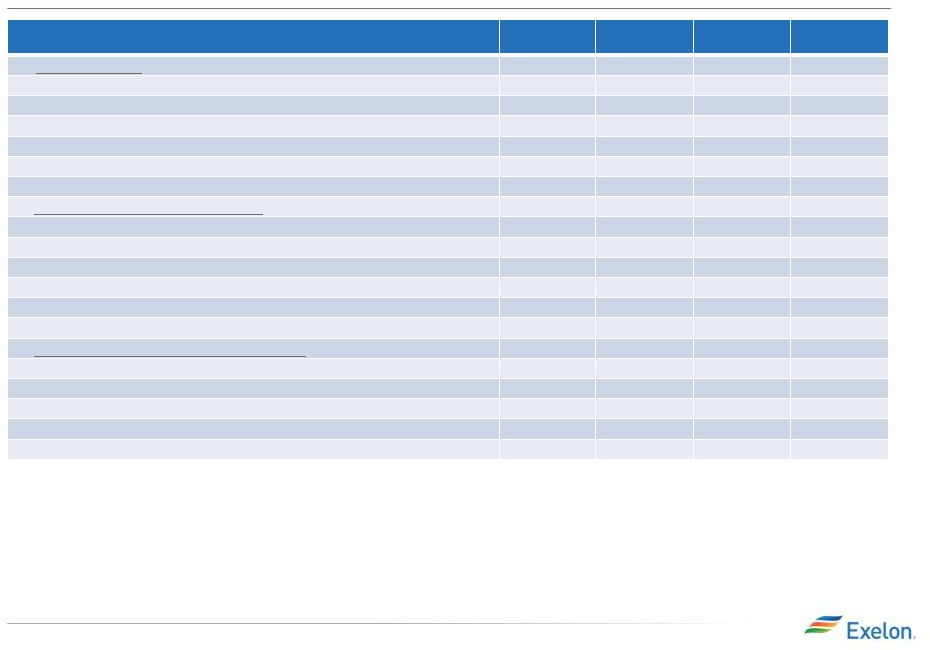
Exelon Generation: Gross Margin Update
September 30, 2012
June 30, 2012
Gross Margin Category ($M)
(1)
2012
(2)
2013
2014
2015
2012
(2)
2013
2014
Open Gross Margin
(2,3,4)
(including South, West, Canada hedged gross margin)
$4,500
$5,750
$6,050
$6,200
$4,450
$5,400
$5,850
Mark-to-Market of Hedges
(4,5)
$3,200
$1,350
$500
$250
$3,100
$1,650
$600
Power New Business / To Go
$50
$500
$750
$950
$100
$550
$850
Non-Power Margins Executed
$300
$150
$100
$50
$250
$100
$100
Non-Power New Business / To Go
$100
$450
$500
$550
$150
$500
$500
Total Gross Margin
$8,150
$8,200
$7,900
$8,000
$8,050
$8,200
$7,900
(1) Gross margin rounded to nearest $50M.
(2)
(3)
Excludes
Maryland
assets
to
be
divested.
(4) Includes
CENG
Joint
Venture.
(5)
Key Highlights of 3Q 2012
•
We
have
optimized
our
hedging
during
this
volatile
period
and
are
back
on
ratable
•
Expect
to
employ
a
variety
of
strategies
to
leverage
ourselves
for
expected
upside
Position our regional portfolios within our Bull/Bear framework to best take
advantage of various market anomalies Further utilize cross-commodity
hedges to protect against further downside in the natural gas market, while remaining
open to our view that heat rates will expand
Our forward view continues to be that there is upside in power prices and our
fleet is leveraged for that upside
September
30
gross
margins
reflect
our
new
expectations
for
wholesale
and
retail
load
volumes
and
margins
Forward
power
market
prices
experienced
sizeable
swings
through
the
3
quarter
th
rd
Stub period calculated by excluding Jan 2012 through mid-March 2012 for
Constellation only. Mark to Market of Hedges assumes mid-point of
hedge percentages. |
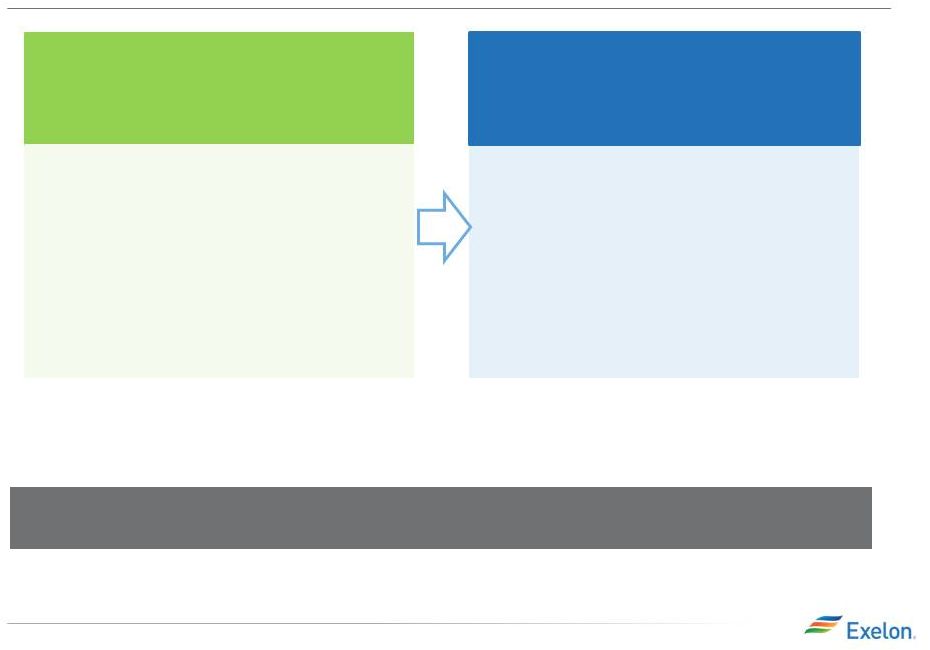 Exelon’s Financial Priorities & Actions
6
2012 3Q Earnings Release Slides
Priorities
•
Number one priority is to maintain
investment grade across all
registrants
•
Second priority is return value to our
shareholders through our dividend
•
Third priority is investing in
sustainable growth projects
Actions
•
Significant reduction in capital
expenditures in 2013-2015
•
Deferral of Limerick and LaSalle
uprates to allow for power market
recovery
•
Removed unidentified renewable
capex
•
Further reduction in O&M of $50M
starting in 2014
2012 3Q Earnings Release Slides
Taking action to meet our top priorities through changes in spending plans
and timing of investments to align with a power market
recovery
|
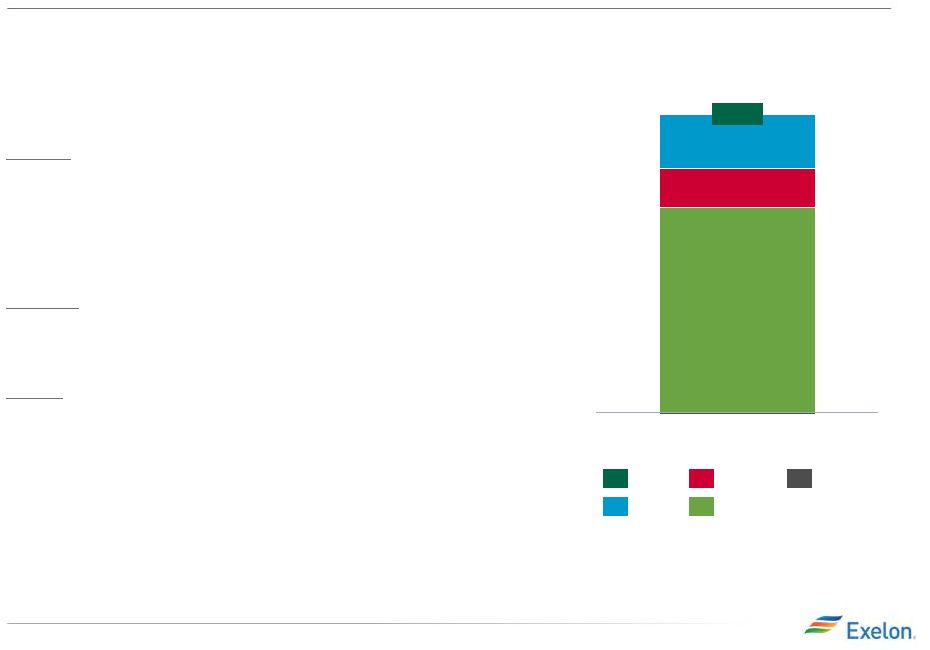
 Updating Exelon Generation Growth Capital Spend
7
•
Nuclear uprates capex reduced by $1,025M in 2012-2015
-
Deferred Limerick EPU project completion from 2017 to 2021
-
Deferred LaSalle EPU project completion another two years from 2018 to
2020 •
Eliminated unidentified wind and solar capex of $1,250M in 2013-2015
-
Renewable projects will be pursued in the future if they meet our internal
parameters •
Peach Bottom EPU project to be completed as planned
-
Strong returns (well above 10% IRR on a go forward basis) under range of
different pricing scenarios -
Invested $55M to date, at ownership level
-
At
ownership,
project
is
smallest
of
the
EPUs
with
total
capex
of
$415M
through
2016;
limited
impact
on
balance sheet
•
Maintained Upstream Gas spend
-
Strong returns (>12% IRR)
-
Off-balance sheet financing
2012 3Q Earnings Release Slides
ExGen Growth Capex (June 2012 Analyst Day)
(in $M)
300
100
50
75
100
2015
200
100
2014
275
175
2013
850
575
225
2012
(1)
1,675
625
675
Wind
Solar
Upstream Gas
Nuclear Uprates
(in $M)
ExGen Growth Capex (3Q 2012)
(1)
2012 CapEx includes CEG from merger close date.
EPU = Extended Power Uprate
400
375
475
50
100
100
425
1,125
2014
175
2013
1,225
75
675
2012
(1)
1,775
650
625
Nuclear Uprates
Upstream Gas
Solar
Wind
2012 3Q Earnings Release Slides |
 2012 3Q Earnings Release Slides
8
ComEd Regulatory Update
•
ICC Rehearing Order (issued 10/3/12) on pension asset, interest rate on cost
reconciliation and average vs. year-end rate base
Reversed
decision
on
pension
asset
by
granting
ComEd
recovery
on
the
cost
of
funding its pension
Upheld the decision to use average rate base (vs. ComEd’s position of
using year end rate base)
Revised the decision on interest on reconciliation balances, granting a rate
equal to the short term debt rate (vs. ComEd’s view of using WACC
rate) •
As a result of the order, ComEd has deferred $450 million of capital
expenditures from 2012-2014 to 2015 and beyond
•
Filed a notice of appeal on 10/4/12 to challenge the interest rate on
reconciliation and average rate base issues plus other items lost in May
2012 order |
 2012 3Q Earnings Release Slides
9
3Q 2012 Operating Results
•
Delivered non-GAAP operating earnings in 3Q of
$0.77/share
(1)
, above guidance expectations,
primarily due to:
ExGen
•
Portfolio optimization of $0.07/share
•
Lower than expected nuclear volume of
$(0.03)/share
ComEd
•
Favorable weather of $0.01/share
PECO
•
Favorable weather of $0.01/share
•
Higher than expected benefit of $0.02/share from
gas distribution tax repairs deduction
3Q 2012
$0.77
$0.53
$0.10
$0.14
$0.00
HoldCo
ExGen
ComEd
PECO
BGE
2012 3Q Results
(1)
Refer to Earnings Release Attachments for additional details and to the
Appendix for a reconciliation of adjusted (non-GAAP) operating EPS to GAAP EPS. |
 2012 Projected Sources and Uses of Cash
10
($ in Millions)
2012 3Q Earnings Release Slides
(1)
Exelon beginning cash balance as of 12/31/11. Excludes counterparty
collateral activity. (2)
Includes $675 million of Constellation net collateral paid to counterparties
prior to merger completion. (3)
Cash Flow from Operations primarily includes net cash flows provided by
operating activities, estimated proceeds from Maryland clean coal fleet divestitures and net cash flows used in
investing activities other than capital expenditures.
(4)
Dividends are subject to declaration by the Board of Directors.
(5)
Excludes PECO’s $225 million Accounts Receivable (A/R) Agreement with Bank
of Tokyo. PECO’s A/R Agreement was extended in accordance with its terms through August 30, 2013.
(6)
“Other”
includes proceeds from options and expected changes in short-term
debt. (7)
Includes cash flow activity from Holding Company, eliminations, and other
corporate entities. Represents Constellation cash flows from merger close through December 31, 2012.
(7)
Beginning Cash Balance
(1)
$550
Cash acquired from Constellation
(2)
150
n/a
n/a
1,375
1,650
Cash Flow from Operations
(3)
250
1,175
900
3,475
5,825
CapEx (excluding other items below):
(425)
(1,225)
(350)
(975)
(3,050)
Nuclear Fuel
n/a
n/a
n/a
(1,150)
(1,150)
Dividend
(4)
(1,725)
Nuclear Uprates
n/a
n/a
n/a
(300)
(300)
Wind
n/a
n/a
n/a
(625)
(625)
Solar
n/a
n/a
n/a
(675)
(675)
Upstream
n/a
n/a
n/a
(75)
(75)
Utility Smart Grid/Smart Meter
(75)
(50)
(75)
n/a
(200)
Net Financing (excluding Dividend):
Debt Issuances
(5)
250
350
350
775
1,725
Debt Retirements
(175)
(450)
(375)
(125)
(1,125)
Project Finance/Federal Financing Bank
Loan
n/a
n/a
n/a
375
375
Other
(6)
25
(25)
(100)
Ending Cash Balance
(1)
$1,100 |
 2012 3Q Earnings Release Slides
11
2012 Earnings Guidance
2012 Prior Guidance
$2.55 -
$2.85
(1)
$0.30 -
$0.40
$0.40
-
$0.50
$0.05
-
$0.15
HoldCo
ExGen
ComEd
PECO
BGE
(1)
2012 Revised Guidance
$2.75 -
$2.95
(1)
$0.45 -
$0.50
$0.40
-
$0.50
$0.05
-
$0.10
HoldCo
ExGen
ComEd
PECO
BGE
+ Impact of ICC Rehearing
Order on ComEd’s earnings
+ Higher than expected RNF
at ExGen in 3Q 2012
$1.75 -
$1.95
$1.85 -
$1.95
Updated
FY
2012
operating
earnings
to
$2.75
-
$2.95/share
2012 guidance includes Constellation Energy and BGE earnings for March 12
– December 31, 2012. Based on expected 2012 average outstanding shares of 819M. Guidance incorporates
preliminary cost estimates of the impact of Hurricane Sandy. Earnings guidance
for OpCos may not add up to consolidated EPS guidance.
Key Drivers of Change
in Full Year Guidance |
 2012 3Q Earnings Release Slides
12
Wrap Up
•
Strong financial performance in 2012; increasing and tightening our full year
2012 earnings guidance to $2.75 -
$2.95/share
•
Expect $3 –
6/MWh upside to materialize in the forward curves in 2013
•
Right platform to take advantage of a power market recovery
•
Investment grade ratings and dividend are our top priorities
•
Timing our investments to align with a power market recovery
Commitment to protect and create shareholder value
|
 13
APPENDIX
2012 3Q Earnings Release Slides |
 14
Exelon Generation Disclosures
September 30, 2012
2012 3Q Earnings Release Slides |
 15
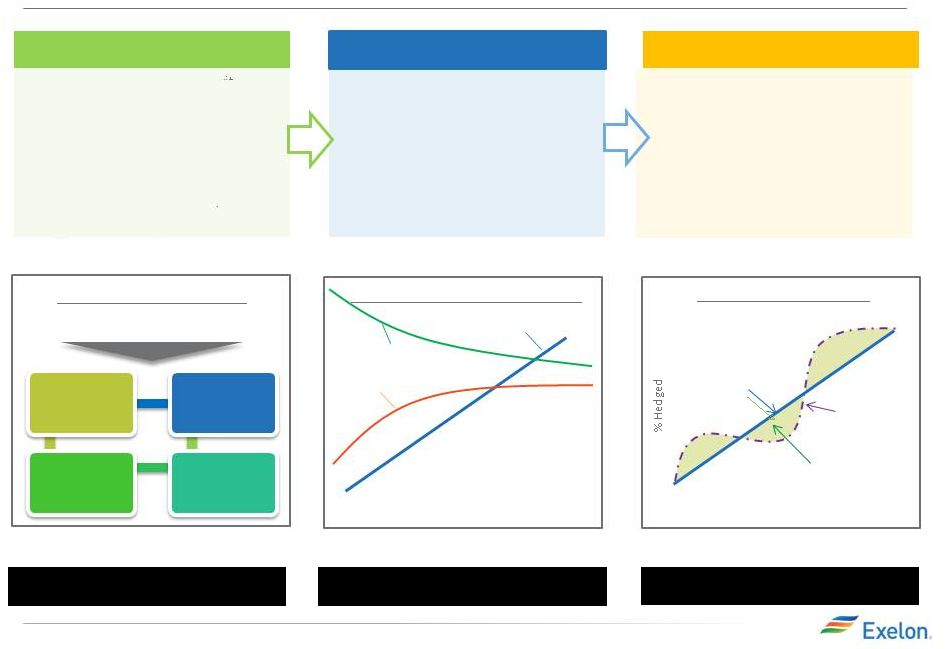
Portfolio Management Strategy
Protect Balance Sheet
Ensure Earnings Stability
Create Value
Align Hedging & Financials
Establishing Minimum Hedge Targets
Capital
Structure
Dividend
Capital &
Operating
Expenditure
Credit Rating
High End of Profit
Low End of Profit
% Hedged
Open Generation
with LT Contracts
Portfolio Management &
Optimization
Portfolio Management Over Time
Exercising Market Views
Purely ratable
Actual hedge %
Market views on timing, product
allocation and regional spreads
reflected in actual hedge %
Strategic Policy Alignment
•Aligns hedging program with
financial policies and financial
outlook
•Establish minimum hedge targets
to meet financial objectives of the
company (dividend, credit rating)
•Hedge enough commodity risk to
meet future cash requirements
under a stress scenario
Three-Year Ratable Hedging
•Ensure stability in near-term cash
flows and earnings
•Disciplined approach to hedging
•Tenor aligns with customer
preferences and market liquidity
•Multiple channels to market that
allow us to maximize margins
•Large open position in outer years
to benefit from price upside
Bull / Bear Program
•Ability to exercise fundamental
market views to create value within
the ratable framework
•Modified timing of hedges versus
purely ratable
•Cross-commodity hedging (heat
rate positions, options, etc.)
•Delivery locations, regional and
zonal spread relationships
2012 3Q Earnings Release Slides |
 16
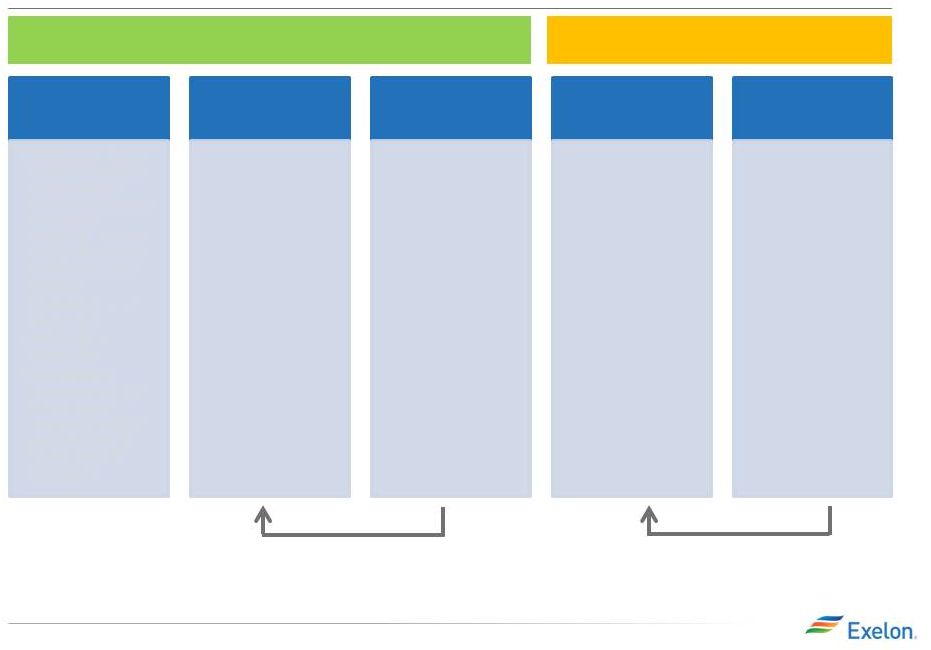
Components of Gross Margin Categories
2012 3Q Earnings Release Slides
2012 3Q Earnings Release Slides
Margins move from new business to MtM of hedges over
the course of the year as sales are executed
Margins move from “Non power new business”
to
“Non power executed”
over the course of the year
Open Gross
Margin
MtM of
Hedges
(2)
“Power”
New
Business
“Non Power”
Executed
“Non Power”
New Business
Gross margin linked to power production and sales
Gross margin from
other business activities
•
MtM of power,
capacity and
ancillary hedges,
including cross
commodity, retail
and wholesale
load transactions
•
Provided directly
at a consolidated
level for five major
regions. Provided
indirectly for each
of the five major
regions via EREP,
reference price,
hedge %, expected
generation
•
Generation Gross
Margin at current
market prices,
including capacity
& ancillary
revenues, nuclear fuel
amortization
and fossils fuels
expense
•
Exploration and
Production
•
PPA Costs & Revenues
•
Provided at a
consolidated level for
all regions (includes
hedged gross margin
for South, West &
Canada
(1)
)
•
Retail, Wholesale
planned electric
sales
•
Portfolio
Management new
business
•
Mid marketing
new business
•
Retail, Wholesale
executed gas sales
•
Load Response
•
Energy Efficiency
•
BGE Home
•
Distributed Solar
•
Retail, Wholesale
planned gas sales
•
Load Response
•
Energy Efficiency
•
BGE Home
•
Distributed Solar
•
Portfolio
Management /
origination fuels
new business
•
Proprietary trading
(3)
(1) Hedged gross margins for South, West & Canada region will be included
with Open Gross Margin, and no expected generation, hedge %, EREP or reference prices provided for this region.
(2) MtM of hedges provided directly for the five larger regions. MtM of hedges
is not provided directly at the regional level but can be easily estimated using EREP, reference price and hedged MWh.
(3) Proprietary trading gross margins will remain within “Non Power”
New Business category and not move to “Non Power” Executed category. |
 17
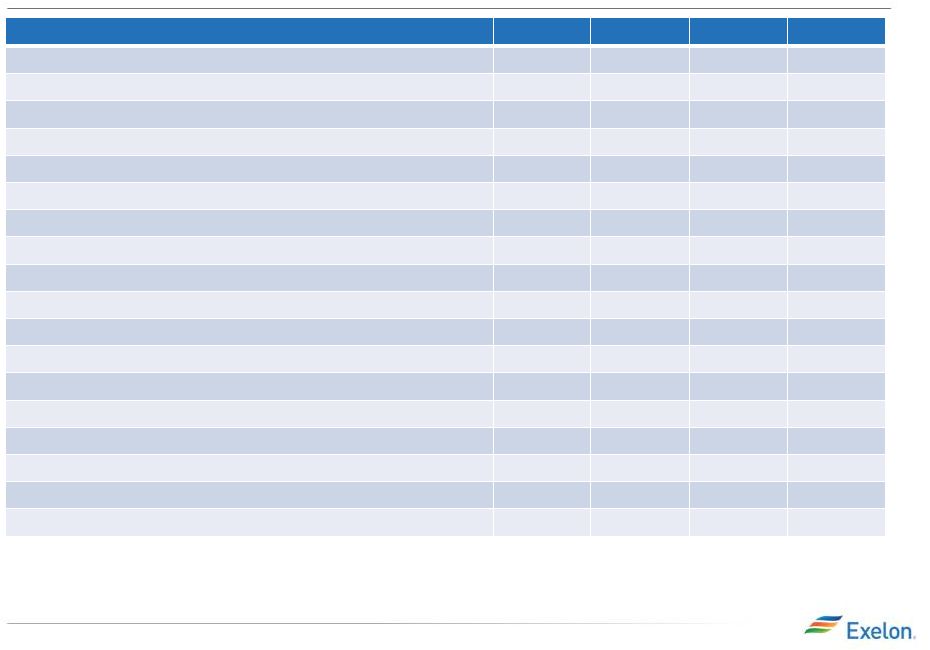
ExGen Disclosures
Gross Margin Category ($M)
(1,2)
2012
(3)
2013
2014
2015
Open Gross Margin
(including South, West & Canada hedged GM)
(4,5)
$4,500
$5,750
$6,050
$6,200
Mark to Market of Hedges
(5,6)
$3,200
$1,350
$500
$250
Power New Business / To Go
$50
$500
$750
$950
Non-Power Margins Executed
$300
$150
$100
$50
Non-Power New Business / To Go
$100
$450
$500
$550
Total Gross Margin
$8,150
$8,200
$7,900
$8,000
Reference Prices
(7)
2012
2013
2014
2015
Henry Hub Natural Gas ($/MMbtu)
$2.77
$3.84
$4.18
$4.37
Midwest: NiHub ATC prices ($/MWh)
$28.95
$30.59
$31.34
$32.32
Mid-Atlantic: PJM-W ATC prices ($/MWh)
$33.93
$38.24
$39.44
$40.77
ERCOT-N ATC Spark Spread ($/MWh)
HSC Gas, 7.2HR, $2.50 VOM
$3.67
$8.37
$8.30
$7.15
New York: NY Zone A ($/MWh)
$30.85
$35.19
$35.98
$36.55
New England: Mass Hub ATC Spark Spread($/MWh)
ALQN Gas, 7.5HR, $0.50 VOM
$6.72
$4.42
$3.79
$4.07
2012 3Q Earnings Release Slides
2012 3Q Earnings Release Slides
(1)
Gross margin does not include revenue related to decommissioning, Exelon
Nuclear Partners and entities consolidated solely as a result of the
application of FIN 46R. (2)
Gross margin rounded to nearest $50M.
(3)
Stub period calculated by excluding Jan 2012 through mid-March 2012 for
Constellation only.
(4)
Excludes Maryland assets to be divested.
(5)
Includes CENG Joint Venture.
(6)
(7)
Based on September 30, 2012 market conditions.
Mark
to
Market
of
Hedges
assumes
mid
-
point
of
hedge
percentages. |
 18
ExGen Disclosures
Generation and Hedges
2012
(1)
2013
2014
2015
Exp. Gen (GWh)
(4)
219,500
218,700
211,400
209,800
Midwest
100,700
97,400
97,500
99,000
Mid-Atlantic
(2,3)
71,800
75,000
72,200
71,800
ERCOT
19,900
18,500
16,900
15,800
New York
(3)
13,000
13,800
10,900
9,300
New England
14,100
14,000
13,900
13,900
% of Expected Generation Hedged
(5)
99-102%
88-91%
56-59%
21-24%
Midwest
99-102%
89-92%
56-59%
20-23%
Mid-Atlantic
(2,3)
99-102%
88-91%
57-60%
24-27%
ERCOT
96-99%
78-81%
53-56%
28-31%
New York
(3)
98-101%
92-95%
61-64%
15-18%
New England
97-100%
89-92%
51-54%
11-14%
Effective Realized Energy Price ($/MWh)
(6)
Midwest
$42.00
$38.00
$35.00
$34.50
Mid-Atlantic
(2,3)
$56.00
$48.00
$47.50
$50.50
ERCOT
(7)
$9.00
$7.50
$5.00
$5.00
New York
(3)
$44.00
$36.00
$35.00
$52.00
New England
(7)
$8.00
$7.00
$4.00
$5.00
2012 3Q Earnings Release Slides
2012 3Q Earnings Release Slides
(1) Stub period calculated by excluding Jan 2012 through mid-March 2012 for
Constellation only. (2) Excludes Maryland assets to be divested (3) Includes CENG Joint Venture. (4) Expected
generation represents the amount of energy estimated to be generated or
purchased through owned or contracted for capacity. Expected generation is based upon a simulated dispatch model
that makes assumptions regarding future market conditions, which are calibrated
to market quotes for power, fuel, load following products, and options. Expected generation assumes 10
refueling outages in 2012 and 2013 and 11 refueling outages in 2014 and 2015 at
Exelon-operated nuclear plants and Salem but excludes CENG. Expected generation assumes capacity
factors of 92.8%, 93.5%, 93.8%, and 93.3% in 2012, 2013, 2014 and 2015 at
Exelon-operated nuclear plants excluding Salem and CENG. These estimates of expected generation in 2012,
2013, 2014 and 2015 do not represent guidance or a forecast of future results
as Exelon has not completed its planning or optimization processes for those years. (5) Percent of expected
generation hedged is the amount of equivalent sales divided by expected
generation. Includes all hedging products, such as wholesale and retail sales of power, options and swaps. Uses
expected value on options. (6) Effective realized energy price is
representative of an all-in hedged price, on a per MWh basis, at which expected generation has been hedged. It is developed by
considering the energy revenues and costs associated with our hedges and by
considering the fossil fuel that has been purchased to lock in margin. It excludes uranium costs and RPM
capacity revenue, but includes the mark-to-market value of capacity
contracted at prices other than RPM clearing prices including our load obligations. It can be compared with the reference
prices used to calculate open gross margin in order to determine the
mark-to-market value of Exelon Generation's energy hedges. (7) Spark spreads shown for ERCOT and New England. |
 19
ExGen Hedged Gross Margin Sensitivities
Gross Margin Sensitivities (With Existing Hedges)
(1, 4)
2012
2013
2014
2015
Henry Hub Natural Gas ($/MMbtu)
(2)
+ $1/MMbtu
$(5)
$55
$400
$780
-
$1/MMbtu
$25
$(15)
$(325)
$(700)
NiHub ATC Energy Price
+ $5/MWh
$(5)
$40
$230
$390
-
$5/MWh
$5
$(35)
$(230)
$(385)
PJM-W ATC Energy Price
(2)
+ $5/MWh
$(5)
$50
$165
$295
-
$5/MWh
$5
$(40)
$(160)
$(285)
NYPP Zone A ATC Energy Price
+ $5/MWh
$5
$15
$35
$45
-
$5/MWh
$(5)
$(15)
$(35)
$(45)
Nuclear Capacity Factor
(3)
+/-
1%
+/-
$10
+/-
$40
+/-
$45
+/-
$45
2012 3Q Earnings Release Slides
2012 3Q Earnings Release Slides
(1) Based on September 30, 2012 market conditions and hedged position. Gas
price sensitivities are based on an assumed gas-power relationship derived from an internal model
that is updated periodically. Power prices sensitivities are derived by
adjusting the power price assumption while keeping all other prices inputs constant. Due to correlation of the
various assumptions, the hedged gross margin impact calculated by aggregating
individual sensitivities may not be equal to the hedged gross margin impact calculated when
correlations between the various assumptions are also considered. (2) Excludes
Maryland assets to be divested. (3) Includes CENG Joint Venture (4) Sensitivities based on
commodity exposure which includes open generation and all committed
transactions.
|
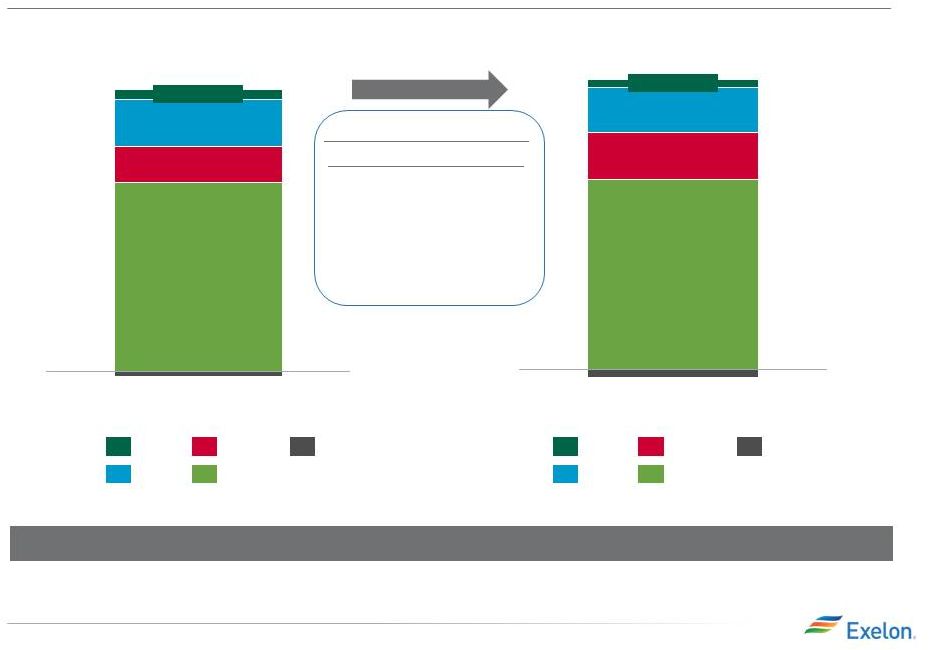
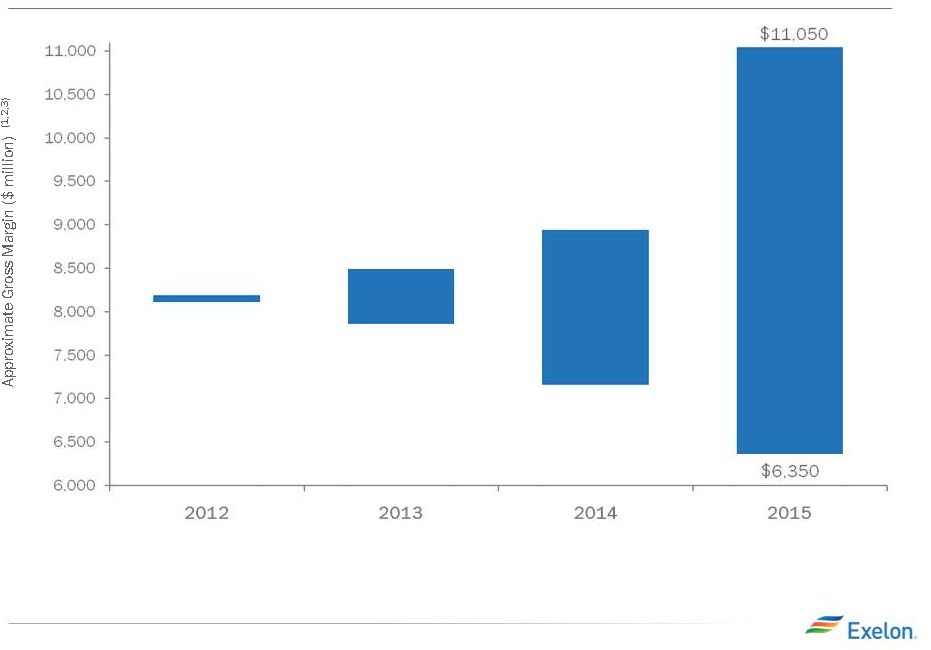 20
Exelon Generation Hedged Gross Margin Upside/Risk
2012 3Q Earnings Release Slides
2012 3Q Earnings Release Slides
(1) Represents an approximate range of expected gross margin, taking into
account hedges in place, between the 5th and 95th percent confidence levels assuming all unhedged
supply is sold into the spot market. Approximate gross margin ranges are
based upon an internal simulation model and are subject to change based upon market inputs, future
transactions and potential modeling changes. These ranges of approximate gross
margin in 2013 and 2014 do not represent earnings guidance or a forecast of future results as
Exelon has not completed its planning or optimization processes for those
years. The price distributions that generate this range are calibrated to market quotes for power, fuel, load
following products, and options as of September 30, 2012 (2) Gross Margin
Upside/Risk based on commodity exposure which includes open generation and all committed
transactions. (3) Excludes Maryland assets to be divested. $8,200
$8,100
$8,500
$7,850
$8,950
$7,150 |
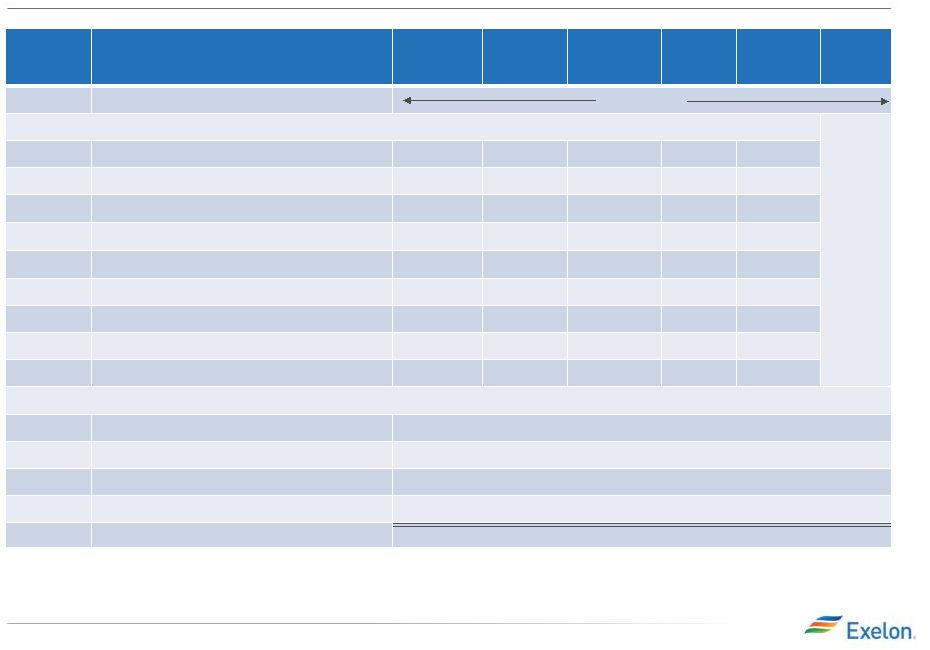 21
Illustrative Example of Modeling Exelon
Generation
2013 Gross Margin
Row
Item
Midwest
Mid-
Atlantic
ERCOT
New
England
New York
South,
West &
Canada
(A)
Start with fleet-wide open gross margin
$5.75 billion
(B)
Expected Generation (TWh)
97.4
75.0
18.5
14.0
13.8
(C)
Hedge % (assuming mid-point of range)
90.5%
89.5%
79.5%
90.5%
93.5%
(D=B*C)
Hedged Volume (TWh)
88.2
67.1
14.7
12.7
12.9
(E)
Effective Realized Energy Price ($/MWh)
$38.00
$48.00
$7.50
$7.00
$36.00
(F)
Reference Price ($/MWh)
$30.59
$38.24
$8.37
$4.42
$35.19
(G=E-F)
Difference ($/MWh)
$7.41
$9.76
($0.87)
$2.58
$0.81
(H=D*G)
Mark-to-market
value
of
hedges
($
million)
(1)
$655 million
$655 million
($15) million
$35 million
$10 million
(I=A+H)
Hedged Gross Margin ($ million)
$7,100 million
(J)
Power New Business / To Go ($ million)
$500 million
(K)
Non-Power Margins Executed ($ million)
$150 million
(L)
Non-
Power New Business / To Go ($ million)
$450 million
(N=I+J+K+L)
Total Gross Margin
$8,200 million
(1) Mark-to-market rounded to the nearest $5 million.
2012 3Q Earnings Release Slides
2012 3Q Earnings Release Slides |
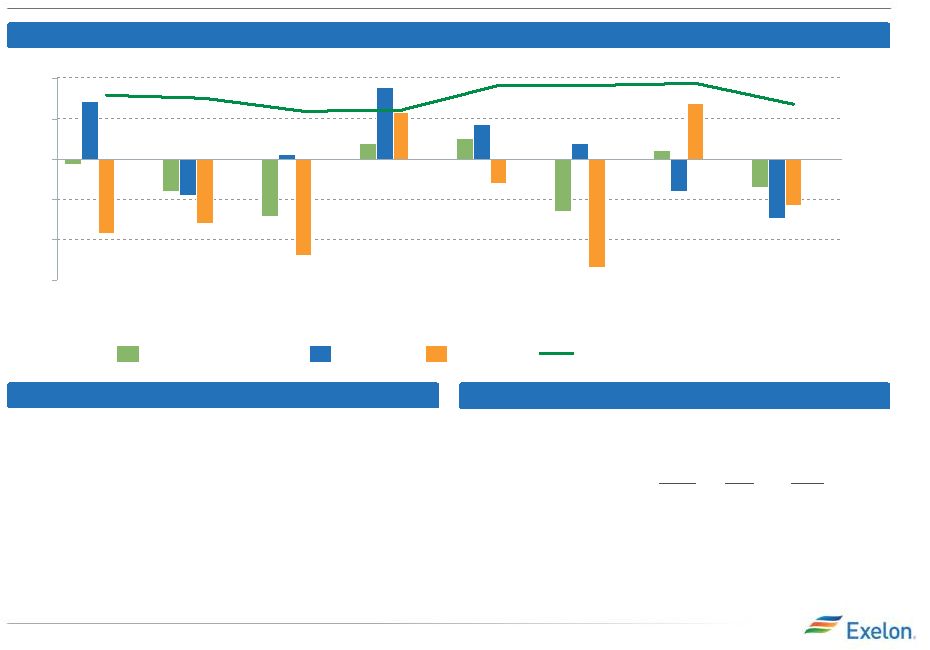 ComEd Load Trends
-3%
-2%
-1%
0%
1%
2%
4Q12
3Q12
2Q12
1Q12
4Q11
3Q11
2Q11
1Q11
Gross Metro Product
Residential
Large C&I
All Customer Classes
2011
3Q12 2012E
(3)
Average Customer Growth
0.4%
0.3%
0.3%
Average Use-Per-Customer
(1.7)%
1.1%
(0.9)%
Total Residential
(1.3)%
1.4% (0.6)%
Small C&I
(0.8)%
(0.1)%
(0.2)%
Large C&I
0.6%
(0.8)%
(0.3)%
All Customer Classes
(0.5)%
0.2%
(0.3)%
Weather-Normalized Electric Load Year-over-Year
Key Economic Indicators
Weather-Normalized Electric Load
(1)
Source: U.S. Dept. of Labor (September 2012) and Illinois
Department of Security (September 2012)
(2)
Source: Global Insight (August 2012)
(3)
Not adjusted for leap year
Chicago
U.S.
Unemployment rate
(1)
8.7%
7.8%
2012 annualized growth in
gross domestic/metro product
(2)
1.7%
2.1% 22
2012 3Q Earnings Release Slides
Notes: C&I = Commercial & Industrial. Global Insight re-stated 2011
GMP amounts in August 2012 so there will be a change since 2Q12 earnings release.
ComEd load activity impacts net income to the extent that it does not result in
an ROE outside of the collar, which ensures that the earned ROE is within 0.5% of the allowed ROE. |
 23
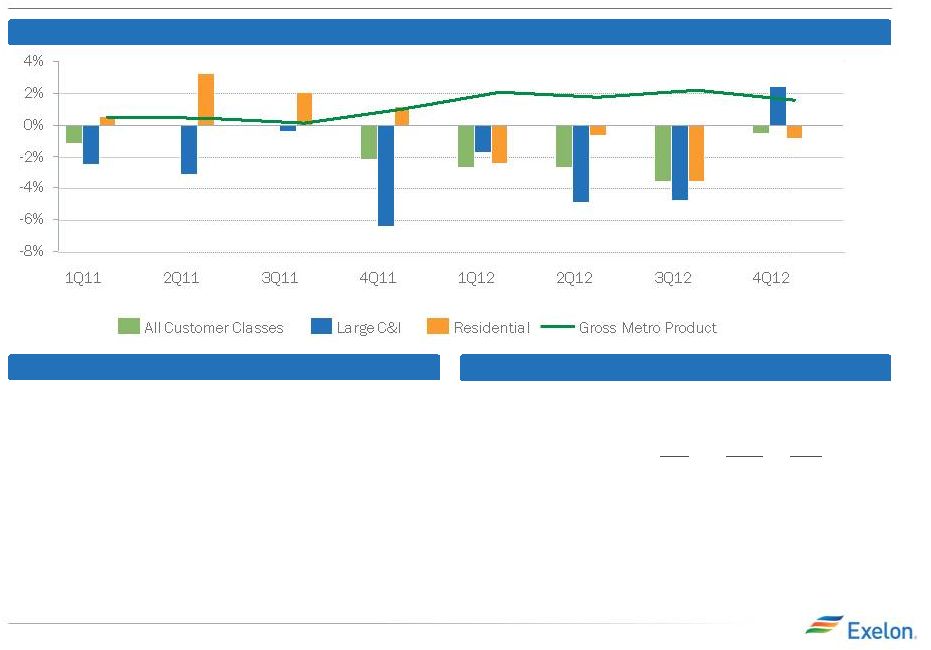
PECO Load Trends
2011
3Q12 2012E
(3)
Average Customer Growth
0.3%
0.3%
0.4%
Average Use-Per-Customer
1.3%
(3.9)%
(2.4)%
Total Residential
1.7%
(3.6)% (2.0)%
Small C&I
(0.7)%
(1.7)%
(3.5)%
Large C&I
(3.3)%
(4.8)%
(2.4)%
All Customer Classes
(0.9)%
(3.6)%
(2.4)%
Weather-Normalized Electric Load Year-over-Year
Key Economic Indicators
Weather-Normalized Electric Load
(1)
Source:
U.S.
Dept.
of
Labor
(Sept
2012)
-
US
US
Dept
of
Labor
prelim.
data
(August
2012)
-
Philadelphia
(2)
Source: Global Insight (August 2012)
(3)
Not adjusted for leap year
Philadelphia
U.S.
Unemployment rate
(1)
8.8%
7.8%
2012 annualized growth in
gross domestic/metro product
(2)
1.9%
2.1% 2012 3Q Earnings Release Slides
Note: C&I = Commercial & Industrial. Global Insight re-stated
2011 GMP amounts in August 2012 so there will be a change since 2Q12 earnings release. |
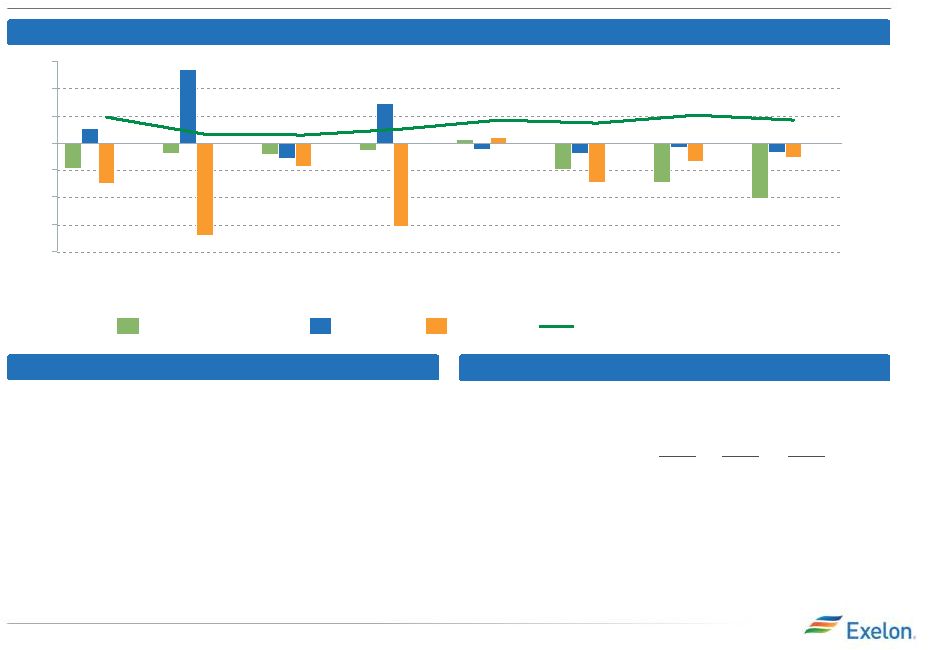 24
BGE Load Trends
-8%
-6%
-4%
-2%
0%
2%
4%
6%
4Q12
3Q12
2Q12
1Q12
4Q11
3Q11
2Q11
1Q11
Gross Metro Product
Residential
Large C&I
All Customer Classes
2011
3Q12 2012E
(3)
Average Customer Growth
0.2%
0.0%
0.1%
Average Use-Per-Customer
(4.4)%
(1.4)%
(1.3)%
Total Residential
(4.3)%
(1.4)% (1.2)%
Small C&I
0.8%
0.5%
(3.1)%
Large C&I
2.0%
(0.3)%
(0.6)%
All Customer Classes
(1.1)%
(3.0)%
(2.2)%
Weather-Normalized Electric Load Year-over-Year
Key Economic Indicators
Weather-Normalized Electric Load
(1)
Source:
U.S.
Dept.
of
Labor
(Sept
2012)
-
US
US
Dept
of
Labor
prelim.
data
(August
2012)
-
Baltimore
(2)
Source: Global Insight (August 2012)
(3)
Not adjusted for leap year
Baltimore
U.S.
Unemployment rate
(1)
7.7%
7.8%
2012 annualized growth in
gross domestic/metro product
(2)
1.7%
2.1% 2012 3Q Earnings Release Slides
Note: C&I = Commercial & Industrial. Global Insight re-stated
2011 GMP amounts in August 2012 so there will be a change since June 2012 Analyst Day presentation.
|
 25
BGE Rate Case (Updated to reflect 10/22/12 filing)
Rate
Case
Request
(1)
Electric
Gas
Docket #
9299
Test Year
October 2011 –
September 2012
Common Equity Ratio
48.4%
Requested Returns
ROE: 10.5%; ROR: 7.96%
Rate Base
$2.7B
$1B
Revenue Requirement Increase
$131M
$45M
Proposed Distribution Price
Increase as % of overall bill
4%
6%
Timeline
•10/22/12: Update 8 months actual/4 month estimated test period data with
actuals for last 4 months (June-Sept. 2012)
•11/9/12: BGE and staff/intervenors file rebuttal testimony
•11/20/12: Staff/Intervenors and BGE file surrebuttal
testimony •12/3/12 –
12/18/12: Hearings
•1/11/13: Initial Briefs
•1/23/13: Reply Briefs
•2/23/13: Decision
•New rates are in effect shortly after the decision
(1)
2012 3Q Earnings Release Slides
Initial filing on 7/27/12 used 8 months of actuals and 4 months of projections
for October 2011 – September 2012 time period and requested an ROR of 8.02%, electric revenue
increase of $151M and gas revenue increase of $53M. Rate base, equity
ratio and ROE have not changed materially since the 7/27/12 filing. |
 Minimum Offer Price Rules (MOPR) Update
26
PJM is proposing modifications to the MOPR to ensure uneconomic generation does
not distort market
•
Restructured MOPR
MOPR to apply to all new gas-fired and IGCC units in PJM, with limited
exceptions MOPR exemption to be available only to self-supply
entities and competitive market entrants
MOPR
floor
to
apply
for
three
years,
set
at
100%
of
the
net
cost
of
new
entry
•
Implementation/Timing
PJM currently reviewing restructured MOPR with all stakeholders
PJM expected to file for FERC approval by November 30, 2012
Exelon, other generators, and other stakeholders to support PJM’s
filing FERC approval expected in early February, 2013
PJM RPM
Auction
2015/16 –
May 2012
Stakeholder
Discussions -
Summer 2012
FERC Filing –
November 30, 2012
PJM RPM
Auction
2016/17 –
Spring 2013
FERC Ruling –
February 1, 2013
2012 3Q Earnings Release Slides
Note: IGCC = Integrated Gasification Combined Cycle. FERC = Federal
Energy Regulatory Commission. RPM= Reliability Pricing Model. |
 Sufficient Liquidity
(1)
Excludes commitments from Exelon’s Community and Minority Bank Credit
Facility (2)
Available Capacity Under Facilities represents the unused commitments under the
borrower’s credit agreements net of outstanding letters of credit and facility draws.
The amount of commercial paper outstanding does not reduce the available
capacity under the credit agreements. (3)
Includes Exelon Corporate’s $500M credit facility and legacy Constellation
credit facilities assumed as part of the merger, letters of credit and commercial paper
outstanding. Exelon will have unwound the $4.2B in credit facilities
assumed from legacy Constellation by the end of the year. ($ in
Millions) Exelon Corp, ExGen, PECO and BGE facilities were amended and
extended on August 10, 2012 to align maturities of facilities and
secure liquidity and pricing through 2017 27
2012 3Q Earnings Release Slides
Aggregate Bank Commitments
(1)
600
1,000
600
5,600
9,800
Outstanding Facility Draws
--
--
--
--
--
Outstanding Letters of Credit
(1)
(121)
(1)
(1,950)
(2,089)
Available Capacity Under Facilities
(2)
599
879
599
3,650
7,711
Outstanding Commercial Paper
--
--
--
--
--
Available Capacity Less Outstanding
Commercial Paper
599
879
599
3,650
7,711
Available Capacity Under Bank Facilities as of October 24, 2012
(3) |
 28
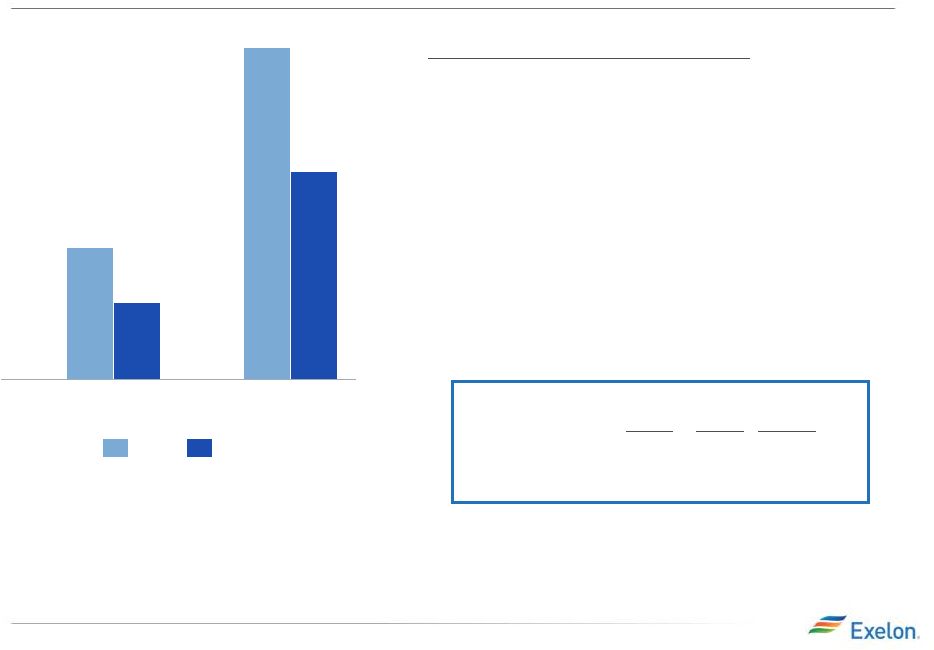
ComEd Operating EPS Contribution
Key
Drivers
–
3Q12
vs.
3Q11
(1)
•
Share differential: $(0.04)
•
Decreased storm costs
(2)
: $0.04
•
Lower distribution revenue primarily due to
lower allowed ROE
(3)
: $(0.06)
(1)
(2)
(3)
3Q12
Actual
Actual
Normal
Heating Degree-Days
147 107 119
Cooling Degree-Days
785 859
613 3Q11
2012 3Q Earnings Release Slides
$0.43
$0.17
$0.27
$0.10
YTD
3Q
2011
2012
Net of costs recoverable through EIMA. During the fourth
quarter of 2011, ComEd received a credit of $0.04 earnings per share, net of amortization, for the allowed recovery of certain 2011
storm costs pursuant to EIMA. During the fourth quarter of 2012, ComEd
anticipates recording $0.10 earnings per share to recognize the impact of the ICC’s rehearing decision issued on
October 3, 2012.
Due to the true-up mechanism in the distribution formula
rate, the primary driver of year-over-year change in earnings will be due to changes in allowed ROE, rate base and capital structure.
Refer to the Earnings Release Attachments for additional details and to the
Appendix for a reconciliation of adjusted (non-GAAP) operating EPS to GAAP EPS. |
 29
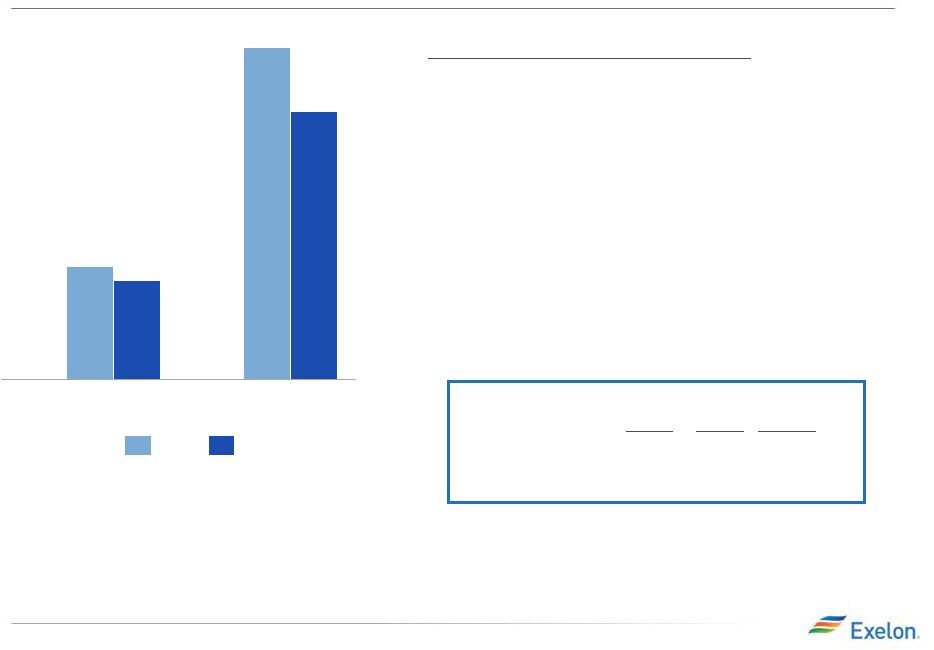
PECO Operating EPS Contribution
Key
Drivers
–
3Q12
vs.
3Q11
(1)
•
Lower income tax in 2011 due to electric
T&D tax repairs deduction: $(0.03)
•
Share differential: $(0.03)
•
Lower load growth: $(0.01)
•
Decreased storm costs: $0.02
•
Lower income tax in 2012 due to gas
distribution tax repairs deduction: $0.03
Note: T&D = Transmission and Distribution
3Q12
Actual
Actual
Normal
Heating Degree-Days
18 14 35
Cooling Degree-Days 1,109
1,138
934 3Q11
$0.47
$0.16
$0.38
$0.14
YTD
3Q
2011
2012
2012 3Q Earnings Release Slides
(1)
Refer to the Earnings Release Attachments for additional details and to the
Appendix for a reconciliation of adjusted (non-GAAP) operating EPS to GAAP EPS. |
 30
3Q GAAP EPS Reconciliation
Three Months Ended September 30, 2012
ExGen
ComEd
PECO
BGE
Other
Exelon
2012 Adjusted (non-GAAP) Operating Earnings (Loss) Per Share
$0.53
$0.10
$0.14
$(0.00)
$(0.01)
$0.77
Mark-to-market impact of economic hedging activities
0.01
-
-
-
0.01
0.02
Unrealized gains related to nuclear decommissioning trust funds
0.04
-
-
-
-
0.04
Plant retirements and divestitures
(0.22)
-
-
-
-
(0.22)
Asset retirement obligation
(0.01)
-
-
-
-
(0.01)
Constellation merger and integration costs
(0.04)
-
(0.00)
(0.00)
(0.00)
(0.04)
Amortization of commodity contract intangibles
(0.21)
-
-
-
-
(0.21)
Amortization of the fair value of certain debt
0.00
-
-
-
-
0.00
3Q 2012 GAAP Earnings (Loss) Per Share
$0.11
$0.11
$0.14
$(0.00)
$(0.00)
$0.35
NOTE: All amounts shown are per Exelon share and represent contributions
to Exelon's EPS. Amounts may not add due to rounding. Three Months
Ended September 30, 2011 ExGen
ComEd
PECO
Other
Exelon
2011 Adjusted (non-GAAP) Operating Earnings Per Share
$0.79
$0.17
$0.16
$0.01
$1.12
Mark-to-market impact of economic hedging activities
(0.08)
-
-
-
(0.08)
Unrealized losses related to nuclear decommissioning trust funds
(0.12)
-
-
-
(0.12)
Plant retirements and divestitures
(0.00)
-
-
-
(0.00)
Asset retirement obligation
(0.03)
-
0.00
-
(0.02)
Constellation merger and integration costs
(0.00)
(0.00)
(0.00)
(0.01)
(0.02)
Other acquisition costs
(0.01)
-
-
-
(0.01)
Wolf Hollow acquisition
0.03
-
-
-
0.03
3Q 2011 GAAP Earnings (Loss) Per Share
$0.58
$0.17
$0.16
$(0.00)
$0.90
2012 3Q Earnings Release Slides |
 31
YTD GAAP EPS Reconciliation
Nine Months Ended September 30, 2012
ExGen
ComEd
PECO
BGE
Other
Exelon
2012 Adjusted (non-GAAP) Operating Earnings (Loss) Per Share
$1.57
$0.27
$0.38
$0.04
$(0.05)
$2.21
Mark-to-market impact of economic hedging activities
0.21
-
-
-
0.02
0.23
Unrealized gains related to nuclear decommissioning trust funds
0.07
-
-
-
-
0.07
Plant retirements and divestitures
(0.25)
-
-
-
-
(0.25)
Asset retirement obligation
(0.01)
-
-
-
-
(0.01)
Constellation merger and integration costs
(0.16)
-
(0.01)
(0.00)
(0.08)
(0.26)
Maryland commitments
(0.03)
-
-
(0.10)
(0.15)
(0.28)
Amortization of commodity contract intangibles
(0.68)
-
-
-
-
(0.68)
FERC settlement
(0.22)
-
-
-
-
(0.22)
Reassessment of state deferred income taxes
0.02
-
-
-
0.13
0.15
Amortization of the fair value of certain debt
0.01
-
-
-
-
0.01
Other acquisition costs
(0.00)
-
-
-
(0.00)
YTD 2012 GAAP Earnings (Loss) Per Share
$0.53
$0.27
$0.37
$(0.07)
$(0.13)
$0.97
Nine Months Ended September 30, 2011
ExGen
ComEd
PECO
Other
Exelon
2011 Adjusted (non-GAAP) Operating Earnings (Loss) Per Share
$2.47
$0.43
$0.47
$(0.03)
$3.34
Mark-to-market impact of economic hedging activities
(0.34)
-
-
-
(0.34)
Unrealized losses related to nuclear decommissioning trust funds
(0.07)
-
-
-
(0.07)
Plant retirements and divestitures
(0.04)
-
-
-
(0.04)
Asset retirement obligation
(0.03)
-
0.00
-
(0.02)
Constellation merger and integration costs
(0.00)
(0.00)
(0.00)
(0.03)
(0.04)
Other acquisitions costs
(0.01)
-
-
-
(0.01)
Wolf Hollow acquisition
0.03
-
-
-
0.03
Recovery of costs pursuant to the 2011 distribution rate case order
-
0.03
-
-
0.03
Non-cash charge resulting from Illinois tax rate change legislation
(0.03)
(0.01)
-
(0.00)
(0.04)
YTD 2011 GAAP Earnings (Loss) Per Share
$1.99
$0.44
$0.47
$(0.07)
$2.84
2012 3Q Earnings Release Slides
NOTE: All amounts shown are per Exelon share and represent contributions
to Exelon's EPS. Amounts may not add due to rounding. |
 GAAP to Operating Adjustments
32
•
Exelon’s 2012 adjusted (non-GAAP) operating earnings outlook excludes
the earnings effects of the following:
-
Mark-to-market adjustments from economic hedging activities
-
Unrealized gains and losses from nuclear decommissioning trust fund investments
to the extent not offset by contractual accounting as described in the
notes to the consolidated financial statements -
Financial impacts associated with the planned retirement of fossil generating
units and the expected sale in the fourth quarter of 2012 of three
generating stations as required by the merger -
Changes in decommissioning obligation estimates
-
Certain costs incurred related to the Constellation merger and integration
initiatives -
Costs incurred as part of Maryland commitments in connection with the
merger -
Non-cash amortization of intangible assets, net, related to commodity
contracts recorded at fair value at the merger date
-
Costs incurred as part of a March 2012 settlement with the Federal Energy
Regulatory Commission (FERC) related to Constellation’s prior
period hedging and risk management transactions -
Changes in state deferred tax rates resulting from a reassessment of
anticipated apportionment of Exelon’s deferred taxes as a result of
the merger -
Non-cash amortization of certain debt recorded at fair value at the merger
date expected to be retired in 2013
-
Certain costs incurred associated with other acquisitions
-
Significant impairments of assets, including goodwill
-
Other unusual items
-
Significant changes to GAAP
•
Operating
earnings
guidance
assumes
normal
weather
for
remainder
of
the
year
2012 3Q Earnings Release Slides |