Attached files
| file | filename |
|---|---|
| 8-K - FORM 8-K - NATIONAL FINANCIAL PARTNERS CORP | d428532d8k.htm |
 THIRD
QUARTER 2012 EARNINGS CALL PRESENTATION Exhibit 99.1
|
 Related to Forward-Looking Statements
Certain
items
in
this
presentation
and
in
today’s
discussion,
including
matters
relating
to
revenue,
net
income,
Adjusted
EBITDA,
cash earnings, cash earnings per diluted share and percentages or calculations
using these measures, acquisitions, capital structure or growth rates and
other financial measurements and non-financial statements in future periods, constitute forward-
looking
statements
as
that
term
is
defined
in
the
Private
Securities
Litigation
Reform
Act
of
1995.
These
forward-looking
statements are based on management's current views with respect to future results
and are subject to risks and uncertainties. These statements are not
guarantees of future performance. Actual results may differ materially from those contemplated by
forward-looking
statements.
National
Financial
Partners
Corp.
(“NFP”
or
the
“Company”)
refers
you
to
its
filings
with
the
SEC,
including its Annual Report on Form 10-K for the year ended December 31, 2011,
filed on February 13, 2012, for additional discussion of these risks and
uncertainties as well as a cautionary statement regarding forward-looking statements. Forward-
looking statements made during this presentation speak only as of today's
date. NFP expressly disclaims any obligation to update or revise any
forward-looking statements, whether as a result of new information, future events or otherwise.
2 |
 Related to Non-GAAP Financial Information
The Company analyzes its performance using historical and forward-looking
non-GAAP financial measures called cash earnings, cash earnings per
diluted share, Adjusted EBITDA, and percentages or calculations using these measures.
The
Company
believes
these
non-GAAP
financial
measures
provide
additional
meaningful
methods
of
evaluating
certain aspects of the Company’s operating performance from period to period
on a basis that may not be otherwise apparent under GAAP. Cash earnings is
defined as net income excluding amortization of intangibles; depreciation; the
after-tax impact of the impairment of goodwill and intangible assets; the
after-tax impact of non-cash interest; the after- tax impact of
change in estimated acquisition earn-out payables recorded in accordance with purchase accounting that
have
been
subsequently
adjusted
and
recorded
in
the
consolidated
statements
of
operations;
the
after-tax
impact
of
management contract buyouts and the after-tax impact of certain
non-recurring items. Cash earnings per diluted share is calculated by
dividing cash earnings by the number of weighted average diluted shares outstanding for the period
indicated.
Cash
earnings
and
cash
earnings
per
diluted
share
should
not
be
viewed
as
substitutes
for
net
income
and
net income per diluted share, respectively. Adjusted EBITDA is defined as net
income excluding income tax expense; interest income; interest expense; gain
on early extinguishment of debt; other, net; amortization of intangibles;
depreciation; impairment of goodwill and intangible assets; (gain) loss on sale of
businesses, net; the accelerated vesting of certain RSUs; any change in
estimated acquisition earn-out payables recorded in accordance with purchase
accounting that have been subsequently adjusted and recorded in the consolidated
statements of operations and the expense related to management contract
buyouts. Adjusted EBITDA should not be viewed as a substitute for net
income. A reconciliation of these non-GAAP financial measures to their GAAP
counterparts for the periods presented herein is provided in the
Company’s quarterly financial supplement for the period ended September 30, 2012, which is
available on the Investor Relations section of the Company’s Web site at
www.nfp.com. 3 |
 Reconciliation: Net Income to Cash Earnings
(1)
Cash earnings is a non-GAAP financial measure, which the Company defines as net
income excluding amortization of intangibles; depreciation; the after-tax impact of the impairment of goodwill and intangible
assets; the after-tax impact of non-cash interest; the after-tax impact
of change in estimated acquisition earn-out payables recorded in accordance with purchase accounting that have been subsequently adjusted
and recorded in the consolidated statements of operations; the after-tax impact
of management contract buyouts and the after-tax impact of certain non-recurring items.
RECONCILIATION OF NET INCOME TO CASH EARNINGS
(Unaudited-in thousands, except per share amounts)
Three Months Ended
September 30,
2012
2011
GAAP net income
51
$
9,321
$
Amortization of intangibles
8,480
8,348
Depreciation
2,973
3,126
Impairment of goodwill and intangible assets
18,407
2,466
Tax benefit of impairment of goodwill and
intangible assets
(5,296)
(975)
Non-cash interest, net of tax
755
664
Change in estimated acquisition earn-out payables, net of tax
708
32
Management contract buyout, net of tax
-
-
Cash earnings (1)
26,078
$
22,982
$
GAAP net income per share - diluted
0.00
$
0.21
$
Amortization of intangibles
0.20
0.19
Depreciation
0.07
0.07
Impairment of goodwill and intangible assets
0.44
0.06
Tax benefit of impairment of goodwill and
intangible assets
(0.13)
(0.02)
Non-cash interest, net of tax
0.02
0.02
Change in estimated acquisition earn-out payables, net of tax
0.02
-
Management contract buyout, net of tax
-
-
Cash earnings per share - diluted (2)
0.62
$
0.53
$
4
(2) The sum of the per-share components of cash earnings per share - diluted may not
agree to cash earnings per share - diluted due to rounding. |
 Reconciliation: Net Income to
Adjusted EBITDA
5
(1) Adjusted EBITDA is a non-GAAP financial measure, which the Company defines as net
income excluding income tax expense; interest income; interest expense; gain on early
extinguishment of debt; other, net; amortization of intangibles; depreciation; impairment of goodwill
and intangible assets; (gain) loss on sale of businesses, net; the accelerated vesting of
certain RSUs; any change in estimated acquisition earn-out payables recorded in accordance with purchase accounting that have been subsequently adjusted and recorded in the
consolidated statements of operations and the expense related to management contract buyouts.
The reconciliation of Adjusted EBITDA per reportable segment does not include the
following items, which are not allocated to any of the Company’s reportable segments: income tax
expense; interest income; interest expense; gain on early extinguishment of debt and other, net. These
items are included in the reconciliation of Adjusted EBITDA to net income on a consolidated
basis. Corporate
Individual
Advisor
(in thousands)
Client Group
Client Group
Services Group
Consolidated
For the three months ended September 30, 2012
GAAP net income
51
$
Income tax benefit
(454)
Interest income
(617)
Interest expense
4,173
Other, net
(1,229)
Income (loss) from operations
13,756
$
(13,682)
$
1,850
$
1,924
$
Amortization of intangibles
6,097
2,167
216
8,480
Depreciation
1,324
988
661
2,973
Impairment of goodwill and intangible assets
(1)
18,408
-
18,407
Gain on sale of businesses, net
-
(439)
-
(439)
Change in estimated acquisition earn-out payables
1,035
-
50
1,085
Adjusted EBITDA
(1)
22,211
$
7,442
$
2,777
$
32,430
$
For the three months ended September 30, 2011
GAAP net income
9,321
$
Income tax expense
6,823
Interest income
(700)
Interest expense
4,006
Other, net
(1,303)
Income from operations
13,155
$
3,094
$
1,898
$
18,147
$
Amortization of intangibles
5,622
2,726
-
8,348
Depreciation
1,363
927
836
3,126
Impairment of goodwill and intangible assets
-
2,466
-
2,466
Loss on sale of businesses, net
-
40
-
40
Change in estimated acquisition earn-out payables
53
-
-
53
Adjusted EBITDA
(1)
20,193
$
9,253
$
2,734
$
32,180
$
|
 JESSICA BIBLIOWICZ |
 3Q12
Highlights Revenue $252 million
Organic revenue declined -1.3%
–
Corporate Client Group +3.3%
–
Individual Client Group -5.5%
–
Advisor Services Group -3.7%
Growth in Corporate Client Group continued
Corporate Benefits
Executive Benefits
Property & Casualty
Adjusted EBITDA $32 million
Adjusted EBITDA margin 12.9%
7 |
 Recurring Revenue
(1)
Quarter-over-Quarter
Recurring Revenue
Year-over-Year
Recurring Revenue
(1)
Recurring revenue includes revenue from corporate and executive benefits, property
& casualty, wealth management and asset-based fees and trails.
(2)
Previously reported as 57.0% for FY10; updated due to re-categorization
of certain asset-based fees and trails. (2)
8
58.0%
62.4%
FY 10
FY 11
63.8%
67.0%
3Q11
3Q12 |
 Capital Allocation Update
Strategic acquisitions
$88 million YTD through October 28, 2012
–
$80 million of primary acquisitions
•
Includes $30 million of acquisitions where NFP maintained exclusive
long-standing relationships
–
$8 million of management contract buyouts
Stock buyback
3Q12
–
Repurchased 262,327 shares at average price of $14.71 for $4 million
–
$40 million remaining on authorization as of September 30, 2012
YTD through September 30, 2012
–
Repurchased $18 million (includes shares repurchased under 2011
authorization) 4Q12 capital allocation expectations
Acquisition activity likely to be limited to smaller sub-acquisitions as well
as management contract buyouts
Due to 2012 acquisition activity, do not expect any meaningful stock buyback
9 |
 DOUG HAMMOND |
 Business Segments
Advisor Services Group
Individual Client Group
Corporate Client Group
($ in millions)
3Q12 organic revenue growth -1.3%
Corporate Client Group +3.3%
Individual Client Group -5.5%
Advisor Services Group -3.7%
11
$115.1
45.7%
$78.2
31.0%
$58.7
23.3%
3Q12 Revenue $252.0 million |
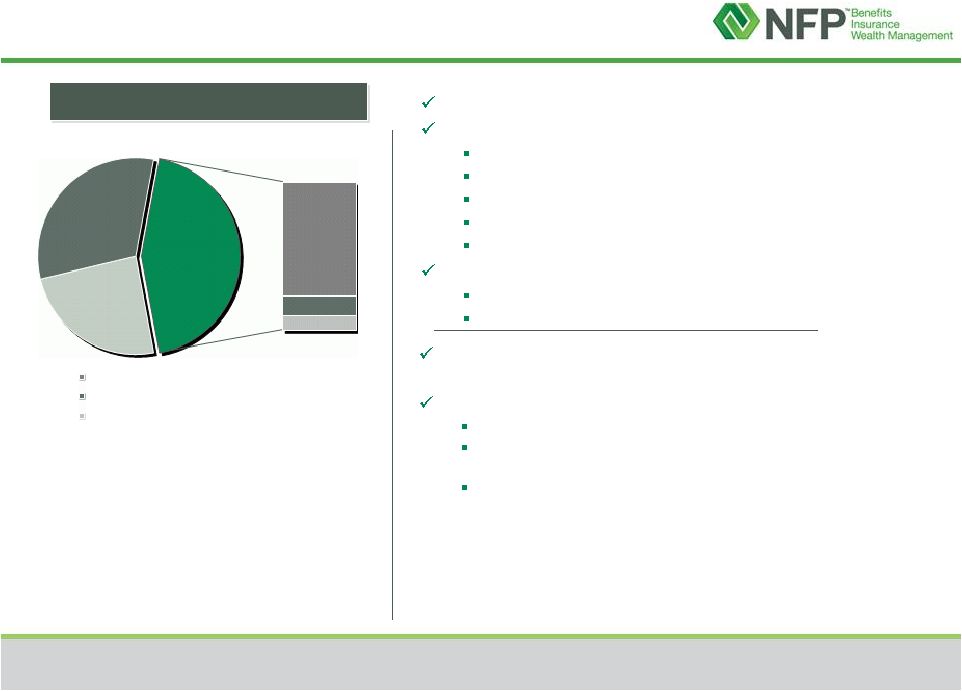 Business Segment
3Q12 Overview & Components of Revenue
27.3%
52.1%
Steady and recurring business
Diversification of products and services
Health & Welfare
Retirement
Ancillary & Voluntary Benefits
NFP Executive Benefits
NFP P&C
Strategic acquisitions
Management contract buyouts
P&C focus
3Q12 organic revenue growth +3.3%
FY 2012 expectations for CCG
Organic revenue growth: approximately 4.5% -
5%
Excluding certain bonuses in 1H12, organic revenue growth:
approximately 3.5% -
4%
Adjusted EBITDA margins approximately 20%
12
Corporate Client Group
Corporate Benefits
Executive Benefits
Property & Casualty
82.5%
9.5%
8.0%
45.7%
% of CCG
Revenue |
 Business Segment
3Q12 Overview & Components of Revenue
27.3%
52.1%
Individual Client Group
% of ICG
Revenue
20.8%
28.6%
50.6%
13
Life insurance
Challenges and uncertainty remain in
the market
Accelerated actions to reorganize and
consolidate NFP Life
New leadership
Dispositions of certain life
operations
Wealth management
Steady performance continues |
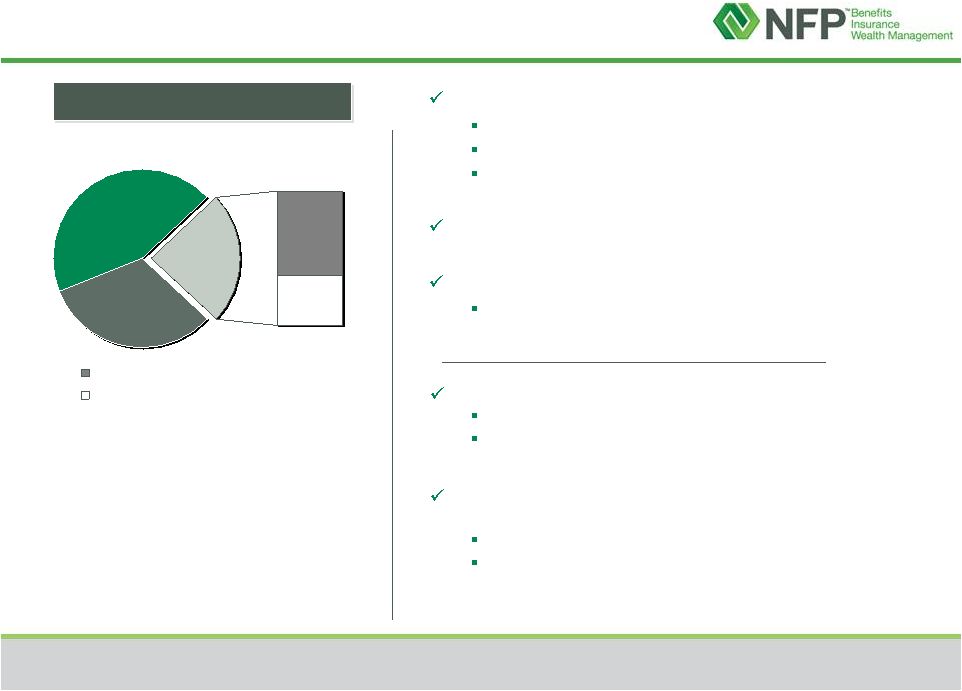 Asset Based Fees
& Trails Commissions & Non-Recurring Fees
Business Segment
3Q12 Overview & Components of Revenue
27.3%
52.1%
% of ASG
Revenue
63.9%
36.1%
23.3%
Business drivers
New assets
Advisor recruitment
Asset-based fees
AUM $10.5 billion, up 17.2% YOY
Fusion acquisition in July 2012
Expect 2013 Adjusted EBITDA margin to
expand 75-100 basis points from this
transaction
3Q12 organic revenue decreased 3.7%
Strong asset growth
Accelerated decline in transactional business as
uncertain environment impacted investor confidence
FY 2012 expectations for ASG (depending on
performance of financial markets)
Organic revenue decline of approximately 3%
Adjusted
EBITDA
margin
4.5%
-
5%
14
Advisor Services Group |
 DONNA BLANK |
 $20.2
$22.2
$9.3
$7.4
$2.7
$2.8
3Q11
3Q12
$105.8
$115.1
$84.8
$78.2
$61.0
$58.7
3Q11
3Q12
3Q12 Consolidated Financial Highlights
(1)
$251.5
$252.0
($ in millions)
Adjusted EBITDA Margin
3Q11
3Q12
Corporate Client Group
19.1%
19.3%
Individual Client Group
10.9%
9.5%
Advisor Services Group
4.5%
4.7%
Consolidated
12.8%
12.9%
64%
67%
Recurring
Revenue
(1)
The sum of the components may not agree to total due to rounding.
$32.2
$32.4
16
Revenue
Adjusted
EBITDA & Margin
Maintained YOY revenue, Adjusted EBITDA and margin;
Continued strength in CCG, offset by market challenges in ASG and life
insurance |
 (Compensation
Expense,
Employees
)+(Fees
to
Principals)
Revenue
Total Compensation
Ratio
=
Total Compensation Ratio by Segment
Corporate Client Group
Individual Client Group
51%
54%
52%
52%
49%
51%
50%
Q1'11
Q2'11
Q3'11
Q4'11
Q1'12
Q2'12
Q3'12
50%
50%
48%
49%
51%
52%
52%
Q1'11
Q2'11
Q3'11
Q4'11
Q1'12
Q2'12
Q3'12
17 |
 (6)
40
46
36
34
3
(2)
4
(2)
1
(3)
1Q11
2Q11
3Q11
4Q11
Adjusted 1Q12
2Q12
Adjusted 3Q12
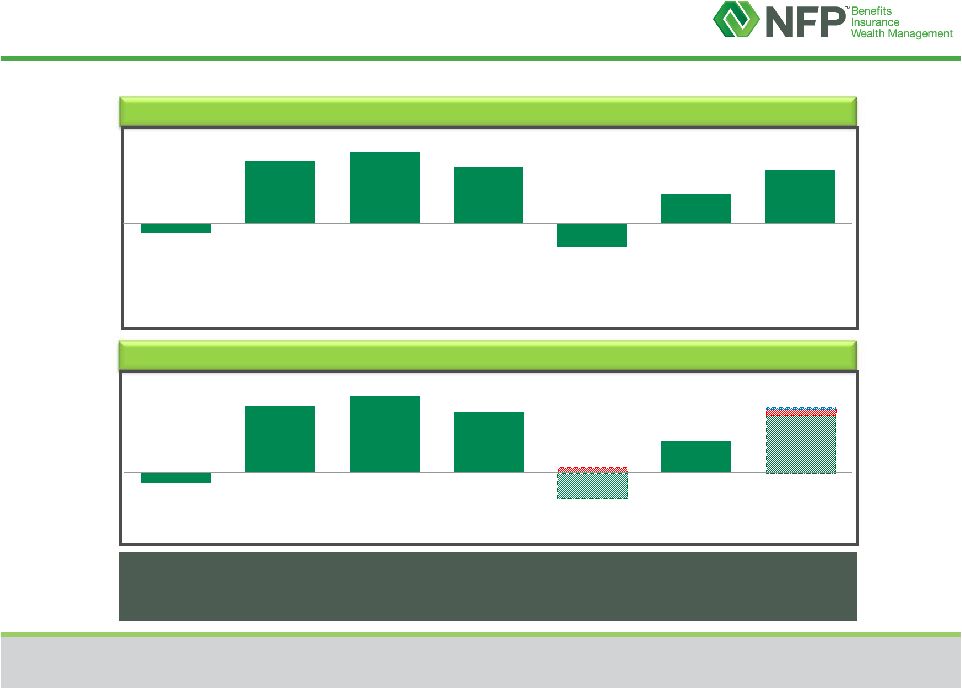
Operating Cash Flow
(1)
3Q12
operating
cash
flow
in
line
with
prior
years
as
acquisition
growth
offset by challenges in life insurance market
($ in millions)
39
(1)
The sum of the components may not agree to total due to rounding.
(2)
Cash paid in connection with management contract buy-out.
(3)
Cash paid for acquisition earn-outs that impact a portion of quarterly
operating cash flow. (11)
19
(15)
18
(6)
40
46
36
(15)
19
34
1Q11
2Q11
3Q11
4Q11
1Q12
2Q12
3Q12
Actual
As Adjusted |