Attached files
| file | filename |
|---|---|
| 8-K - CURRENT REPORT OF MATERIAL EVENTS OR CORPORATE CHANGES - SUPERMEDIA INC. | a12-25248_18k.htm |
| EX-99.1 - EX-99.1 - SUPERMEDIA INC. | a12-25248_1ex99d1.htm |
Exhibit 99.2
|
|
Q3 2012 Earnings Presentation October 30, 2012 Peter McDonald, CEO Dee Jones, CFO |
|
|
Safe Harbor Statement Some statements included in this report constitute forward-looking statements within the meaning of the Private Securities Litigation Reform Act of 1995 and the federal securities laws. Statements that include the words “may,” “will,” “could,” “should,” “would,” “believe,” “anticipate,” “forecast,” “estimate,” “expect,” “preliminary,” “intend,” “plan,” “project,” “outlook” and similar statements of a future or forward-looking nature identify forward-looking statements. You should not place undue reliance on these statements. These forward-looking statements include statements that reflect the current views of our senior management with respect to our financial performance and future events with respect to our business and industry in general. Forward-looking statements address matters that involve risks and uncertainties. Accordingly, there are or will be important factors that could cause our actual results to differ materially from those indicated in these statements. We believe that these factors include, but are not limited to, the risks related to the following: our inability to provide assurance for the long-term continued viability of our business; reduced advertising spending and increased contract cancellations by our clients, which causes reduced revenue; declining use of print yellow pages directories by consumers; competition from other yellow pages directory publishers and other traditional and new media; our ability to anticipate or respond to changes in technology and user preferences; changes in our operating performance; limitations on our operating and strategic flexibility and the ability to operate our business, finance our capital needs or expand business strategies under the terms of our credit agreement; failure to comply with the financial covenants and other restrictive covenants in our credit agreement; limited access to capital markets and increased borrowing costs resulting from our leveraged capital structure and debt ratings; changes in the availability and cost of paper and other raw materials used to print our directories; our reliance on third-party providers for printing, publishing and distribution services; credit risk associated with our reliance on small- and medium-sized businesses as clients; our ability to attract and retain qualified key personnel; our ability to maintain good relations with our unionized employees; changes in labor, business, political and economic conditions; changes in governmental regulations and policies and actions of federal, state and local municipalities; the outcome of pending or future litigation and other claims; the potential adverse impacts of failure to complete, or delay in completing the proposed merger with Dex as a result of obtaining consents from the stockholders and secured creditors of Dex or the Company; the possibility that our merger agreement with Dex could be unilaterally terminated by either party; the business uncertainties and contractual restrictions arising from the timing and closing of the proposed merger with Dex, including the possible inability to consummate the proposed transaction on the terms set forth in the merger agreement; the significant costs associated with the potential transaction with Dex; the risk that we may not timely or successfully realize the anticipated cost savings, growth opportunities and other financial and operating benefits as a result of the transaction; and difficulties in connection with the process of integrating Dex and the Company, including the risk that benefits from the transaction may be significantly offset by costs incurred in integrating the companies. The foregoing factors should not be construed as exhaustive and should be read together with the other cautionary statements included in this and other reports we file with the Securities and Exchange Commission (the “SEC”), including the information in “Item 1A. Risk Factors” in Part I of our Annual Report on Form 10-K for the year ended December 31, 2011 as updated in the subsequent quarterly reports on Form 10-Q. If one or more events related to these or other risks or uncertainties materialize, or if our underlying assumptions prove to be incorrect, actual results may differ materially from what we anticipate. All forward-looking statements included in this report are expressly qualified in their entirety by these cautionary statements. The forward-looking statements speak only as of the date made and, other than as required by law, we undertake no obligation to publicly update or revise any forward-looking statements, whether as a result of new information, future events or otherwise. |
|
|
Peter McDonald, CEO |

|
|
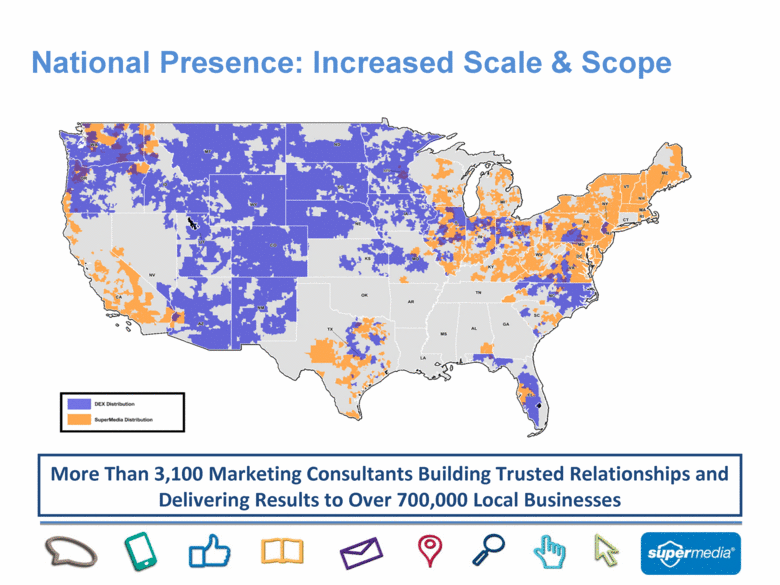
National Presence: Increased Scale & Scope More Than 3,100 Marketing Consultants Building Trusted Relationships and Delivering Results to Over 700,000 Local Businesses |
|
|
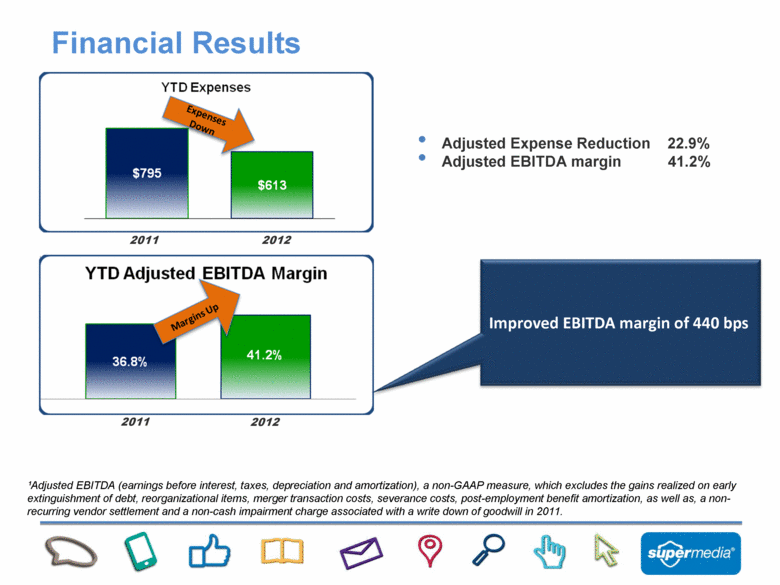
Financial Results YTD Expenses Expenses Down YTD 2011 2012 Adjusted EBITDA Margin 2011 2012 Adjusted Expense Reduction 22.9% Adjusted EBITDA margin 41.2% Improved EBITDA margin of 440 bps 1 Adjusted EBITDA (earnings before interest, taxes, depreciation and amortization), a non-GAAP measure, which excludes the gains realized on early extinguishment of debt, reorganizational items, merger transaction costs, severance costs, post-employment benefit amortization, as well as, a non-recurring vendor settlement and a non-cash impairment charge associated with a write down of goodwill in 2011. |
|
|
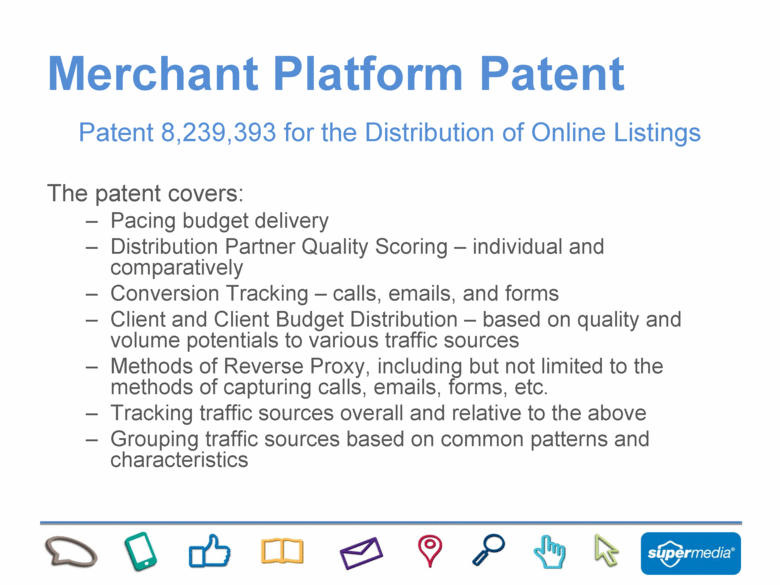
Merchant Platform Patent Patent 8,239,393 for the Distribution of Online Listings The patent covers: Pacing budget delivery Distribution Partner Quality Scoring – individual and comparatively Conversion Tracking – calls, emails, and forms Client and Client Budget Distribution – based on quality and volume potentials to various traffic sources Methods of Reverse Proxy, including but not limited to the methods of capturing calls, emails, forms, etc. Tracking traffic sources overall and relative to the above Grouping traffic sources based on common patterns and characteristics |
|
|
Turning Leads Into Clients |

|
|
Peter McDonald, CEO |
|
|
Dee Jones, CFO |

|
|
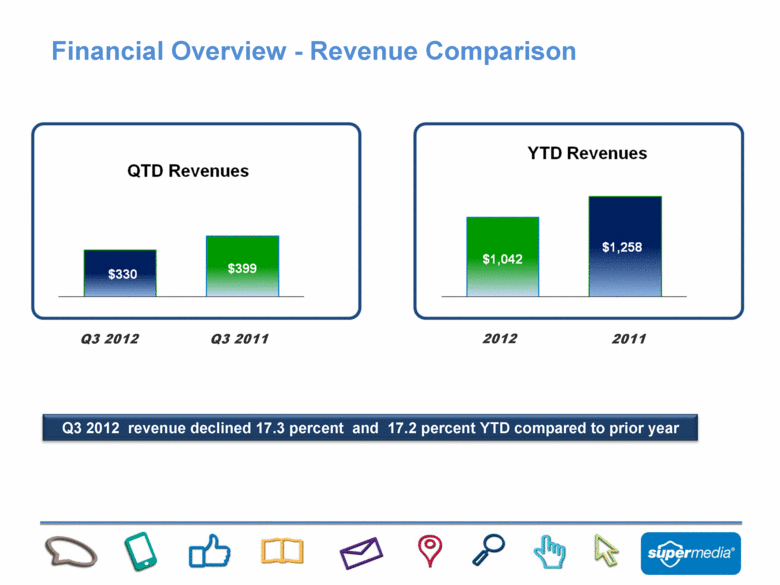
Financial Overview - Revenue Comparison Q3 2012 revenue declined 17.3 percent and 17.2 percent YTD compared to prior year 2011 Q3 2012 2012 Q3 2011 |
|
|
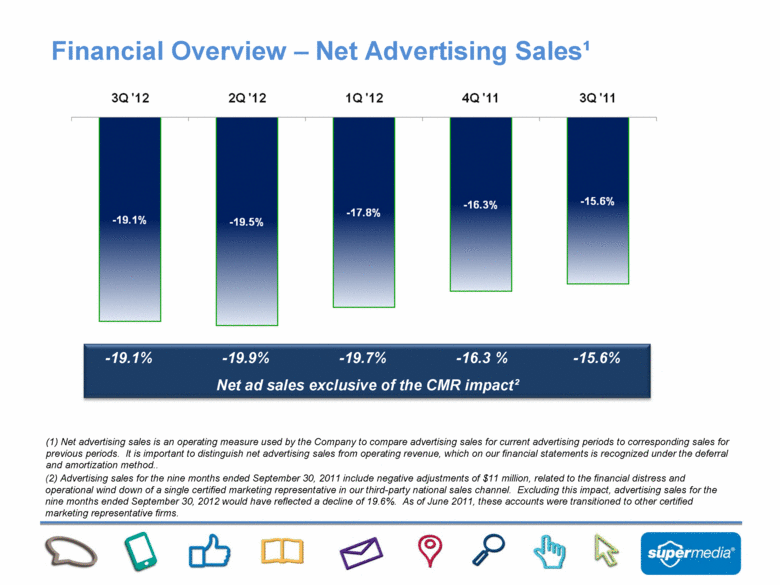
Financial Overview – Net Advertising Sales¹ Net ad sales exclusive of the CMR impact² -19.9% -19.7% -16.3 % -15.6% -19.1% (2) Advertising sales for the nine months ended September 30, 2011 include negative adjustments of $11 million, related to the financial distress and operational wind down of a single certified marketing representative in our third-party national sales channel. Excluding this impact, advertising sales for the nine months ended September 30, 2012 would have reflected a decline of 19.6%. As of June 2011, these accounts were transitioned to other certified marketing representative firms. (1) Net advertising sales is an operating measure used by the Company to compare advertising sales for current advertising periods to corresponding sales for previous periods. It is important to distinguish net advertising sales from operating revenue, which on our financial statements is recognized under the deferral and amortization method.. |
|
|
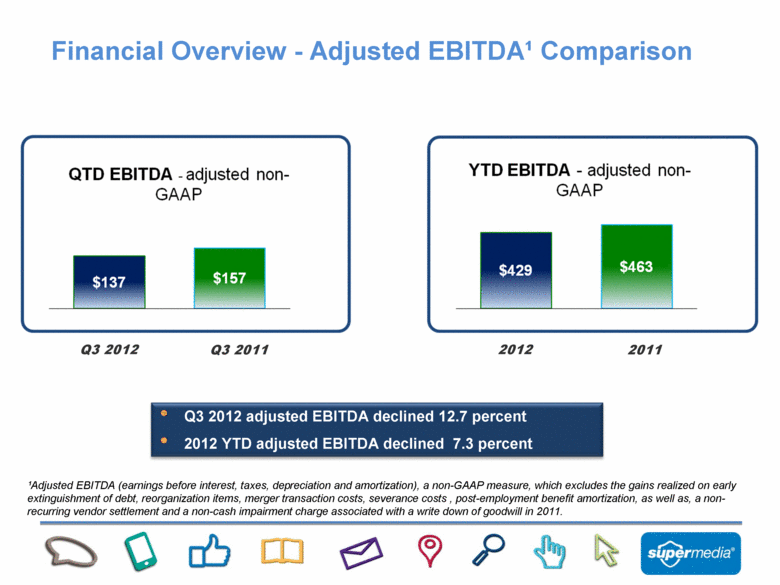
Financial Overview - Adjusted EBITDA¹ Comparison 2011 Q3 2012 2012 Q3 2011 Q3 2012 adjusted EBITDA declined 12.7 percent 2012 YTD adjusted EBITDA declined 7.3 percent ¹Adjusted EBITDA (earnings before interest, taxes, depreciation and amortization), a non-GAAP measure, which excludes the gains realized on early extinguishment of debt, reorganization items, merger transaction costs, severance costs , post-employment benefit amortization, as well as, a non-recurring vendor settlement and a non-cash impairment charge associated with a write down of goodwill in 2011. |
|
|
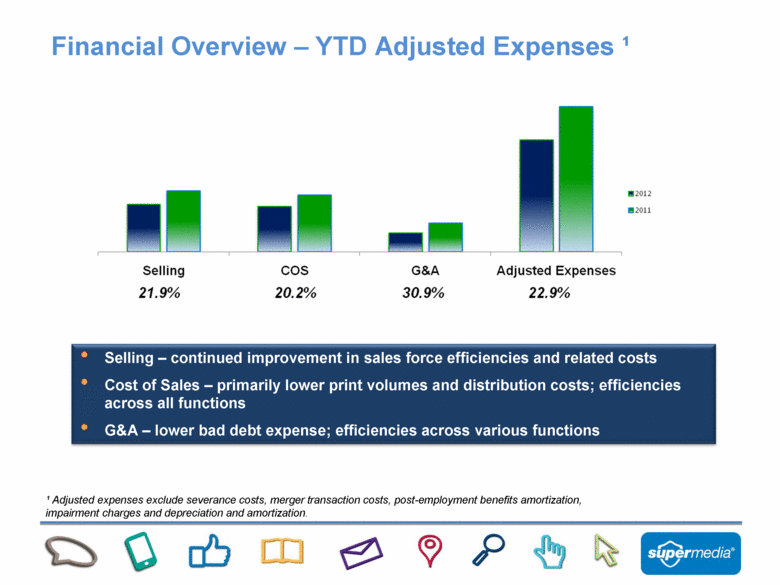
Financial Overview – YTD Adjusted Expenses ¹ Selling – continued improvement in sales force efficiencies and related costs Cost of Sales – primarily lower print volumes and distribution costs; efficiencies across all functions G&A – lower bad debt expense; efficiencies across various functions ¹ Adjusted expenses exclude severance costs, merger transaction costs, post-employment benefits amortization, impairment charges and depreciation and amortization. |
|
|
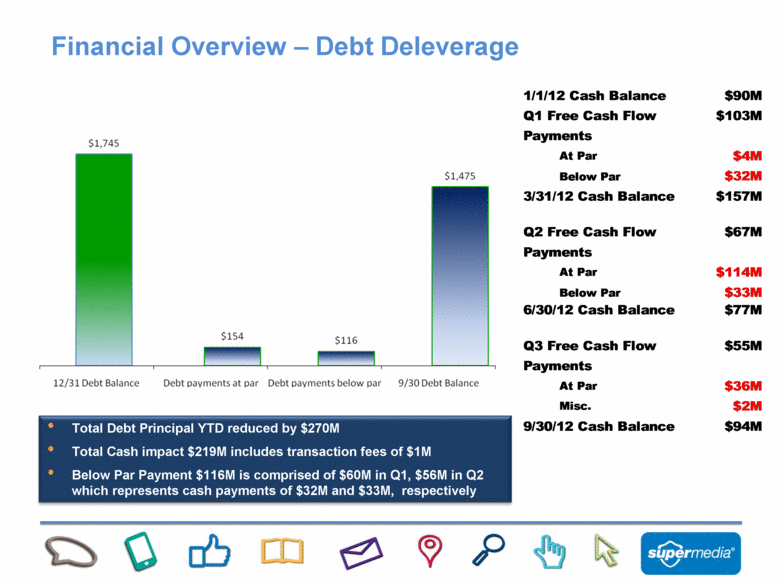
Financial Overview – Debt Deleverage Total Debt Principal YTD reduced by $270M Total Cash impact $219M includes transaction fees of $1M Below Par Payment $116M is comprised of $60M in Q1, $56M in Q2 which represents cash payments of $32M and $33M, respectively 1/1/12 Cash Balance $90M Q1 Free Cash Flow $103M Payments At Par $4M Below Par $32M 3/31/12 Cash Balance $157M Q2 Free Cash Flow $67M Payments At Par $114M Below Par $33M 6/30/12 Cash Balance $77M Q3 Free Cash Flow $55M Payments At Par $36M Misc. $2M 9/30/12 Cash Balance $94M |