Attached files
| file | filename |
|---|---|
| 8-K - FORM 8-K - Energy Future Holdings Corp /TX/ | d429391d8k.htm |
 EFH
Corp. Q3 2012 Investor Call
October 30, 2012
Exhibit 99.1 |
 1
Safe Harbor Statement
Forward Looking Statements
This presentation contains forward-looking statements, which are subject to
various risks and uncertainties. Discussion of risks and uncertainties
that could cause actual results to differ materially from management's current
projections, forecasts, estimates and expectations is contained in EFH Corp.'s
filings with the Securities and Exchange Commission (SEC). In addition to the
risks and uncertainties set forth in EFH Corp.'s SEC filings, the
forward-looking statements in this presentation regarding the
company’s natural gas hedging program could be affected by, among other
things: changes in the ERCOT electricity market, including a regulatory or
legislative change, that results in wholesale electricity prices not generally
moving with natural gas prices; any decrease in market heat rates as the
program generally does not mitigate exposure to changes in market heat rates;
the unwillingness or failure of any hedge counterparty or the lenders
under
the
commodity
collateral
posting
facility
to
perform
their
respective
obligations;
or
any
other
event
that
results
in
the
inability
to
continue
to
use
a
first
lien on TCEH’s assets to secure a substantial portion of the hedges under
the program.
Regulation G
This presentation includes certain non-GAAP financial measures. A reconciliation
of these measures to the most directly comparable GAAP measures is included in
the appendix to this presentation. |
 2
Today’s Agenda
Q&A
Financial and Operational
Overview
Q3 2012 Review
Paul Keglevic
Executive Vice President & CFO |
 Consolidated: reconciliation of GAAP net loss to adjusted (non-GAAP) operating
results Q3
1
11 vs. Q3 12; $ millions, after tax
EFH Corp.
Adjusted (Non-GAAP) Operating Results -
QTR
3
Factor
Q3 11
Q3 12
Change
EFH Corp. GAAP net loss
(710)
(407)
303
Items excluded from adjusted (non-GAAP) operating results (noncash) (after
tax): Unrealized commodity-related mark-to-market net (gain)
loss (89)
339
428
Unrealized mark-to-market net loss on interest rate swaps
402
14
(388)
Asset impairments, primarily mineral interests
-
20
20
Charges related to EPA Cross State Air Pollution Rule
2
321
-
(321)
EFH Corp. adjusted (non-GAAP) operating loss
(76)
(34)
42
1
Three months ended September 30.
2
Charges include, net of tax, $269 million of emission allowances impairments, $32 million of severance
accruals, and $6 million of mining asset impairments, all recorded in other
deductions, and $14 million of incremental depreciation expense. |
 Consolidated: key
drivers of the change in adjusted (non-GAAP) operating results Q3 11 vs. Q3 12; $ millions,
after tax EFH Corp.
Adjusted
(Non-GAAP)
Operating
Results
Key
Drivers
-
QTR
1
Competitive Business consists of Competitive Electric segment and Corporate and Other.
4
Description/Drivers
Better (Worse)
Than
Q3 11
Competitive
Business¹:
Lower amortization of intangibles arising from purchase accounting
16
Higher nuclear and coal generation due to fewer derates
10
Higher fuel costs for coal and nuclear generation
(6)
Lower net margin from asset management and retail activities, including the effects of milder
weather (1)
Contribution margin
19
Lower depreciation reflecting increased useful lives and retirements of certain generation assets
14
Lower SG&A driven by employee-related costs and retail marketing and related expenses
7
Lower retail bad debt expense reflecting improved collections and customer mix
5
Lower operating costs reflecting decreased coal unit outages
4
Higher net interest expense driven by higher average rates
(12)
Higher income tax benefit due primarily to increased lignite depletion and higher Texas margin tax in
2011 13
All
other
-
net
(4)
Total
change
-
Competitive
Business
46
Regulated Business:
Higher net revenues reflecting transmission and distribution tariff increases, automated meter
surcharges and growth in points of delivery 32
Higher
revenues
from
transmission
cost
recovery
charges
(largely
offsets
3
party
transmission
fees
on
an
annual
basis)
17
Lower revenues primarily due to milder weather
(31)
Higher depreciation and amortization reflecting infrastructure investment
(7)
Higher
3
party
transmission
fees
(6)
Higher net interest expense driven by increased borrowings
(7)
Higher property taxes reflecting increased property tax rates
(4)
All
other
–
net
2
Change in Regulated Business (~80% owned by EFH Corp.)
(4)
Total change in EFH Corp. adjusted (non-GAAP) operating results
42
rd
rd |
 Consolidated:
reconciliation of GAAP net loss to adjusted (non-GAAP) operating results YTD
11
vs.
YTD
12;
$
millions,
after
tax
EFH Corp.
Adjusted
(Non-GAAP)
Operating
Results
-
YTD
5
Factor
YTD 11
YTD 12
Change
EFH Corp. GAAP net loss
(1,776)
(1,408)
368
Items
excluded
from
adjusted
(non-GAAP)
operating
results
(after
tax)
:
Unrealized commodity-related mark-to-market net loss
159
831
672
Unrealized mark-to-market net loss on interest rate swaps
572
8
(564)
Asset impairments, primarily mineral interests
-
20
20
Charges
related
to
EPA
Cross
State
Air
Pollution
Rule
321
-
(321)
Third-party fees associated with April 2011 TCEH debt amendment and extension transactions
64
-
(64)
Debt extinguishment gains
(16)
-
16
Gain related to counterparty bankruptcy settlement
(14)
-
14
Income
tax
charges
4
13
-
(13)
EFH Corp. adjusted (non-GAAP) operating loss
(677)
(549)
128
2
3
1
3
Nine months ended September 30.
Items are noncash except for fees associated with TCEH amendment and extension debt transactions, gain
related to counterparty bankruptcy settlement, and 2011 income tax charge.
Charges include, net of tax, $269 million of emission allowances impairments, $32 million of severance
accruals, and $6 million of mining asset impairments, all recorded in other
deductions, and $14 million of incremental depreciation expense. YTD 2011 state income tax
charges recorded as a result of TCEH amendment and extension transaction in April 2011.
4
1
2 |
 Consolidated: key drivers of the change in adjusted (non-GAAP) operating
results YTD 11 vs. YTD 12; $ millions, after tax
EFH Corp.
Adjusted
(Non-GAAP)
Operating
Results
Key
Drivers
(after
tax)
-
YTD
6
Description/Drivers
Better
(Worse) Than
Q3 11
73
45
16
(30)
3
107
59
22
15
15
(95)
(12)
3
114
98
60
(44)
(36)
(24)
(12)
(10)
(10)
(8)
14
-
128
Competitive Business:
Higher net margin from asset management and retail activities, net of the effects of
milder weather Lower amortization of intangibles arising from purchase
accounting Higher nuclear generation due to refueling outage in 2011, partially
offset by outages at coal units Higher fuel costs for coal and nuclear
generation All
other
-
net
Contribution margin
Lower depreciation reflecting increased useful lives and retirements of certain
generation assets Lower
operating
costs
reflecting
nuclear
plant
refueling
outage
in
2011,
partially
offset
by
coal
unit
outages
and
environmental
expenses
in
2012
Lower retail bad debt expense reflecting improved collections and customer mix
Lower SG&A driven by employee-related costs and retail marketing and related
expenses Higher net interest expense driven by higher rates
Property damage claim and sales tax refund in 2011
Other -
net
Total
change
-
Competitive
Business
Regulated Business:
Higher
net
revenues
reflecting
transmission
and
distribution
tariff
increases,
including
advanced
meter
surcharges
and
growth
in
points
of
delivery
Higher
revenues
from
transmission
cost
recovery
charges
(largely
offsets
3
party
transmission
fees
on
an
annual
basis)
Lower consumption primarily due to milder weather
Higher
3
party
transmission
fees
Higher depreciation and amortization reflecting infrastructure investment
Higher
operation
and
maintenance
expense
due
to
regulatory
asset
amortization
and
outside
services
and
vegetation
management
costs
Higher taxes other than income driven by higher property tax rates
Higher net interest expense driven by increased borrowings
All
other
–
net
Total change -
Regulated Business (~80% owned by EFH Corp.)
Total change in EFH Corp. adjusted (non-GAAP) operating results
rd
rd |
 EFH
Corp. Adjusted EBITDA (Non-GAAP) EFH Corp. Adjusted EBITDA
(non-GAAP) Q3
11 vs. Q3 12 and YTD
11 vs. YTD 12;
$ millions
Q3 12
Q3 11
1,639
1,599
1,120
1,076
521
515
Oncor
7
1
See Appendix for Regulation G reconciliations and definition. Includes $8
million, ($2) million, $22 million and $14 million in Q3 11, Q3 12, YTD 11 and YTD 12, respectively, of Corp. &
Other Adjusted EBITDA.
2
Three months ended September 30.
3
Nine months ended September 30.
YTD 12
YTD 11
4,222
4,031
2,854
2,739
1,354
1,270
4%
4%
3
1
2
TCEH
3%
1%
7%
5%
Q3 and YTD performance was largely driven by the same key drivers impacting
adjusted (non-GAAP) operating results. |
 Luminant Operational Results
8
Nuclear-fueled generation; GWh
Coal-fueled generation; GWh
Q3 12
Q3 11
4,956
14,546
15,772
5,276
8%
QTR
YTD 11
Q3 11
Q3 12
YTD 12
8%
YTD
6%
QTR
20%
YTD
16,473
15,179
45,096
35,929
YTD 11
YTD 12
Q3
and
YTD
2012
Coal-Fueled
Plant
Results
Q3 –
1.3 TWh lower generation as a result of
1.9 TWh of higher economic backdown,
partially offset by 0.6 TWh of higher
generation due to improved reliability and
performance
YTD –
9.2 TWh lower generation as a result
of 5.0 TWh of higher economic backdown
and 4.2 TWh from more planned and
unplanned outage days
Q3
2012
Nuclear
Plant
Results
Solid safety performance
Higher generation due to improved
reliability
Top decile industry performance for
reliability and cost |
  9
Q3 2012 Results
Residential sales volumes declined
18% reflecting milder weather and a
6% decrease in customer counts
Residential attrition rates improved
66% compared to Q3 2011; best Q3
result since 2008
Lower SMB
and LCI volumes reflect
competitive intensity and focus on
margin discipline
Bad debt expense decreased by 50%
in Q3 12 compared to Q3 11
TXU Energy Operational Results
1
SMB
–
small
business
2
LCI -
large commercial and industrial
3
Latest twelve months
5.72%
LTM
0.96%
QTR
17.55%
QTR
17.74%
YTD
Total residential customers
End of period, thousands
Retail electricity sales volumes by customer class; GWh
1,578
1,563
YTD 11
SMB
LCI
Residential
Q3 11
15,147
38,005
Q3 11
Q2 12
18,676
9,586
7,892
3,445
2,116
4,694
Q3 12
Q3 12
1,563
1,658
22,362
9,955
5,688
7,885
2,846
1,757
31,262
12,488
Q3 12
YTD 12
1
1
2
3
2 |
 10
Oncor Operational Results
Electric energy billed volumes
4
; GWh
Q3 11
Q3 12
1
SMB
–
small
business;
LCI
–
large
commercial
and
industrial
2
AMS –
Advanced Metering System
3
CREZ –
Competitive Renewable Energy Zone
4
On average, billed volumes are on an approximate 17-day calendar lag;
therefore, amounts shown reflect partial impacts from prior quarters
5
Latest twelve months
Residential
SMB & LCI
1
3,196
3,232
1%
LTM
5
Electricity distribution points of delivery
End of period, thousands of meters
Q3 12
Q2 12
3,225
3,232
Q3 2012 Results
Lower Q3 and YTD 2012 Residential
volumes principally due to milder
weather in 2012 compared to 2011
Lower
Q3
and
YTD
2012
SMB
&
LCI
1
energy volumes due to milder
weather in 2012 compared to 2011
Execution
of
AMS
2
plan
–
~289,000
advanced meters installed during Q3
2012; over 3.1 million installed
through September 30, 2012
$1.360
billion
spent
on
CREZ
3
through September 30, 2012;
$461 million spent YTD 2012
Q3 12
36,463
34,093
88,626
85,466
Q3 11
YTD 11
YTD 12
3%
QTR
11%
QTR
9%
YTD |
 285
1,769
1,769
1,792
259
Facilities Limit
LOCs/Cash Borrowings
Availability
Pro-forma Availability
EFH Corp. Liquidity Management
As of September 30, 2012
11
EFIH
1
Lien
Debt
Issuance
Cash and Equivalents
TCEH
Letter
of
Credit
Facility
TCEH Revolving Credit Facility
3,116
EFH Corp. and TCEH continue to monitor capital market conditions
for opportunities to
ensure liquidity needs are met and to improve financial flexibility.
EFH Corp. (excluding Oncor) available liquidity
As of 9/30/12; $ millions
3,826
967
1,062
2,054
682
1,792
265
265
4,085
3
1
At September 30, restricted cash totaled $947 million after reduction for a $115
million letter of credit drawn in 2009 related to an office building financing.
The
restricted
cash
supports
letters
of
credit,
of
which
$682
million
are
outstanding,
leaving
$265
million
available.
2
Includes $680 million in cash held in escrow to settle the demand notes payable by
EFH Corp. to TCEH. 3
Pro-forma
liquidity
availability
includes
net
cash
proceeds
from
EFIH
1 Lien
Debt
Issuance
completed
in
October
2012.
2
2
st
1
st |
 12
12
12
Commodity Prices
Commodity
Units
Q3 12
Actual
Q3 11
Actual
YTD 12
Actual
YTD 11
Actual
BOY 12E
NYMEX gas price
$/MMBtu
$2.87
$4.13
$2.53
$4.22
$3.32
HSC gas price
$/MMBtu
$2.86
$4.10
$2.50
$4.17
$3.28
7x24 market heat rate (HSC)
MMBtu/MWh
9.31
16.70
10.08
11.41
8.43
North Hub 7x24 power price
$/MWh
$26.68
$68.63
$24.82
$47.63
$27.60
TCEH weighted avg. hedge price
4
$/MMBtu
$7.29
$7.39
$7.36
$7.55
$7.35
Gulf Coast ultra-low sulfur diesel
$/gallon
$3.07
$3.02
$3.06
$2.97
$3.14
PRB 8400 coal
$/ton
$6.67
$11.23
$7.20
$11.01
$7.25
LIBOR interest rate
5
percent
0.71%
0.47%
0.74%
0.45%
0.36%
Commodity prices
Q3 12, Q3 11, YTD 12, YTD 11 and BOY 12E; mixed measures
1
YTD 2011: nine months ended September 30, 2011; BOY 12E: 2012 estimate based on
average of monthly commodity prices as of 9/28/12 for October 2012 through December 2012.
2
The
actual
prices
are
computed
based
on
settled
Gas
Daily
prices
for
Henry
Hub.
3
Based on ERCOT Nodal market clearing price for North Hub.
4
Weighted
average
prices
in
the
TCEH
natural
gas
hedging
program.
Based
on
NYMEX
Henry
Hub
prices
of
forward
natural
gas
sales
positions
in
the
hedging
program
(excluding
the
impact
of
offsetting
purchases
for
rebalancing
and
pricing
point
basis
transactions).
5
The index for the settled value is a 6-month LIBOR rate. The 2012 estimate is
based on 3 month LIBOR. 3
2
1
1 |
 13
Factor
Measure
2012
2013
2014
Total or Avg.
6/30/12
Natural gas hedges
mm MMBtu
~155
~246
~146
~547
Wtd.
avg.
hedge
price
1
$/MMBtu
~$7.32
~$7.19
~$7.80
Natural gas prices
$/MMBtu
~$2.96
~$3.58
~$3.95
Cum.
MtM
gain
at
6/30/12
2
$ billions
~$0.8
~$1.0
~$0.6
~$2.4
9/30/12
Natural
gas
hedges
3
mm MMBtu
~74
~211
~146
~431
Wtd.
avg.
hedge
price
1
$/MMBtu
~$7.35
~$6.89
~$7.80
Natural
gas
prices
4
$/MMBtu
~$3.32
~$3.84
~$4.18
Cum.
MtM
gain
at
9/30/12
2
$ billions
~$0.4
~$0.9
~$0.6
~$1.9
Q3 12 change in unrealized MtM (loss) gain
$ billions
~($0.4)
~($0.1)
~0.0
~($0.5)
13
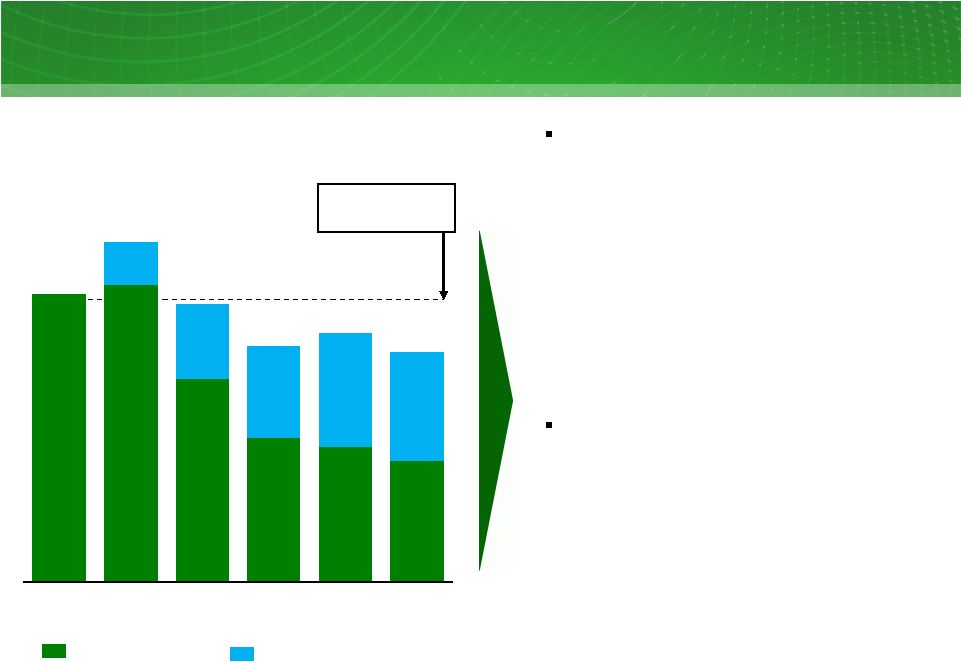
Unrealized Mark-To-Market Impact Of Hedging
Unrealized mark-to-market impact of hedging program
9/30/12 vs. 6/30/12; mixed measures, pre-tax
Despite slightly higher gas prices, the value of the forward hedge program remains
strong 1
Weighted
average
prices
are
based
on
NYMEX
Henry
Hub
prices
of
forward
natural
gas
sales
positions
in
the
natural
gas
hedging
program
(excluding
the
impact
of
offsetting
purchases
for rebalancing and pricing point basis transactions). Where collars are
reflected, sales price represents the approximate collar floor price. 6/30/12 prices for 2012 represent July 1, 2012
through December 31, 2012 values and 9/30/12 prices for 2012 represent October 1,
2012 through December 31, 2012 values. 2
MtM values include the effects of all transactions in the natural gas hedging
program including offsetting purchases (for re-balancing) and natural gas basis deals.
3
As of 9/30/12, 2012 represents October 1, 2012 through December 31, 2012 volumes.
Where collars are reflected, the volumes are estimated based on the notional position of the
derivatives to provide protection against downward price movements. The
notional volumes for collars are approximately 150 million MMBtu, which correspond to a delta position of
approximately 143 million MMBtu in 2014.
4
2012 represents the average of monthly forward prices for October 1, 2012 though
December 31, 2012. |
 14
14
TCEH Natural Gas Exposure
TCEH Natural Gas Position
12-14
1
; million MMBtu
Hedges Backed by Asset First Lien
Open Position
Factor
Measure
2012
2013
2014
Natural gas hedging program
million MMBtu
~53
~211
~146
TXUE and LUME net positions
million MMBtu
~15
~31
Overall estimated percent of
total NG position hedged
percent
~99%
~87%
~39%
TXUE
and
Luminant
Net
Positions
2
TCEH has hedged approximately 66% of its estimated natural gas price exposure through
2014 Hedges Backed by CCP
1
As of 9/30/12. Balance of 2012 is from November 1, 2012 to December 31,
2012. Assumes conversion of electricity positions based on a ~8.5 heat rate with natural gas generally being
on
the
margin
~70-90%
of
the
time
(i.e.
when
other
technologies
are
forecast
to
be
on
the
margin,
no
natural
gas
position
is
assumed
to
be
generated).
2
Includes estimated forward net wholesale and retail sales. Excludes any
transactions associated with proprietary trading positions. 3
The 2014 position includes notional volume of approximately 150 million MMBtu
costless collar with strikes of ~$7.80/MMBtu and ~$11.75/MMBtu for puts and calls, respectively. The delta
equivalent short position is ~143 million MMBtu.
3
15
198
31
34
211
146
19
1
59
278
69
468
455
2012
2013
2014
~198 |
 15
15
15
EFH Corp. Adjusted EBITDA Sensitivities
Commodity
Percent Hedged at
September 30, 2012
Change
BOY 12E Impact
$ millions
7X24 market heat rate (MMBtu/MWh)
2
~90
0.1 MMBtu/MWh
~1
NYMEX gas price ($/MMBtu)
~99
$1/MMBtu
~1
Diesel ($/gallon)
3
~100
$1/gallon
~0
Base coal ($/ton)
4
~100
$2/ton
~1
Generation operations
Nuclear-
and coal / lignite-fueled generation (TWh)
N/A
1 TWh
~10
Retail operations
Q4 2012
Residential contribution margin ($/MWh)
5 TWh
$1/MWh
~5
Residential consumption
5 TWh
1%
~2
Business markets consumption
4 TWh
1%
~1
Impact
on
EFH
Corp.
Adjusted
EBITDA
1
12E; mixed measures
The majority of 2012 commodity-related risks are significantly mitigated.
1
2012 estimate based on commodity positions as of 9/30/12 and reflecting the impact
of Clean Air Interstate Rule, net of natural gas hedges and net wholesale and retail sales. Excludes
gains and losses incurred prior to September 30, 2012.
2
Simplified
representation
of
heat
rate
position
in
a
single
TWh
position.
Heat
rate
impacts
are
typically
differentiated
across
plants
and
respective
pricing
periods:
nuclear
and
coal-fueled
plants
generation
(linked
primarily
to
changes
in
North
Hub
7x24),
natural
gas
plants
(primarily
North
Hub
5x16)
and
wind
(primarily
West
Hub7x8).
Assumes
conversion
of
electricity positions based on a ~8.5 market heat rate with natural gas generally
being on the margin ~70-90% of the time (i.e., when coal is forecast to be on the margin, no natural gas
position is assumed to be generated).
3
Includes positions related to fuel surcharge on rail transportation.
4
Excludes fuel surcharge on rail transportation. |
 Estimate as of September 30, 2012; $billions
(pro forma for October 2012 EFIH 1
st
Lien issuance)
EFH / EFIH
TCEH
1
1st Lien
-
$0.75
2
2nd Lien
$0.69
$1.32
3
Total
$0.69
$2.07
Estimated Secured Debt Capacity at EFH / EFIH and TCEH
1
16
2
EFH Corp. debt capacity reduced by any debt issued at EFIH and/or TCEH (other than
indebtedness meeting the requirements of the refinancing carve-out).
3
EFIH debt capacity reduced by any debt issued at EFH Corp. and/or TCEH (other than
indebtedness meeting the requirements of the refinancing carve-out).
4
TCEH debt capacity reduced by any debt issued at EFH Corp. and/or EFIH (other than
indebtedness meeting the requirements of the refinancing carve-out).
5
Of this amount, $1.0B is permitted to be issued for cash (entire amount is
permitted to be issued for exchanges). 6
TCEH is permitted to issue an unlimited amount of additional first-priority
debt in order to refinance the first-priority debt outstanding under the TCEH Senior Secured Facilities.
2,3
5
6
4
$0.75
$0.69
$1.32
$0.69
$2.07
2nd Lien
1st Lien
The debt capacity numbers presented above are for informational purposes only
and should not be relied upon in connection with any investment decision regarding the securities of
EFH Corp. or its subsidiaries. All of these amounts are estimates based on EFH Corp.'s current
interpretation of the covenants set forth in its and its subsidiaries' applicable debt
agreements and do not take into account exceptions in the agreements that may allow for the incurrence
of additional secured debt, including, but not limited to, acquisition debt, coverage ratio
debt, refinancing debt, capital leases and hedging obligations. Moreover, such amounts could change from time to time as a result of, among other things, the
termination of any debt agreement (or specific terms therein) or a change in
the debt agreement that results from negotiations with new or existing lenders. In addition, covenants
included in agreements governing additional, future debt may impose greater or lesser restrictions on
the incurrence of secured debt by EFH Corp. and its subsidiaries. Consequently, the
actual amount of senior secured debt that EFH Corp. and its subsidiaries are permitted to incur under their respective debt agreements could be materially different than the
amounts provided above. EFH Corp. encourages you to review, in
consultation with your own advisors, its and its subsidiaries’ various debt agreements, which are on file with the
SEC, in order to assess the ability and capacity of EFH Corp. and its
subsidiaries to incur additional debt (secured and unsecured) in the future.
1 |
 Key
Drivers 2013 Est. Impact vs.
2012 (millions)
Assumptions
Commodity
$600 -
$700
Smaller open hedge position: ~115M mmbtu
position @ ~$3.05 lower price
1
Change in average hedge price: $0.47/mmbtu
lower average price
1
in
2013 vs 2012 on
~500M
mmbtu
New 2013 power sales at higher expected heat
rate net of lower implied market gas prices on
~68-70 TWh
2
Retail
$60 -
$120
Lower volumes, weather, and continued
competitive pricing environment in 2013
17
2013 TCEH Adjusted EBITDA (non-GAAP) Key Drivers
1
Weighted average prices are based on NYMEX Henry Hub prices of forward natural gas
sales positions in the long-term hedging program (excluding the impact of
offsetting purchases for rebalancing and pricing point basis transactions)
2
Excludes volume committed under a long term purchase contract
2012E TCEH
Adjusted
EBITDA
$2,854
YTD
9/30/12
$?
Q4 |
 18
TCEH Open EBITDA (non-GAAP) Estimate
Assumptions
Units
2013E
Wholesale
Total coal and nuclear generation
TWh
72 –
74
Estimated
power
price
2
$/MWh
$37 -
$39
Average
coal
and
nuclear
cost
3
$/MWh
$30 -
$32
Retail
Revenues
4
$
$4.0 -
$5.0
Profitability
percentage
(after
tax)
5
%
5 -
10%
TCEH
Open
EBITDA
(non-GAAP)
1
Estimate
13E: $ millions
1
Open EBITDA is intended to provide a view of our projected earnings for the fiscal
year ended December 31, 2013, assuming that (1) our expected coal and nuclear
generation for 2013 is sold at market observed forward power prices as of 7/31/2012
less our expected costs to produce the power, including expected fuel expense,
O&M and SG&A expenses, (2) our retail revenues are derived from market
observed retail rates, and (3) we do not engage in any natural gas and power hedging
activities. This is not intended to serve as an indication of what we expect
our earnings to be for the fiscal year ended December 31, 2013, or how we intend to
operate the business. EFH Corp. does not provide projected EBITDA for future
periods and, as a result, there is no comparable GAAP financial measure to which we
can reconcile Open EBITDA.
2
Estimated wholesale power prices for 2013 is based on average ERCOT North Hub
prices as of 7/31/2012. 3
Includes fuel, O&M and SG&A expenses
4
Based on a 10.2¢
/ kWh average residential and ~$1.5 billion of small and large business revenue
based on trailing 12 months (Q4 2011 and Q1-Q3 2012). For
residential
new
offer
pricing
please
go
to
www.powertochoose.org.
5
Calculation assumes a 35% overall tax rate
$700 -
$1,300
2013E |
 19
Today’s Agenda
Q&A
Financial and Operational
Overview
Q3 2012 Review
John Young
President & CEO |
 HSC
Natural Gas Prices $/MMBtu
ERCOT North Hub ATC (7x24) Heat Rate
MMBtu/MWh
Forward Natural Gas Prices and Heat Rates
Forward gas prices have shown some indications of stabilizing.
Near Term heat rates continue to show volatility
1
Calendar 2012 represents market price for the balance of the year. For example,
Calendar 2012 as of September 2012 represents prices from October through December 2012.
2
2014 prices became observable year-end 2011.
20 |
 21
1
ERCOT Capacity, Demand and Reserve (CDR) Summary, May 2012. Prior CDR used
for 2012. 2
ERCOT
filing
on
Reserve
Margin
Analysis,
PUCT
Project
No.
40000,
October
22,
2012.
Resource Adequacy in ERCOT
ERCOT reserve margin
2012A-2017E; percent
Increase from Oct 2012 filing
May 2012 CDR
13.9
13.75% target
reserve margin
Drivers of ERCOT October 2012 filing on
Reserve Margin Analysis
–
Reduced load growth rate to Moody’s “Low”
economic growth forecast
•
Lowered 2013 load forecast by ~1,000
MW (~1.5% lower)
•
Approximately 0.5% reduction of 2013-
2018 annual load growth rate
–
Starting in 2014, added pending resources
not included in May 2012 CDR of ~1,000 MW
Recent and pending PUCT/ERCOT actions
and potential deliberations:
–
Increased system-wide offer cap to $5,000
effective June 1, 2013; $7,000 effective June
1, 2014; and $9,000 effective June 1, 2015
–
ERCOT December CDR Report
–
ERCOT review of whether 13.75% is the
appropriate target reserve margin
–
Continued PUCT evaluation of long-term
solution
16.4
13.4
11.4
12.0
11.1
14.3
9.8
6.9
6.5
5.8
2.1
3.6
4.5
5.5
5.3
'12
'13
'14
'15
'16
'17
1
2 |
 22
Today’s Agenda
Q&A
Financial and Operational
Overview
Q3 2012 Review
EFH Corp. Senior Executive Team |
 23
Questions & Answers |
 24
Appendix –
Additional Slides and
Regulation G Reconciliations
Appendix |
 Financial Definitions
Measure
Definition
Adjusted (non-GAAP)
Operating Results
Net income (loss) adjusted for items representing income or losses that are not
reflective of underlying operating results. These items include
unrealized mark-to-market gains and losses, noncash impairment charges and other charges, credits or gains that
are unusual or nonrecurring. EFH Corp. uses adjusted (non-GAAP) operating
results as a measure of performance and believes that analysis of its business
by external users is enhanced by visibility to both net income (loss) prepared in accordance with
GAAP and adjusted (non-GAAP) operating earnings (losses).
Adjusted EBITDA
(non-GAAP)
EBITDA adjusted to exclude interest income, noncash items, unusual items, results of
discontinued operations and other adjustments allowable under the EFH Corp.
senior secured notes indentures. Adjusted EBITDA plays an important role in respect
of certain covenants contained in these indentures. Adjusted EBITDA is not
intended to be an alternative to GAAP results as a measure
of
operating
performance
or
an
alternative
to
cash
flows
from
operating
activities
as
a
measure
of
liquidity
or
an
alternative to any other measure of financial performance presented in accordance
with GAAP, nor is it intended to be used as a measure of free cash flow
available for EFH Corp.’s discretionary use, as the measure excludes certain cash requirements such as
interest payments, tax payments and other debt service requirements. Because
not all companies use identical calculations, Adjusted EBITDA may not be
comparable to similarly titled measures of other companies. See EFH Corp.’s filings with the SEC for
a detailed reconciliation of EFH Corp.’s net income prepared in accordance with
GAAP to Adjusted EBITDA. Competitive Business
Results
Refers to the combined results of the Competitive Electric segment and
Corporate & Other. Competitive Electric segment refers to the EFH
Corp. business segment that consists principally of TCEH. Contribution Margin
(non- GAAP)
Operating revenues less fuel, purchased power costs, and delivery fees, plus or
minus net gain (loss) from commodity hedging and trading activities, which on
an adjusted (non-GAAP) basis, exclude unrealized gains and losses.
EBITDA
(non-GAAP)
Net income (loss) before interest expense and related charges, income tax expense
(benefit) and depreciation and amortization. GAAP
Generally accepted accounting principles.
Purchase Accounting
The purchase method of accounting for a business combination as prescribed by GAAP,
whereby the purchase price of a business combination
is
allocated
to
identifiable
assets
and
liabilities
(including
intangible
assets)
based
upon
their
fair
values.
The
excess
of the purchase price over the fair values of assets and liabilities is recorded as
goodwill. Depreciation and amortization due to purchase accounting represents
the net increase in such noncash expenses due to recording the fair market values of property,
plant and equipment, debt and other assets and liabilities, including intangible
assets such as emission allowances, customer relationships and sales and
purchase contracts with pricing favorable to market prices at the date of the Merger. Amortization is
reflected in revenues, fuel, purchased power costs and delivery fees, depreciation
and amortization and interest expense in the income statement.
Regulated Business
Refers to the results of the Regulated Delivery segment, which consists largely of
EFH Corp.’s investment in Oncor. 25 |
 26
Table 1: EFH Corp. Adjusted EBITDA Reconciliation
Three and Nine Months Ended September 30, 2011 and 2012
$ millions
1
Includes amortization of the intangible net asset value of retail and wholesale
power sales agreements, environmental credits, coal purchase contracts, nuclear fuel contracts and power
purchase agreements and the stepped-up value of nuclear fuel. Also
includes certain credits and gains on asset sales not recognized in net income due to purchase accounting.
2
Q3 and YTD 11 include impairment of emission allowances and certain mining assets
due to EPA rule issued in July 2011. 3
Represents
amounts
recorded
under
stock-based
compensation
accounting
standards
and
excludes
capitalized
amounts.
4
Includes
incentive
compensation
expenses
as
well
as
professional
fees
and
other
costs
related
to
generation
plant
reliability
and
supply
chain
efficiency
initiatives.
5
Primarily represents Sponsor Group management fees.
6
Includes net third-party fees paid in connection with the April 2011 amendment
and extension of the TCEH Senior Secured Facilities and settlement of amounts due from a hedging/trading
counterparty.
7
Reflects noncapital outage costs.
Factor
Q3 11
Q3 12
YTD 11
YTD 12
Net loss attributable to EFH Corp.
(710)
(407)
(1,776)
(1,408)
Income tax benefit
(443)
(296)
(1,042)
(879)
Interest expense and related charges
1,523
944
3,467
2,746
Depreciation and amortization
379
335
1,119
1,015
EBITDA
749
576
1,768
1,474
Adjustments to EBITDA (pre-tax):
Oncor distributions/dividends
32
31
64
100
Interest income
-
(1)
(2)
(2)
Amortization of nuclear fuel
35
41
104
124
Purchase
accounting
adjustments
1
44
33
182
74
Impairment
and
write-down
of
assets
2
428
8
429
9
Debt extinguishment gains
-
-
(25)
-
Equity in earnings of unconsolidated subsidiary
(113)
(109)
(235)
(249)
Unrealized net (gain) loss resulting from hedging transactions
(138)
526
247
1,290
Noncash
compensation
expense
3
5
4
8
11
Severance expense
49
-
54
1
Transition and business optimization costs
4
16
12
30
31
Transaction and merger expenses
5
9
10
27
29
Restructuring
and
other
6
-
9
74
7
Expenses
incurred
to
upgrade
or
expand
a
generation
station
7
-
9
100
69
EFH Corp. Adjusted EBITDA per Incurrence Covenant
1,116
1,149
2,825
2,968
Add back Oncor adjustments
483
490
1,206
1,254
EFH Corp. Adjusted EBITDA per Restricted Payments Covenant
1,599
1,639
4,031
4,222 |
 27
Table 2: TCEH Adjusted EBITDA Reconciliation
Three and Nine Months Ended September 30, 2011 and 2012
$ millions
1
Includes amortization of the intangible net asset value of retail and wholesale
power sales agreements, environmental credits, coal purchase contracts, nuclear fuel contracts and power
purchase agreements and the stepped-up value of nuclear fuel. Also
includes certain credits and gains on asset sales not recognized in net income due to purchase accounting.
2
Q3 and YTD 11 include impairment of emission allowances and certain mining assets
due to an EPA rule issued in July 2011. 3
Represents
amounts
recorded
under
stock-based
compensation
accounting
standards
and
excludes
capitalized
amounts.
4
Includes
incentive
compensation
expenses
as
well
as
professional
fees
and
other
costs
related
to
generation
plant
reliability
and
supply
chain
efficiency
initiatives.
5
Primarily represents Sponsor Group management fees.
6
Includes net third-party fees paid in connection with the April 2011 amendment
and extension of the TCEH Senior Secured Facilities and settlement of amounts due from a hedging/trading
counterparty.
7
Reflects noncapital outage costs.
8
Represents the annualization of the actual six months ended September 30, 2011
EBITDA results for Oak Grove 2, which achieved the requisite 70% average capacity factor in the second
quarter 2011.
9
Primarily pre-operating expenses related to Oak Grove and Sandow 5 generation
facilities. Factor
Q3 11
Q3 12
YTD 11
YTD 12
Net loss
(709)
(369)
(1,660)
(1,252)
Income tax benefit
(375)
(221)
(874)
(670)
Interest expense and related charges
1,372
749
3,020
2,200
Depreciation and amortization
371
328
1,097
992
EBITDA
659
487
1,583
1,270
Adjustments to EBITDA (pre-tax):
Interest income
(20)
(10)
(66)
(36)
Amortization of nuclear fuel
35
41
104
124
Purchase accounting adjustments
32
33
147
54
Impairment of assets and inventory write down
427
1
427
1
Unrealized net (gain) loss resulting from hedging transactions
(138)
526
247
1,290
Net loss attributable to noncontrolling interests
-
-
-
1
EBITDA amount attributable to consolidated unrestricted subsidiaries
(2)
(2)
(5)
(6)
Corp. depreciation, interest and income tax expense included in SG&A
4
4
11
13
Noncash compensation expense
5
3
8
8
Severance expense
50
-
52
1
Transition and business optimization costs
4
18
11
33
30
Transaction and merger expenses
5
9
10
28
29
Restructuring and other
6
(3)
7
70
6
Expenses incurred to upgrade or expand a generation station
7
-
9
100
69
TCEH Adjusted EBITDA per Incurrence Covenant
1,076
1,120
2,739
2,854
Expenses related to unplanned generation station outages
71
15
162
64
Pro forma adjustment for Oak Grove 2 reaching 70% capacity in Q2
2011
8
7
-
32
-
Other adjustments allowed to determine Adjusted EBITDA per Maintenance Covenant
-
-
8
-
TCEH Adjusted EBITDA per Maintenance Covenant
1,154
1,135
2,941
2,918
2
3`
9
1 |
 28
1
Purchase accounting adjustments consist of amounts related to the accretion of an
adjustment (discount) to regulatory assets. Table 3:
Oncor Adjusted EBITDA Reconciliation Three and Nine Months Ended
September 30, 2011 and 2012 $ millions
Factor
Q3 11
Q3 12
YTD 11
YTD 12
Net income
144
139
302
321
Income tax expense
99
92
197
213
Interest expense and related charges
89
96
265
279
Depreciation and amortization
190
201
540
577
EBITDA
522
528
1,304
1,390
Interest income
(7)
(3)
(25)
(24)
Purchase accounting adjustments
(7)
(6)
(22)
(18)
Transition and business optimization costs and other
7
2
13
6
Oncor Adjusted EBITDA
515
521
1,270
1,354
1 |