Attached files
| file | filename |
|---|---|
| 8-K - FORM 8-K - ARMSTRONG WORLD INDUSTRIES INC | d430507d8k.htm |
| EX-99.2 - EX-99.2 - ARMSTRONG WORLD INDUSTRIES INC | d430507dex992.htm |
| EX-99.1 - EX-99.1 - ARMSTRONG WORLD INDUSTRIES INC | d430507dex991.htm |
Exhibit 99.3

| Earnings Call Presentation 3rd Quarter 2012 October 31, 2012 |

| Safe Harbor Statement Our disclosures in this presentation, including without limitation, those relating to future financial results guidance, and in our other public documents and comments contain forward-looking statements within the meaning of the Private Securities Litigation Reform Act. Those statements provide our future expectations or forecasts and can be identified by our use of words such as "anticipate," "estimate," "expect," "project," "intend," "plan," "believe," "outlook," and other words or phrases of similar meaning in connection with any discussion of the completion of the sale of our cabinets business, or future operating or financial performance. Forward-looking statements, by their nature, address matters that are uncertain and involve risks because they relate to events and depend on circumstances that may or may not occur in the future. As a result, our actual results may differ materially from our expected results and from those expressed in our forward- looking statements. A more detailed discussion of the risks and uncertainties that may affect our ability to achieve the projected performance is included in the "Risk Factors" and "Management's Discussion and Analysis" sections of our reports on Forms 10-K and 10-Q filed with the SEC. Forward-looking statements speak only as of the date they are made. We undertake no obligation to update any forward-looking statements beyond what is required under applicable securities law. In addition, we will be referring to non-GAAP financial measures within the meaning of SEC Regulation G. A reconciliation of the differences between these measures with the most directly comparable financial measures calculated in accordance with GAAP are included within this presentation and available on the Investor Relations page of our website at www.armstrong.com. The guidance in this presentation is only effective as of the date given, October 31, 2012, and will not be updated or affirmed unless and until we publicly announce updated or affirmed guidance. 2 |
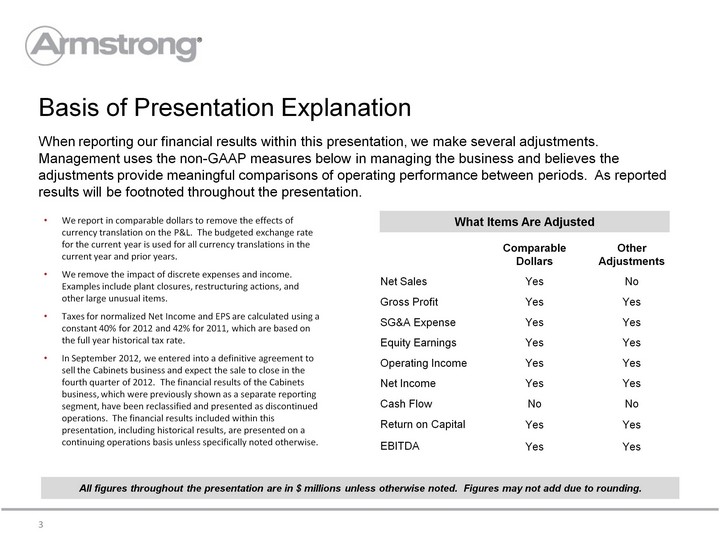
| All figures throughout the presentation are in $ millions unless otherwise noted. Figures may not add due to rounding. Basis of Presentation Explanation When reporting our financial results within this presentation, we make several adjustments. Management uses the non-GAAP measures below in managing the business and believes the adjustments provide meaningful comparisons of operating performance between periods. As reported results will be footnoted throughout the presentation. 3 We report in comparable dollars to remove the effects of currency translation on the P&L. The budgeted exchange rate for the current year is used for all currency translations in the current year and prior years. We remove the impact of discrete expenses and income. Examples include plant closures, restructuring actions, and other large unusual items. Taxes for normalized Net Income and EPS are calculated using a constant 40% for 2012 and 42% for 2011, which are based on the full year historical tax rate. In September 2012, we entered into a definitive agreement to sell the Cabinets business and expect the sale to close in the fourth quarter of 2012. The financial results of the Cabinets business, which were previously shown as a separate reporting segment, have been reclassified and presented as discontinued operations. The financial results included within this presentation, including historical results, are presented on a continuing operations basis unless specifically noted otherwise. Comparable Dollars Other Adjustments Net Sales Yes No Gross Profit Yes Yes SG&A Expense Yes Yes Equity Earnings Yes Yes Operating Income Yes Yes Net Income Yes Yes Cash Flow No No Return on Capital Yes Yes EBITDA Yes Yes What Items Are Adjusted |

| Cabinets Announced sale in Q3 2012 Proceeds of $27 million to be received later in the fourth quarter Treated as discontinued operation starting with Q3 2012 10-Q isolates current and past results of Cabinets segment Patriot Completed sale in Q3 2012 Results included in the Wood Flooring segment 4 Divested Businesses Impact on 2012 Guidance Q3 Q4 2012 Net Sales $35 - $40M $30 - $35M $135-$145M EBITDA ~$5M Impact on Guidance and Y-o-Y Comparisons Q3 2012 Q4 2012 2012 1H 2013 Q3 2013 2013 Net Sales $3-$4M $7 - $8M $10 - $12M $18 - $20M $6 -$7M $24-$27M EBITDA -- Minimal -- -- Minimal -- -- Minimal -- -- Minimal -- -- Minimal -- -- Minimal -- |

| As reported Net Sales: $695 million in 2012 and $734 million in 2011 As reported Operating Income: $109 million in 2012 and $91 million in 2011 As reported EPS: $1.24 in 2012 and $0.88 in 2011 Cash flow information includes cash flows attributable to Cabinets Unadjusted Key Metrics - Third Quarter 2012 2012 2011 Variance Net Sales (1) $698 $714 (2.2)% Operating Income (2) 110 95 15.3% % of Sales 15.8% 13.4% 240 bps EBITDA 135 121 11.1% % of Sales 19.3% 17.0% 230 bps Earnings Per Share (3) $0.97 $0.85 14.2% Free Cash Flow (4) 78 73 5.7% Net Debt 784 467 317 ROIC(5) 9.5% 5.2% 430 bps 5 |
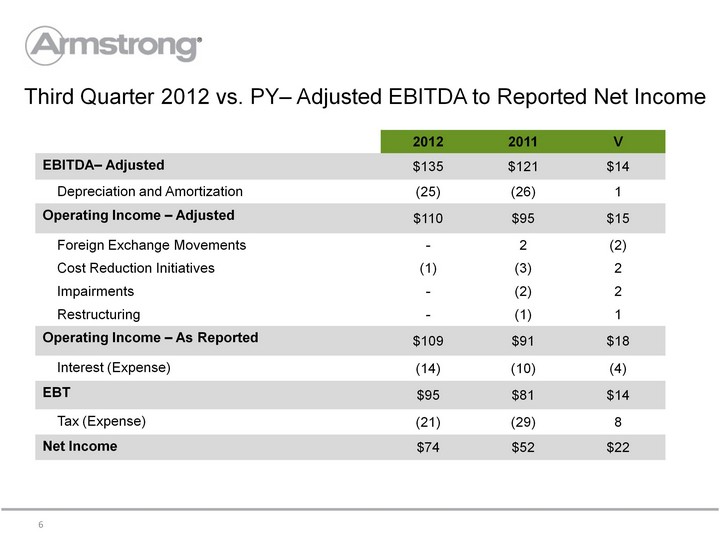
| 2012 2011 V EBITDA- Adjusted $135 $121 $14 Depreciation and Amortization (25) (26) 1 Operating Income - Adjusted $110 $95 $15 Foreign Exchange Movements - 2 (2) Cost Reduction Initiatives (1) (3) 2 Impairments - (2) 2 Restructuring - (1) 1 Operating Income - As Reported $109 $91 $18 Interest (Expense) (14) (10) (4) EBT $95 $81 $14 Tax (Expense) (21) (29) 8 Net Income $74 $52 $22 Third Quarter 2012 vs. PY- Adjusted EBITDA to Reported Net Income 6 |

| Third Quarter Sales and EBITDA by Segment - 2012 vs. PY 7 |

| ($12) EBITDA Bridge - Third Quarter 2012 vs. Prior Year 8 $3 $13 $12 $0 $121 $135 |

| Free Cash Flow - Third Quarter 2012 vs. Prior Year 9 $14 $8 ($6) ($4) $0 ($7) Cash flow information includes cash flows attributable to Cabinets |

| As reported Net Sales: $2,006 million in 2012 and $2,100 million in 2011. As reported Operating Income: $229 million in 2012 and $216 million in 2011 As reported EPS: $2.26 in 2012 and $1.74 in 2011. Cash flow information includes cash flows attributable to Cabinets Unadjusted 2012 Actual 2011 Actual Variance Net Sales (1) $2,002 $2,052 (2.4)% Operating Income (2) 254 244 4.0% % of Sales 12.7% 11.9% 80 bps EBITDA 328 321 2.0% % of Sales 16.4% 15.7% 70 bps Earnings Per Share (3) $2.17 $2.05 5.7% Free Cash Flow (4) 64 80 (19.8)% Net Debt 784 467 317 ROIC(5) 9.5% 5.2% 430 bps Key Metrics - September YTD 2012 10 |

| September YTD Sales and EBITDA by Segment - 2012 vs. 2011 11 |

| ($41) EBITDA Bridge - September YTD 2012 vs. Prior Year 12 |

| Free Cash Flow - September YTD 2012 vs. Prior Year 13 ($15) ($5) ($34) $11 ($2) $29 Cash flow information includes cash flows attributable to Cabinets |

| Cost Savings Program Cost Savings Program 14 Incremental Savings ($M) Total Cumulative Savings $35M $150M $200M $20 $15 $65 $50 $40 Structural Manufacturing and Productivity Improvements Cumulative savings of $200 million achieved from manufacturing and SG&A. Cost Out Program Evolution 2010 - program introduced with $150M goal Mid 2011 - increased to $165M goal Year end 2011 - increased to $185M goal Mid 2012 - increased to $200M goal $10 SG&A Savings |

| 2012 Estimate Range 2012 Estimate Range 2012 Estimate Range 2011 Variance Variance Variance Net Sales(1) 2,600 to 2,650 2,723 (5)% to (3)% Operating Income(2) 285 to 315 273 4% to 15% EBITDA 385 to 415 375 3% to 11% Earnings Per Share(3) $2.35 to $2.65 $2.23 5% to 19% Free Cash Flow 50 to 80 170 (71)% to (53)% Net sales include foreign exchange impact As reported Operating Income: $250- $280 million in 2012 and $240 million 2011 As reported earnings per share: $2.40- $2.70 in 2012 and $1.91 in 2011 Key Metrics - Guidance 2012 15 |

| 2012 Financial Outlook $10 - $20 million increase Adjusted Gross Margin +50 to +100 bps vs. 2011 $12 million; 60% manufacturing, 40% SG&A Flat vs. 2011 $10 - $20 million. Adjusted ETR of ~40% Sales(1) $585 - $635 million EBITDA $60 - $90 million $210 - $230 million $10 - $15 million associated with already announced actions Raw Material & Energy Inflation * Manufacturing Productivity U.S. Pension Credit Earnings from WAVE Cash Taxes/ETR Q4 Capital Spending* Exclusions from EBITDA 16 * Changed from July Outlook (1) Net sales include foreign exchange impact |

| Appendix 17 |
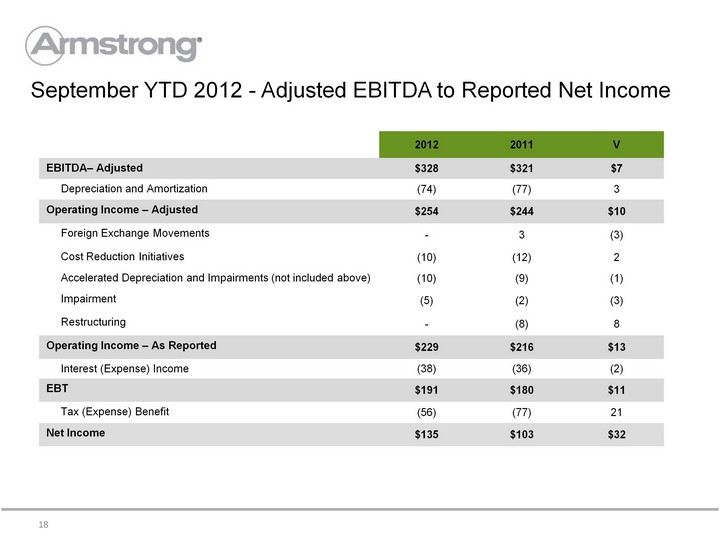
| 2012 2011 V EBITDA- Adjusted $328 $321 $7 Depreciation and Amortization (74) (77) 3 Operating Income - Adjusted $254 $244 $10 Foreign Exchange Movements - 3 (3) Cost Reduction Initiatives (10) (12) 2 Accelerated Depreciation and Impairments (not included above) (10) (9) (1) Impairment (5) (2) (3) Restructuring - (8) 8 Operating Income - As Reported $229 $216 $13 Interest (Expense) Income (38) (36) (2) EBT $191 $180 $11 Tax (Expense) Benefit (56) (77) 21 Net Income $135 $103 $32 September YTD 2012 - Adjusted EBITDA to Reported Net Income 18 |

| 2012 Estimate Range 2012 Estimate Range 2012 Estimate Range Adjusted Operating Income 285 to 315 D&A 100 100 100 Adjusted EBITDA 385 to 415 Changes in Working Capital 5 to (15) Capex (210) to (230) Pension Credit (12) (12) (12) Interest Expense (50) to (55) Cash Taxes (10) to (20) Other, including cash payments for restructuring and one-time items (25) (25) (25) Free Cash Flow 50 to 80 Adjusted Operating Income to Free Cash Flow 19 |

| Third Quarter Third Quarter Third Quarter Third Quarter Third Quarter Third Quarter Third Quarter Third Quarter Third Quarter Third Quarter 2012 Reported Comparability(1) Adjustments FX(2) Adj 2012 Adjusted 2011 Reported Comparability(1) Adjustments FX(2) Adj 2011 Adjusted 2011 Adjusted Net Sales 695 - 3 698 734 - (20) 714 714 Operating Income 109 1 - 110 91 6 (2) 95 95 EPS $1.24 ($0.27) $- $0.97 $0.88 ($0.02) ($ 0.01) $0.85 $0.85 YTD YTD YTD YTD YTD YTD YTD YTD YTD YTD 2012 Reported Comparability(1) Adjustments FX(2) Adj 2012 Adjusted 2011 Reported Comparability(1) Adjustments FX(2) Adj FX(2) Adj 2011 Adjusted Net Sales 2,006 - (4) 2,002 2,100 - (48) (48) 2,052 Operating Income 229 25 - 254 216 31 (3) (3) 244 EPS $2.26 ($0.09) - $2.17 $1.74 $0.34 ($0.03) ($0.03) $2.05 See earnings press release and 10-Q for additional detail on comparability adjustments Eliminates impact of foreign exchange movements Consolidated Results 20 |

| Third Quarter Third Quarter Third Quarter Third Quarter Third Quarter Third Quarter Third Quarter 2012 Reported Comparability(1) Adjustments 2012 Adjusted 2011 Reported Comparability(1) Adjustments 2011 Adjusted Building Products 81 - 81 72 1 73 Resilient Flooring 25 2 27 11 4 15 Wood Flooring 14 (1) 13 17 - 17 Unallocated Corporate (Expense) Income (11) - (11) (9) (1) (10) YTD YTD YTD YTD YTD YTD YTD 2012 Reported Comparability(1) Adjustments 2012 Adjusted 2011 Reported Comparability(1) Adjustments 2011 Adjusted Building Products 178 22 200 191 11 202 Resilient Flooring 58 2 60 21 18 39 Wood Flooring 30 - 30 34 (1) 33 Unallocated Corporate (Expense) Income (37) 1 (36) (30) - (30) Segment Operating Income (Loss) 21 Eliminates impact of foreign exchange movements and non-recurring items; see earnings press release and 10-Q for additional detail. |

| Third Quarter Third Quarter YTD YTD ($ millions) 2012 2011 2012 2011 Net cash from operations 112 98 141 130 Net cash (used for) investing (20) (20) (61) (42) Add back (subtract) adjustments to reconcile to free cash flow Restricted cash - (5) (2) (8) Acquisition/ (Divestiture) (14) - (14) - Free Cash Flow 78 73 64 80 Cash Flow 22 Cash flow information includes cash flows attributable to Cabinets |