Attached files
| file | filename |
|---|---|
| 8-K - FORM 8-K - PATHEON INC | d430517d8k.htm |
| EX-2.1 - STOCK PURCHASE AGREEMENT BY AND AMONG SOBEL BEST N.V., VION HOLDING N.V. AND PAT - PATHEON INC | d430517dex21.htm |
| EX-10.1 - COMMITMENT LETTER - PATHEON INC | d430517dex101.htm |
| EX-99.1 - ACQUISITION PRESS RELEASE - PATHEON INC | d430517dex991.htm |
| EX-10.2 - EQUITY COMMITMENT LETTER BETWEEN JLL PARTNERS V, L.P. AND PATHEON INC. - PATHEON INC | d430517dex102.htm |
| EX-99.2 - REFINANCING PRESS RELEASE - PATHEON INC | d430517dex992.htm |
 Patheon’s
Acquisition of Banner Pharmacaps October 29, 2012
Building the Pharmaceutical Industry’s
Leading Contract Development & Manufacturing Organization
Exhibit 99.3 |
 1
Forward-Looking Statements
This presentation contains forward-looking statements or information which reflect our
expectations regarding possible events, conditions, our future growth, results of
operations, performance, and business prospects and opportunities. All statements, other
than statements of historical fact, are forward-looking statements. Forward-looking
statements necessarily involve significant known and unknown risks, assumptions and
uncertainties that may cause our actual results in future periods to differ materially
from those expressed or implied by such forward-looking statements, including risks related
to our ability to complete the proposed acquisition of Banner and the related equity and
debt financings; integration of and achievement of our intended objectives with respect
to our acquisition of Banner; and compliance with our debt covenants and our debt service obligations. For additional
information regarding risks and uncertainties that could affect our business, please see our
2011 Form 10-K and our subsequent filings with the U.S. Securities and Exchange
Commission and the Canadian Securities Administrators. Accordingly, you are
cautioned not to place undue reliance on forward-looking statements. These
forward-looking statements are made as of the date hereof, and except as required by
law, we assume no obligation to update or revise them to reflect new events or circumstances.
Use of Non-GAAP Financial Measures References in
these slides to "Adjusted EBITDA" are to income (loss) before discontinued operations before repositioning
expenses, interest expense, net, foreign exchange losses reclassified from other comprehensive
income, refinancing expenses, gains and losses on sale of fixed assets, gain on
extinguishment of debt, income taxes, asset impairment charge, depreciation and
amortization and other income and expenses. References in these slides to
"EBITDA per the Debt Commitment Letter" are to Adjusted EBITDA adjusted for
certain non-cash or other costs, including stock-based compensation expenses, consulting fees and
executive severance, cost savings, on a pro forma basis, from transformational initiatives
implemented by management and the estimated annualized cost savings from the
acquisition.
Since Adjusted EBITDA and EBITDA per the Debt Commitment Letter are non-GAAP measures that
do not have a standardized meaning, they may not be comparable to similar measures
presented by other issuers. You are cautioned that these non-GAAP measures are
not based on any comprehensive set of accounting rules or principles and should be considered only in conjunction
with, and not as a substitute for, or superior to, income (loss) before discontinued operations
determined in accordance with GAAP as indicators of performance, and EBITDA per the Debt
Commitment Letter should be considered only in conjunction with, and not as a substitute
for, or superior to, operating cash flow as an indicator of liquidity. Reconciliations of these non-GAAP measures to
their closest U.S. GAAP measures are included in the Appendix to this presentation. |
 2
Transaction Overview
Transaction
Consideration
Valuation and
Financial
Impact
Timeline
•
Patheon to acquire Banner Pharmacaps, a specialty pharmaceutical
company
dedicated
to
the
research,
development
and
manufacturing
of
unique gelatin-based dosage forms
•
Total consideration to amount to USD 255 million, subject to
adjustments
•
Committed financing for 100% of transaction value
•
Expected to close by end of calendar year 2012
•
Subject to applicable regulatory approvals and other customary terms
and conditions
•
Expected EBITDA per the Debt Commitment Letter to be approx. USD
140 million for combined enterprise
•
Expected to be accretive within two years |
 3
Strategic Rationale
•
Banner is the world’s second largest pharmaceutical business in manufacturing
softgels for OTC, prescription and nutritional consumer products
•
Leader in fast-growing complementary technology with a broad product
and intellectual property portfolio
•
Owns state-of-the-art facilities and expands Patheon’s
geographical presence,
notably
in
emerging
markets
•
Creates platform to grow Patheon’s contract manufacturing
operations (CMO) and pharmaceutical development services (PDS)
businesses
Building a USD 1 billion enterprise in a highly fragmented industry segment
|
 4
Banner Acquisition is Consistent with our Strategy
•
Increases capability and scale in
complex solid dosage formats
•
Higher margins from proprietary
technologies and products
•
Provides immediate access to
Latin America market with Mexico
facility and direct to market
business
•
Emerging market presence
•
Offers proprietary technology
portfolio in softgels as well as
product ownership
•
Second largest pharmaceutical
business focused on delivering
proprietary softgel formulations
for OTC, prescription and
nutritional consumer products
STRENGTHEN CORE
OPERATIONS
SELL BUSINESS
DIFFERENTLY
ENTER LOGICAL
ADJACENCIES
DRIVE INDUSTRY
CONSOLIDATION |
 5
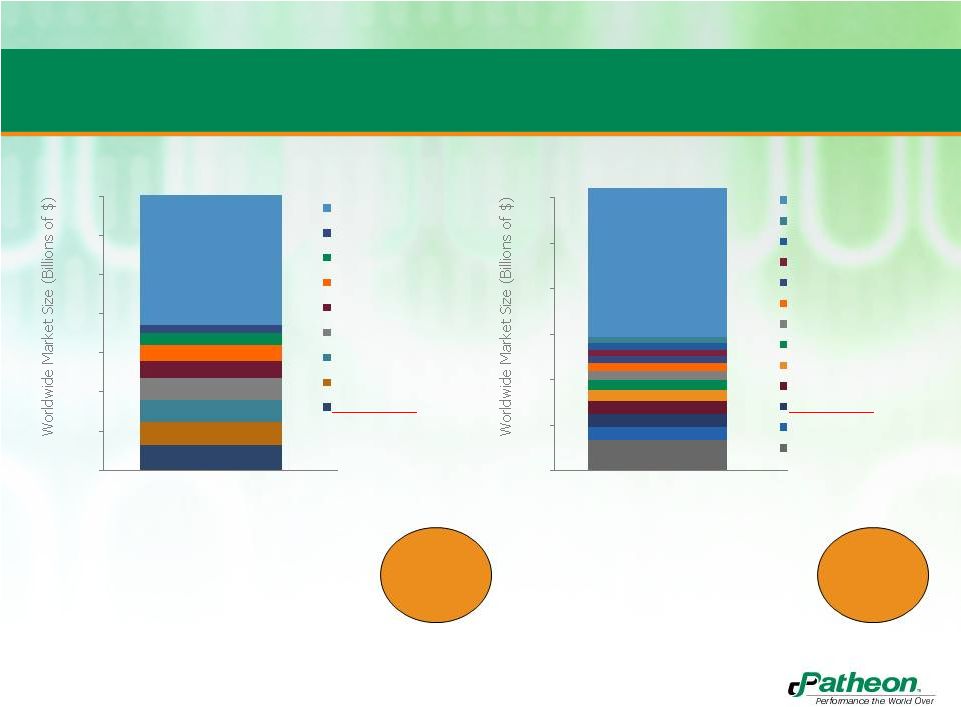
•
Improving growth rates
•
Majority of players are private
$1.4 B
(+7.5%)
PharmSource data included for PDS services where Patheon participates
(preformulation; formulation; analytical; CTM).
Does not include packaging.
Growing Market Share in a Highly Fragmented
Marketplace
$12.3 B
(+5%)
•
Historical growth (5% CAGR)
•
Modest growth projections
(3% to 5% from “organic
growth”, higher in steriles)
1.4
1.2
1.0
0.8
0.6
0.4
0.2
0
2011
12
10
8
6
4
2
0
2011
PDS MARKET CHARACTERISTICS
CMO MARKET CHARACTERISTICS
100+ Others (47%)
Catalent (3%)
AAIPharma (4%)
Aptuit (6%)
PPD (6%)
SGS (8%)
Lancaster Labs (8%)
Almac (9%)
Patheon (9%)
All Other (52%)
LTS (2%)
Corden Pharma (2%)
Hospira (2%)
Recipharm (2%)
Aenova (3%)
Haupt (3%)
Vetter (4%)
FAREVA Holdings (4%)
Famar (5%)
Patheon (5%)
Baxter (5%)
Catalent (11%)
#1 Market
Share
#2 Market
Share |
 6
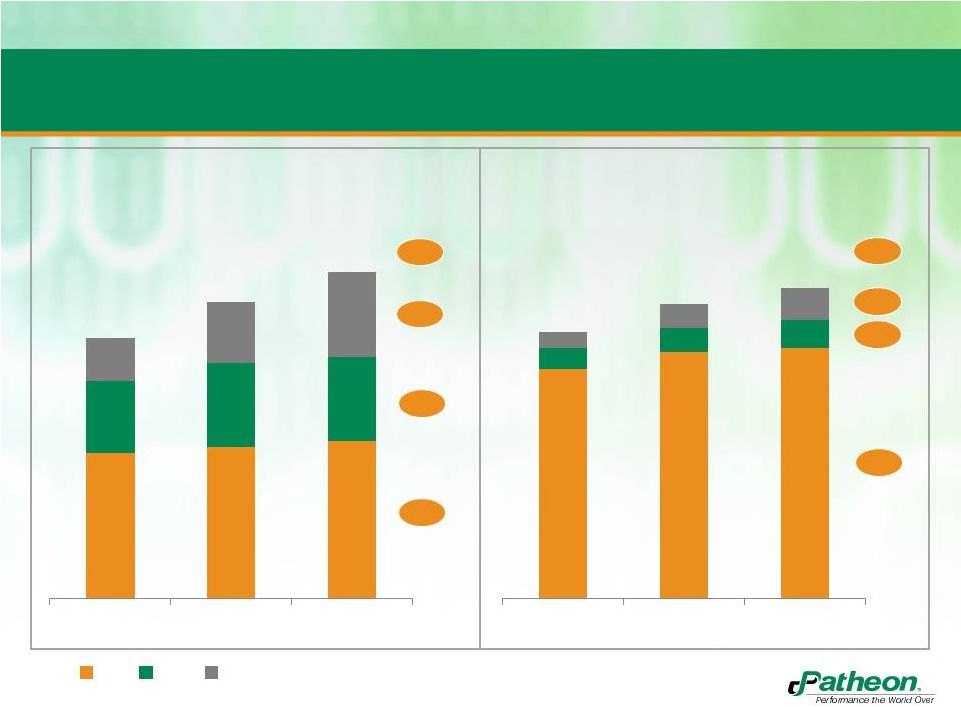
Softgel Market has Experienced Continued Growth
Historically
18%
4%
2%
6%
CAGR
07-11
CAGR
07-11
18%
8%
2%
3%
5.4
4.9
4.3
7.7
7.4
6.7
Source: Commissioned Report
2.4
2.5
2.6
1.2
1.4
1.4
0.7
1.0
1.4
2007
2009
2011
U.S. Softgel Market
Billion units
5.7
6.1
6.2
0.5
0.6
0.7
0.4
0.6
0.8
2007
2009
2011
U.S. Softgel Market
Billion $
Nutritional
OTC
Rx |
 7
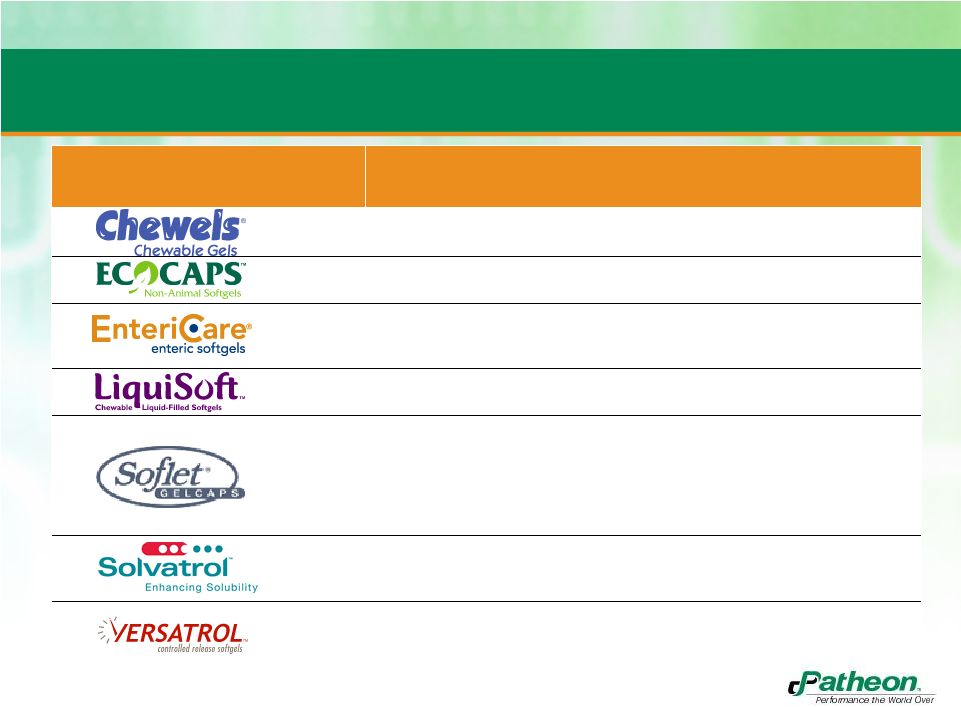
Type of Technology
Main Features
•
Attractive dosage form for pediatric and geriatric patients
•
Masks tastes and odors
•
Non-animal based gelatin alternative
•
pH and heat tolerant
•
Enteric feature reduces reflux and gastric irritation
•
Enteric
features
lie
within
the
shell
itself
–
therefore
clear
capsules
•
Attractive dosage form for pediatric and geriatric patients
•
Masks tastes and odors
•
Masks tastes and odors
•
Provides a multitude of color combinations; allows surface printing
•
Patented technology is difficult to mimic, providing easy recognition of
tampering or counterfeiting by consumers or pharmacists
•
Provides enhanced bioavailability of the API and lessens biovariability
•
Controlled release suitable for lipophilic and hydrophilic drugs
•
Drug release can be tailored to desired rate and extent
•
Abuse resistance
Banner’s Proprietary Softgel Technologies |
 8
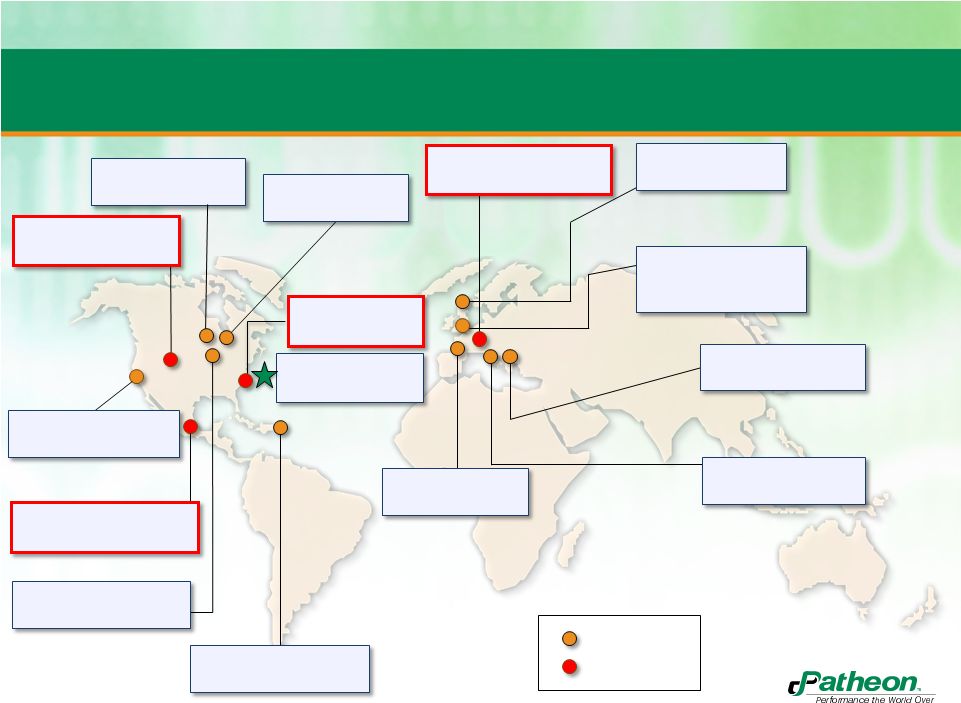
Expanded Global Network
8
Toronto, Canada
(PDS, CMO solids)
Olds, Alberta Canada
(CMO)
San Francisco, USA
(PDS development)
Naucalpan, Edo., Mexico
(CMO/softgel, R&D)
Cincinnati, USA
(PDS, CMO solid)
Manatí, Puerto Rico
(CMO solids)
Whitby, Canada
(PDS, CMO solids)
High Point, USA
(R&D, CMO)
RTP, USA
HQ
Bourgoin, France
(PDS, CMO solids)
Tilburg, The Netherlands
(CMO/softgel)
Swindon, England
(PDS, CMO sterile)
Milton Park, England
(PDS development)
(included in Swindon)
Monza, Italy
(CMO solid/sterile)
Ferentino, Italy
(PDS, CMO sterile)
Patheon
Banner |
 9
•
Total consideration is USD 255 million, subject to adjustments
•
Committed financing for transaction value, associated expenses and
repayment of existing debt, and for general corporate purposes
•
We expect that Patheon’s Adjusted EBITDA margin will benefit from
the integration of Banner’s operations and expected synergies
–
Expected EBITDA per the Debt Commitment Letter to be approx. USD
140
million for the combined enterprise
–
Expected to be accretive within two years
–
Expected to realize about USD 12.5 million/year in SG&A synergies
Financial Impact |
 10
Quarterly Adjusted EBITDA and EBITDA per Debt
Commitment Letter
U.S.D., in millions
Actual results
Estimated results
Q1'12
Q2'12
Q3'12
Q4'12
FYE'12
Adjusted EBITDA
(9.2)
9.7
34.6
33.9
69.0
Non-cash items
0.7
1.3
0.4
0.9
3.3
Consulting fees
6.3
6.0
1.0
0.0
13.3
Other items
0.4
2.4
0.0
0.0
2.8
Pro forma cost savings
7.8
5.2
0.6
0.2
13.8
Patheon EBITDA per the Debt Commitment letter
$6.0
$24.6
$36.6
$35.0
$102.2
Estimated Banner pro forma adjusted EBITDA
25.0
Estimated cost savings from combination
12.5
EBITDA per the Debt Commitment Letter
$139.7
Patheon (loss) income before discontinued operations
(19.3)
(79.6)
15.5
(19.2)
(102.6)
Patheon operating cash flow
9.9
(32.8)
29.7
16.8
23.6
Patheon investing cash flow
(6.5)
(11.0)
(15.2)
(16.6)
(49.3)
Patheon financing cash flow
(2.9)
30.6
2.6
(4.3)
26.0 |
 11
Q&A |
 12
Building the Pharmaceutical Industry’s Leading
Contract Development & Manufacturing Organization
Combination
Timeline
Valuation and
Financial
Impact
•
Adds well-balanced product and intellectual property portfolio with
complementary technology platforms
•
Builds scale, expands capacity and broadens footprint in emerging
markets
•
Expected to close by end of calendar 2012
•
Subject to applicable regulatory approvals and other customary terms
and conditions
•
Expected
EBITDA
per
the
Debt
Commitment
Letter
to
be
approx.
USD
140
million
for
combined
enterprise
•
Expected
to
be
accretive
within
two
years |
 Appendix
|
 14
U.S. Non-GAAP Reconciliation
Adjusted EBITDA
(U.S.D., in millions)
(unaudited)
Actuals
Estimate
Q1 2012
Q2 2012
Q3 2012
Q4 2012
Full Year
Adjusted EBITDA
(9.2)
9.7
34.6
33.9
69.0
Depreciation and amortization
(10.6)
(10.8)
(9.3)
(9.9)
(40.6)
Repositioning expenses
(0.8)
(6.0)
(0.1)
1.7
(5.2)
Interest expense, net
(6.5)
(6.5)
(6.8)
(6.6)
(26.4)
Impairment charge
-
(57.9)
-
-
(57.9)
Loss on sale of capital assets
-
-
-
(0.6)
(0.6)
Benefit (provision) for income taxes
7.7
(8.0)
(3.3)
(38.3)
(41.9)
Miscellaneous
0.1
(0.1)
0.4
0.6
1.0
(Loss) income before discontinued operations
(19.3)
(79.6)
15.5
(19.2)
(102.6) |
 15
U.S. Non-GAAP Reconciliation
(1) Represents Banner Pharmacaps expected earnings
before interest expense, income tax expense, depreciation
and amortization, foreign exchange gains and losses,
management fees, other income and expense, and $1.7
million in pricing allowances related to prior period sales
recorded in the 12 months ended October 31, 2012.
(2) Represents estimated annual synergies resulting from
Patheon's expected acquisition of Banner Pharmacaps
assuming completion of integration activities.
(3) Represents amortization of stock-based compensation
and non-cash foreign exchange gains and losses.
(4) Represents consulting fees related to Patheon's
operational excellence program recorded in the 12 months
ended October 31, 2012.
(5) Represents expenses related to a 2011 product recall by
one of Patheon's customers for product returns recorded in
the second quarter of fiscal 2012 and executive severance
paid to the company's former CFO in the first quarter of fiscal
2012.
(6) Represents additional estimated savings from operational
excellence projects and Puerto Rico overhead savings that
Patheon expects that it would have recognized in fiscal 2012
had all such projects been completed and fully implemented
as of November 1, 2011.
Actuals
Estimate
Q1 2012
Q2 2012
Q3 2012
Q4 2012
Full Year
EBITDA per the Debt Commitment Letter
139.7
Estimated Banner pro forma adjusted EBITDA (1)
(25.0)
Estimated cost savings from combination (2)
(12.5)
Patheon EBITDA per the Debt Commitment Letter
6.0
24.6
36.6
35.0
102.2
Non-cash items (3)
(0.7)
(1.3)
(0.4)
(0.9)
(3.3)
Consulting fees (4)
(6.3)
(6.0)
(1.0)
-
(13.3)
Other items (5)
(0.4)
(2.4)
-
-
(2.8)
Pro forma cost savings (6)
(7.8)
(5.2)
(0.6)
(0.2)
(13.8)
Depreciation and amortization
(10.6)
(10.8)
(9.3)
(9.9)
(40.6)
Repositioning expenses
(0.8)
(6.0)
(0.1)
1.7
(5.2)
Interest expense, net
(6.5)
(6.5)
(6.8)
(6.6)
(26.4)
Impairment charge
-
(57.9)
-
-
(57.9)
Loss on sale of capital assets
-
-
-
(0.6)
(0.6)
Benefit (provision) for income taxes
7.7
(8.0)
(3.3)
(38.3)
(41.9)
Miscellaneous
0.1
(0.1)
0.4
0.6
1.0
(Loss) income before discontinued operations
(19.3)
(79.6)
15.5
(19.2)
(102.6)
Adjustments for non-cash items
Depreciation and amortization
10.6
10.8
9.3
9.9
40.6
Stock-based compensation expense
1.0
0.8
0.7
0.9
3.4
Impairment charge
-
57.9
-
-
57.9
Loss on sale of capital assets
-
-
-
(0.6)
(0.6)
Deferred revenue amortization
(2.4)
(2.6)
(2.6)
(4.1)
(11.7)
Deferred financing charge amortization
0.3
0.3
0.3
0.2
1.1
Working capital changes
16.1
(27.7)
1.7
(3.1)
(13.0)
Change in other long term assets/liabilities
(1.4)
2.0
(2.6)
29.0
27.0
Change in deferred revenue
5.3
5.3
8.1
4.3
23.0
Miscellaneous
(0.3)
-
(0.7)
(0.5)
(1.5)
Cash flow from operating activities
9.9
(32.8)
29.7
16.8
23.6
Cash flow from investing activities
(6.5)
(11.0)
(15.2)
(16.6)
(49.3)
Cash flow from financing activities
(2.9)
30.6
2.6
(4.3)
26.0
EBITDA per the Debt Commitment Letter
(U.S.D., in millions)
(unaudited) |