Attached files
| file | filename |
|---|---|
| 8-K - FORM 8-K - IEC ELECTRONICS CORP | v326782_8k.htm |
| EX-99.2 - EXHIBIT 99.2 - IEC ELECTRONICS CORP | v326782_ex99-2.htm |
SLIDE PRESENTATION

October 2012

This presentation contains certain forward - looking statements related to the Company’s expectations and prospects that involve risks and uncertainties, including uncertainties associated with economic conditions in the electronics industry, particularly in the principal industry sectors served by the Company, changes in customer requirements and in the volume of sales to principal customers, competition and technological change, the ability of the Company to control manufacturing and operating costs, the ability of the Company to develop and maintain satisfactory relationships with vendors, and the ability of the Company to efficiently integrate acquired companies into its business. The Company's actual results of operations may differ significantly from those contemplated by any forward - looking statements as a result of these and other factors, including factors set forth in the Company's 2011 Annual Report on Form 10 - K and in other filings with the Securities and Exchange Commission, all of which may be found in the Investor Relations section of the Company’s website at www.iec - electronics.com. The Company undertakes no obligation to publicly update or revise forward - looking information, whether as a result of new, updated information, future events or otherwise. In addition, references to non - GAAP financial measures in this presentation are reconciled to GAAP in the Investor Relations section of the Company’s website, iec - electronics.com. 2 Safe Harbor Statement

3 Agenda Company overview Our industry and what makes us different Financial highlights Capital priorities + future growth

4 A small, rapidly growing company Who is IEC Electronics?

5 Our Progress IEC Electronics Corp. Revenue $19.1M Net Profit EBITDA** * Trailing 12 Months as of June 29 **EBITDA reconciliation to GAAP available at www.iec - electronics.com 2005 Today (TTM)* $142.8M $8.4M EBITDA Margin $1.1M 5.6% $15.7M 11% $285K

6 Domestic Niche: 100% U.S. - based contract manufacturer headquartered near Rochester, NY ▪ Complex electronics ▪ Security of customer designs ▪ Government restrictions Growth: 2005 - 2011 CAGR of 38% ▪ Organic growth of 20+% Margins: Industry’s top tier 9.9 million shares outstanding – Insiders control ~ 18% Overview

7 Overarching Guidelines Is IEC in a competitive position? □ Do we have a solid business model? Have we been successful growing our business? Are our markets growing?

8 Overarching Guidelines □ Do we have a solid business model? Have we been successful growing our business? Are our markets growing?

9 Are Our Markets Growing? ▪ YES* – Military: IEC programs & platforms are growing, despite sequestration ▪ UAVs ▪ Legacy programs ▪ NASA – Medical instrumentation growing 6+% – Industrial – Flat *Source: Frost & Sullivan, Internal Studies, Media

10 2008 2011 Business Transition 2008 : 0% Medical 2011 : 22% Medical

▪ “Absolutely Positively Perfect and On - Time” (SM) ▪ Recognition from our customers: – Raytheon 3 star (twice) – Boeing small business of the year – NASA small business of the year – ViaSat small business of the year Performance 11 Building Our Edge ▪ Military and Aerospace ▪ Medical ▪ Industrial ▪ Satellite Communications Targeted Market ▪ Counterfeit chip analysis capability ▪ Services brought together in one company Technology ▪ Analytical laboratories ▪ Proprietary manufacturing execution and reporting systems Unique Capability Technology Performance Unique Capability Targeted Markets

12 Military Market We support electronic warfare We have all read that military budget is likely to be cut Our segment of the budget is a higher priority

13 Communications Intersecting the Military Market 13 Hanscom AFB

14 Some of Our Platforms

15 More Platforms

16 Overarching Guidelines □ Do we have a solid business model? Have we been successful growing our business? Are our markets growing?

17 High volume, low margin, commoditized business Misperception 1: Companies are interchangeable Misperception 2: Programs can be easily exported outside the U.S. Our Industry Basic EMS Price is the key decision variable

18 We Don’t Make These

19 Nor These
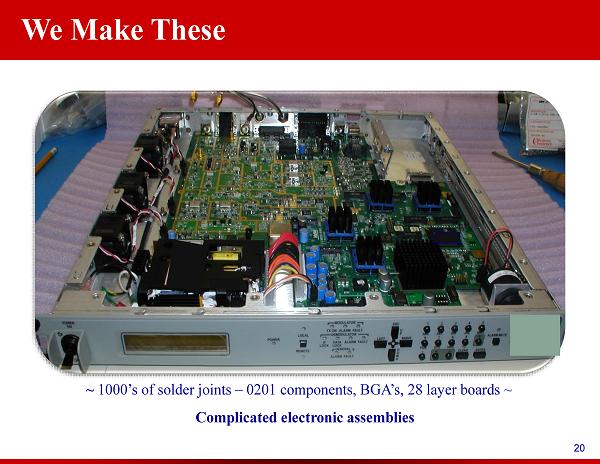
20 ~ 1000’s of solder joints – 0201 components, BGA’s, 28 layer boards ~ Complicated electronic assemblies We Make These
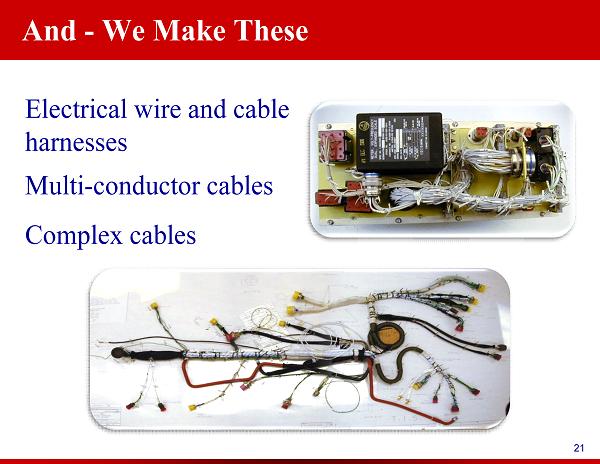
21 And - We Make These Electrical wire and cable harnesses Multi - conductor cables Complex cables

22 Medical Devices & Diagnostic Equipment Locomotive & Signaling Products Satellite Communication Commercial & Government Secure Defense Communications Advanced Defense & Aerospace Systems Combat Defense Systems For Applications Like These

23 And Applications Like These

24 We Help Our Customers Succeed Common Denominator: SOPHISTICATED & COMPLEX MANUFACTURING NEEDS Technology

25 High volume, low margin, commoditized business Misperception 1: Companies are interchangeable Misperception 2: Programs can be easily exported outside the U.S. Our growth has not happened by accident Our Industry Unique Capability and Technology Basic EMS Price is the key decision variable

26 26 Do We Have a Solid Business Model? Strategy: Implementation: Identify key market segments where we have or can build comparative advantage – barriers to entry Leverage our business units to capture greater economic value Invest in adding capability which creates economic value for the organization

27 Creating a Unique Solution Customer Newark, NY Victor, NY Albuquerque, NM Rochester, NY Bell Gardens, CA

28 Technology Specialization Customer

29 Overarching Guidelines □ Do we have a solid business model? Have we been successful growing our business? Are our markets growing?

30 $0.03 $0.03 $0.04 $0.11 $0.68 $0.48 $0.31 $0.00 $0.10 $0.20 $0.30 $0.40 $0.50 $0.60 $0.70 2005 2006 2007 2008 2009 2010 2011 EPS $- $20,000.00 $40,000.00 $60,000.00 $80,000.00 $100,000.00 $120,000.00 $140,000.00 Revenues Reported EPS Revenues (000’s) 2007, 2008, 2009 adjusted to reflect a 35% tax rate ▪ 7 consecutive years of solid revenue growth ▪ 7 consecutive years of steady earnings growth ▪ 7 consecutive years of consistent cash flow growth ▪ Debt less than 2x forecasted EBITDA ▪ An 8 th is on the way A Growing Company

A Growing Company 5.5% 2007, 2008, 2009 adjusted to reflect a 35% tax rate Forecasted range 1.5% 1.0% 0.8% 2.1% 4.5% 4.8% 5.3% 5.1% $0 $1,000 $2,000 $3,000 $4,000 $5,000 $6,000 $7,000 $8,000 $9,000 2005 2006 2007 2008 2009 2010 2011 2012 Fcst - 0.5% 0.5% 1.5% 2.5% 3.5% 4.5% 5.6% Net Income Net Income Margin Millions

$346 $598 $985 $2,392 $4,820 $7,687 $10,389 $1,664 $1,269 $1,353 $2,464 $5,389 $9,093 $14,674 $0 $2,000 $4,000 $6,000 $8,000 $10,000 $12,000 $14,000 $16,000 $18,000 $20,000 2005 2006 2007 2008 2009 2010 2011 2012 2012 Estimated Operating Income and EBITDA* Growth EBITDA (000’s) (21 - 23%) $17,800 to $18,100 Estimate * EBITDA reconciliation to GAAP is available at www.iec - electronics.com $12,600 to $12,900 Operating Income EBITDA 2012 Estimated Growth

33 33 How Do We Compare to Our Peers? IEC Benchmark Plexus SigmaTron Sparton SMTC Company Flextronics Jabil Celestica CTS Net Margin* Sanmina Nortech Sys. KeyTronics 5.87 1.78 2.65 2.93 3.54 1.74 2.30 3.36 0.59 0.55 0.48 2.52 4.25 IEC Benchmark Plexus KeyTronics SigmaTron Sparton SMTC Company Revenue Change* Flextronics Jabil Celestica CTS Sanmina Nortech Sys. 13.69 - 0.47 - 6.05 3.83 3.32 - 5.79 8.40 11.73 9.95 0.06 1.46 - 0.51 30.49 * As of the latest publicly reported quarter – sources: Yahoo Finance and Company information
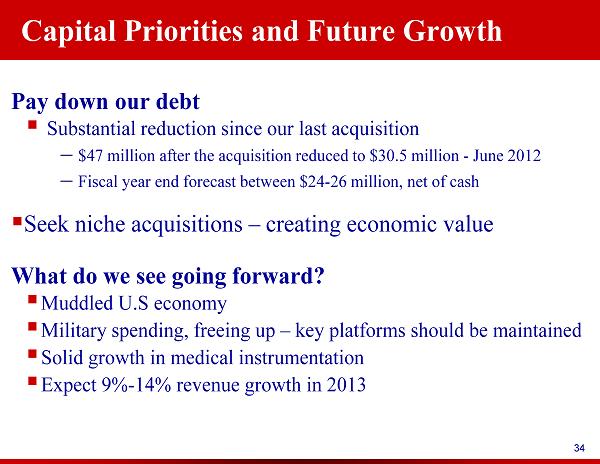
34 34 Capital Priorities and Future Growth Pay down our debt ▪ Substantial reduction since our last acquisition – $47 million after the acquisition reduced to $30.5 million - June 2012 – Fiscal year end forecast between $24 - 26 million, net of cash ▪ Seek niche acquisitions – creating economic value What do we see going forward? ▪ Muddled U.S economy ▪ Military spending, freeing up – key platforms should be maintained ▪ Solid growth in medical instrumentation ▪ Expect 9% - 14% revenue growth in 2013

Operating Margin Gross Margin Percent 35 2009 2010 2011 16.0% 18.2% Target (2014 +) Looking Forward 7.1% 8.0% 7.8% 9.0 - 10.5% 16.8% 19.5 - 21% 9.0 - 10.5%

36 Overarching Guidelines Is IEC in a competitive position? YES □ Do we have a solid business model? YES Have we been successful growing our business? YES Are our markets growing? YES

37 Questions Thank you for listening