Attached files
| file | filename |
|---|---|
| 8-K - FORM 8-K - American Realty Capital Trust, Inc. | v765737_8k.htm |
| EX-99.1 - EXHIBIT 99.1 - American Realty Capital Trust, Inc. | v765737_ex99-1.htm |

ARCT_Prospectus-PhotoPage AMERICAN REALTY CAPITAL TRUST, INC. QUARTERLY SUPPLEMENTAL INFORMATION Third Quarter 2012 ARCT_Prospectus-PhotoPage

American Realty Capital Trust, Inc. Quarterly Supplemental Information Third Quarter 2012 Table of Contents Introductory Notes 3 Company Information 4 Summary of Financial Highlights 6 Selected Financial Information 7 Consolidated Balance Sheets 8 Consolidated Statements of Operations 9 Funds from Operations and Adjusted Funds from Operations 10 Dividends Summary 12 Financial and Operational Statistics and Ratios 13 Debt Summary 14 Mortgage Notes Payable 15 Summary Debt Covenants 16 Portfolio Profile 17 Lease Expirations 18 Tenant Diversification 19 Tenant Industry Diversification 21 Property Geographic Diversification 22 Property Age 23 Definitions 24

American Realty Capital Trust, Inc. Introductory Notes The data and other information described in this Quarterly Supplement are as of the date this Supplement was filed or an earlier date where indicated. Future performance may not be consistent with past performance, and is subject to change with inherent risks and uncertainties. This Supplement contains certain statements that are the Company’s and Management’s hopes, intentions, beliefs, expectations, or projections of the future and might be considered to be forward looking statements under Federal Securities laws. Prospective investors are cautioned that any such forward-looking statements are not guarantees of future performance, and involve risks and uncertainties and do not reflect the outcome of any legal proceedings to which the Company is a party, and our proposed merger with Realty Income Corporation, as described in the Company’s filings with the Securities and Exchange Commission. The Company’s actual future results may differ significantly from the matters discussed in these forward-looking statements, and we may not release revisions to these forward-looking statements to reflect changes after we have made the statements. Factors and risks that could cause actual results to differ materially from expectations are disclosed from time to time in greater detail in the Company’s filings with the Securities and Exchange Commission (“SEC”), including, but not limited to, the Company’s Annual Report on Form 10-K filed with the SEC as amended, the Company’s quarterly reports on Form 10-Q filed with the SEC, as well as Company press releases. Definitions of specialized terms can be found at the end of this presentation on page 24.
American Realty Capital Trust, Inc. Company Information Company Profile American Realty Capital Trust Inc. ("ARCT" or the "Company") is a real estate investment trust ("REIT") that acquires, owns and operates single tenant freestanding commercial properties. We are a publicly traded net-leased REIT that focuses exclusively on corporate, and principally investment grade, tenants. Our diversified real estate portfolio is comprised of mostly recently constructed, modern facilities, net-leased long-term, with primarily investment grade rated tenants. ARCT's primary goal is to provide durable, reliable income for our stockholders through the delivery of dependable monthly dividends. We listed our common stock on The NASDAQ Global Select Market under the ticker symbol “ARCT” on March 1, 2012. Company Mission Our mission is to preserve and protect investors' capital while providing dependable, monthly income through a professionally managed investment strategy. Our management team adheres to a strict code of industry best practices designed to align the interests of management with those of the stockholders in pursuit of several investment objectives. These objectives include: . Generate predictable, durable income . Preserve capital . Create capital appreciation potential . Provide inflation protection Investment Strategy We place a premium on stability of cash flow for stockholders, and accordingly focus on long term net leases with corporate, and principally investment grade, tenants. Currently, we do not have any significant lease expirations in our properties until 2018. We pursue an investment strategy that maximizes cash flow and achieves sustainable long-term growth, in an effort to enhance total return for our stockholders. In executing this strategy we: . Acquire high-quality single tenant, freestanding properties in strategic locations leased long term to high quality tenants . Manage the operating portfolio, including extending leases with existing tenants and re-leasing properties where a tenant may vacate . Lease any potentially vacant properties to industry-leading investment grade and other creditworthy tenants (currently the portfolio is 100% occupied) . Maximize cash flow through contractual rental growth and value-add expansion and repositioning of properties . Sell properties on a selective, profitable basis, thereby mitigating exposure to certain tenants and markets

American Realty Capital Trust, Inc. Company Information (Continued) Senior Management Board of Directors William M. Kahane, Chief Executive Officer and President Nicholas S. Schorsch, Chairman Brian D. Jones, Executive Vice President, Chief Financial Officer and Treasurer William M. Kahane, Director Susan E. Manning, Chief Accounting Officer, and Secretary Leslie D. Michelson, Lead Independent Director Robert H. Burns, Independent Director William G. Stanley, Independent Director Corporate Offices and Contact Information 405 Park Avenue, 14th Floor New York, NY 10022 646-937-6900 www.arctreit.com Trading Symbol ARCT Stock Exchange Listing NASDAQ Global Select Market Transfer Agent Computershare Trust Company, N.A. 250 Royall Street Canton, MA 02021 800-736-3001

American Realty Capital Trust, Inc. Summary of Financial Highlights Third Quarter 2012 Third Quarter 2012 Operating Highlights (three months ended September 30, 2012 compared to the three months ended September 30, 2011) . Funds from operations: $29.5 million, or $0.19 per share, up from $17.0 million, or $0.10 per share. . Adjusted funds from operations: $30.1 million, or $0.19 per share, up from $22.7 million, or $0.13 per share. . Revenues: $46.1 million, up from $36.2 million. . Net operating income: $43.3 million, up from $34.7 million. . Net loss attributable to stockholders: $64.5 million, or a loss of $0.41 per share, compared to a loss of $5.7 million, or $0.03 per share. Excluding listing, internalization and merger related costs, net income attributable to stockholders was $3.6 million or $0.02 per share. . Total dividends paid to stockholders: $27.9 million, or $0.70 per share on an annualized basis ($0.715 per share on an annualized basis for September), compared to $28.0 million, or $0.70 per share on an annualized basis. Year-to-Date 2012 Operating Highlights (nine months ended September 30, 2012 compared to the nine months ended September 30, 2011) . Funds from operations: $91.2 million, or $0.57 per share, up from $28.5 million, or $0.24 per share. . Adjusted funds from operations: $91.6 million, or $0.57 per share up from $52.0 million or $0.43 per share. . Revenues: $137.3 million, up from $86.0 million. . Net operating income: $129.8 million, up from $83.4 million. . Net loss attributable to stockholders: $54.6 million, or $0.35 per share, based on adjusted first quarter net income, or $88.3 million loss, or $0.54 per share, as reported, compared to a net loss of $19.7 million, or $0.17 per share. Excluding listing, internalization, merger and extinguishment of debt related costs from as reported net loss, net income attributable to stockholders was $4.4 million or $0.03 per share. . Total dividends paid to stockholders: $89.4 million, or $0.70 per share on an annualized basis ($0.715 per share on an annualized basis for September), compared to $55.8 million, or $0.70 per share on an annualized basis. Third Quarter 2012 Property Portfolio Highlights . Closed on $30.3 million of new acquisitions: acquired $30.3 million of properties with an average capitalization rate of 8.38%, consistent with ARCT’s net lease investment strategy. . Acquisitions year-to-date: completed acquisitions/expansions for a total purchase price of $43.2 million year to date with an average capitalization rate of 8.43%. Including joint venture non-controlling interest redemptions, acquisitions totaled $54.7 million. . Portfolio occupancy: 100% physical and economic occupancy (no lease expirations in 2012 or 2013). . Increased dividend: 2.14% dividend increase, effective September 15, 2012, announced on July 31, 2012, bringing the annualized distribution rate from $0.70 per share to $0.715 per share. Third Quarter 2012 Capital Markets Activity . Secured permanent term loan: secured $235 million permanent term loan led by Wells Fargo Securities, LLC on July 2, 2012, replacing $200 million interim term loan funded on April 16, 2012 by Wells Fargo Bank, N.A. . Repurchased joint venture interests: Paid $11.5 million through September 30, 2012 ($29.5 million through October 29, 2012) to non-controlling interest holders in property joint ventures with the Company to repurchase their joint venture interests. . Rating under review for possible upgrade: Moody’s Investor Services (“Moody’s”), a national major credit rating agency, placed ARCT’s Ba2 issuer rating on review for a possible upgrade. This action followed the merger announcement described immediately below.
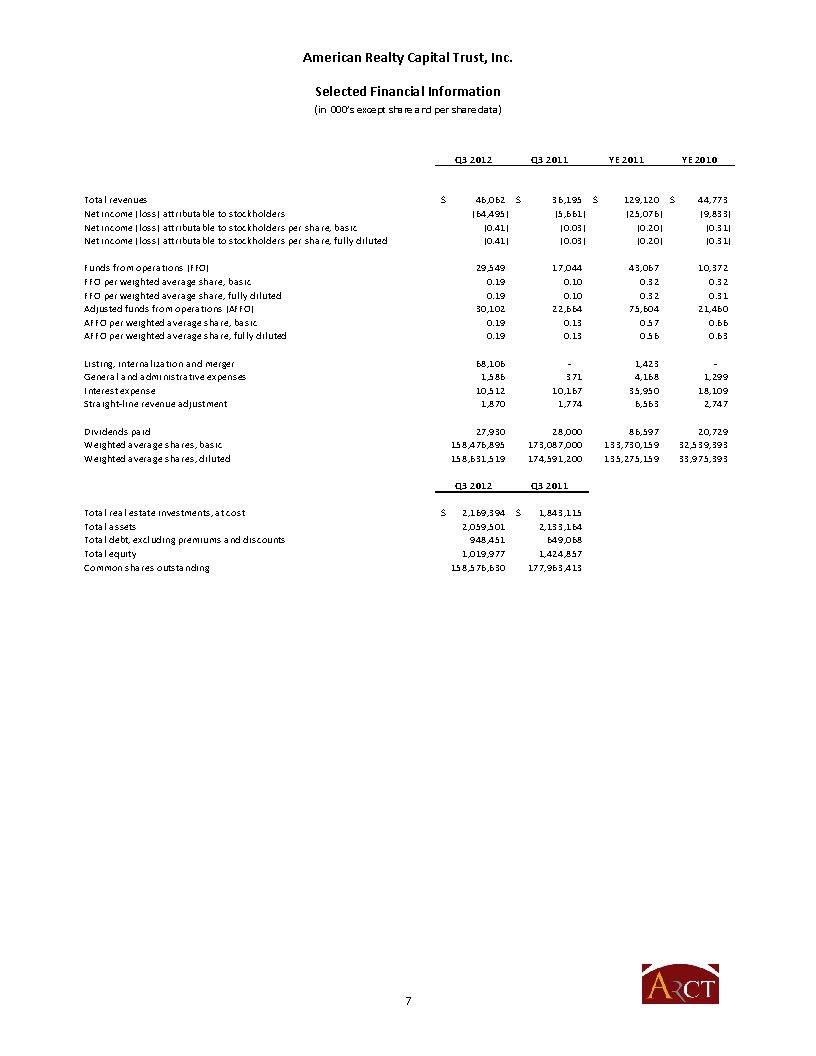
American Realty Capital Trust, Inc. Selected Financial Information (in 000’s except share and per share data) Q3 2012Q3 2011YE 2011YE 2010Total revenues46,062$ 36,195$ 129,120$ 44,773$ Net income (loss) attributable to stockholders(64,495) (5,661) (25,076) (9,833) Net income (loss) attributable to stockholders per share, basic(0.41) (0.03) (0.20) (0.31) Net income (loss) attributable to stockholders per share, fully diluted(0.41) (0.03) (0.20) (0.31) Funds from operations (FFO)29,549 17,044 43,067 10,372 FFO per weighted average share, basic0.19 0.10 0.32 0.32 FFO per weighted average share, fully diluted 0.19 0.10 0.32 0.31 Adjusted funds from operations (AFFO)30,102 22,664 75,604 21,460 AFFO per weighted average share, basic0.19 0.13 0.57 0.66 AFFO per weighted average share, fully diluted0.19 0.13 0.56 0.63 Listing, internalization and merger68,106 - 1,423 - General and administrative expenses1,586 371 4,168 1,299 Interest expense10,512 10,167 35,950 18,109 Straight-line revenue adjustment1,870 1,774 6,563 2,747 Dividends paid27,930 28,000 86,597 20,729 Weighted average shares, basic158,476,895 173,087,000 133,730,159 32,539,393 Weighted average shares, diluted158,631,519 174,591,200 135,275,159 33,975,393 Q3 2012Q3 2011Total real estate investments, at cost2,169,394$ 1,843,115$ Total assets2,059,501 2,133,164 Total debt, excluding premiums and discounts948,451 649,068 Total equity1,019,977 1,424,857 Common shares outstanding158,576,630 177,963,413

American Realty Capital Trust, Inc. Consolidated Balance Sheets (in 000’s) Q3 2012Q2 2012Q1 2012Q4 2011Q3 2011 ASSETS Real estate investments, at cost: Land334,470$ 328,448$ 328,386$ 325,458$ 295,917$ Buildings, fixtures and improvements1,558,105 1,537,166 1,535,192 1,528,962 1,319,801 Acquired intangible lease assets276,819 273,504 273,164 271,751 227,397 Total real estate investments, at cost2,169,394 2,139,118 2,136,742 2,126,171 1,843,115 Less: accumulated depreciation and amortization(179,730) (153,576) (127,571) (101,576) (77,672) Total real estate investments, net1,989,664 1,985,542 2,009,171 2,024,595 1,765,443 Cash and cash equivalents5,819 12,383 8,140 33,329 291,504 Investment securities, at fair value20,247 19,207 18,544 17,275 2,708 Restricted cash2,772 2,731 2,780 2,728 17,191 Investment in unconsolidated joint venture- - 11,014 11,201 11,385 Receivable from affiliate- - - - 6,806 Receivable for sale of common stock- - - - - Prepaid expenses and other assets26,528 23,020 21,464 27,564 24,578 Deferred costs, net14,471 13,183 13,312 13,883 13,549 Total assets2,059,501$ 2,056,066$ 2,084,425$ 2,130,575$ 2,133,164$ LIABILITIES AND EQUITY Revolving credit facility202,307$ 201,138$ -$ 10,000$ -$ Long-term note payable235,000 200,000 - - - Mortgage notes payable511,144 511,543 673,164 673,978 649,068 Mortgage discount and premium, net756 815 643 679 716 Below-market lease liabilities, net7,922 7,998 8,074 8,150 8,226 Derivatives, at fair value135 162 8,125 8,602 9,065 Accounts payable and accrued expenses78,211 11,966 14,160 11,706 26,572 Common stock to be repurchased, inclusive of accrued fees and expenses- - 228,972 - - Deferred rent and other liabilities4,049 6,849 6,485 6,619 4,454 Dividends payable- - - 10,637 10,206 Total liabilities1,039,524 940,471 939,623 730,371 708,307 Preferred stock- - - - - Common stock1,586 1,586 1,794 1,780 1,765 Additional paid-in capital1,338,453 1,338,382 1,338,594 1,548,009 1,535,760 Accumulated other comprehensive income (loss)2,497 1,429 736 (5,053) (5,175) Accumulated deficit(333,601) (241,159) (217,691) (166,265) (129,443) Total stockholders’ equity1,008,935 1,100,238 1,123,433 1,378,471 1,402,907 Non-controlling interests11,042 15,357 21,369 21,733 21,950 Total equity1,019,977 1,115,595 1,144,802 1,400,204 1,424,857 Total liabilities and equity2,059,501$ 2,056,066$ 2,084,425$ 2,130,575$ 2,133,164$

American Realty Capital Trust, Inc. Consolidated Statements of Operations (in 000’s except per share data) Q3 2012 (1)Q2 2012Q1 2012 (2)Q4 2011Q3 2011Revenues: Rental income44,400$ 44,110$ 44,080$ 41,136$ 34,943$ Operating expense reimbursements1,662 1,538 1,534 1,956 1,252 Total revenues46,062 45,648 45,614 43,092 36,195 Operating expenses: Acquisition and transaction related534 58 641 6,628 5,554 Property operating2,797 1,993 2,689 2,631 1,542 Fees to affiliate- - 4,152 3,000 1,022 General and administrative1,586 3,030 1,984 1,588 371 Equity based compensation798 650 507 377 375 Depreciation and amortization26,309 26,154 26,058 23,925 19,828 Listing, internalization and merger68,106 391 17,269 - - Total operating expenses100,130 32,276 53,300 38,149 28,692 Operating income(54,068) 13,372 (7,686) 4,943 7,503 Other income (expenses): Interest expense(10,512) (10,078) (9,857) (10,229) (10,167) Extinguishment of debt- (276) (6,626) (703) - Equity in income of unconsolidated joint venture- 14 22 25 22 Other income (loss), net264 1,452 264 451 379 Unrealized gain (loss) on derivative instruments- (9) (4,046) 427 (3,114) Loss on disposition of property- - - - - Total other expenses, net(10,248) (8,897) (20,243) (10,029) (12,880) Net loss(64,316) 4,475 (27,929) (5,086) (5,377) Net income attributable to non-controlling interests(179) (203) (144) (292) (284) Net loss attributable to stockholders(64,495)$ 4,272$ (28,073)$ (5,378)$ (5,661)$ Net income (loss) per share, basic(0.41)$ 0.03$ (0.16)$ (0.03)$ (0.03)$ Net income (loss) per share, fully diluted(0.41)$ 0.03$ (0.16)$ (0.03)$ (0.03)$ (1) Note: After adjustments related to the Listing, Internalization and transactions related to entering into the Merger Agreement net income attributable to stockholders for the three months ended September 30, 2012 was $3,611, or $0.02 per share. (2) Note: After adjustments related to the Listing and Internalization net income attributable to stockholders for the three months ended March 31, 2012 was $5,601, or $0.03 per share.
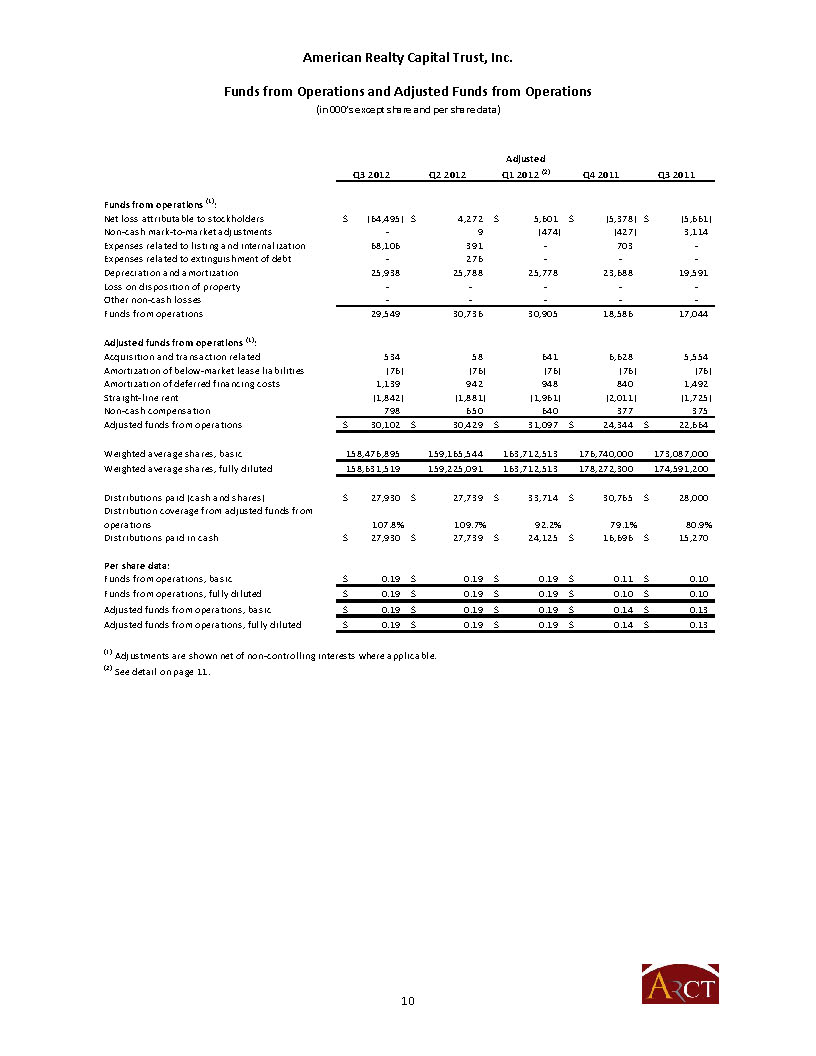
American Realty Capital Trust, Inc. Funds from Operations and Adjusted Funds from Operations (in 000’s except share and per share data) Q3 2012Q2 2012Adjusted Q1 2012 (2)Q4 2011Q3 2011Funds from operations (1): Net loss attributable to stockholders(64,495)$ 4,272$ 5,601$ (5,378)$ (5,661)$ Non-cash mark-to-market adjustments- 9 (474) (427) 3,114 Expenses related to listing and internalization68,106 391 - 703 - Expenses related to extinguishment of debt- 276 - - - Depreciation and amortization25,938 25,788 25,778 23,688 19,591 Loss on disposition of property- - - - - Other non-cash losses- - - - - Funds from operations29,549 30,736 30,905 18,586 17,044 Adjusted funds from operations (1): Acquisition and transaction related534 58 641 6,628 5,554 Amortization of below-market lease liabilities(76) (76) (76) (76) (76) Amortization of deferred financing costs1,139 942 948 840 1,492 Straight-line rent(1,842) (1,881) (1,961) (2,011) (1,725) Non-cash compensation798 650 640 377 375 Adjusted funds from operations30,102$ 30,429$ 31,097$ 24,344$ 22,664$ Weighted average shares, basic158,476,895 159,165,544 163,712,513 176,740,000 173,087,000 Weighted average shares, fully diluted158,631,519 159,225,091 163,712,513 178,272,300 174,591,200 Distributions paid (cash and shares)27,930$ 27,739$ 33,714$ 30,765$ 28,000$ Distribution coverage from adjusted funds from operations107.8%109.7%92.2%79.1%80.9% Distributions paid in cash27,930$ 27,739$ 24,125$ 16,696$ 15,270$ Per share data: Funds from operations, basic0.19$ 0.19$ 0.19$ 0.11$ 0.10$ Funds from operations, fully diluted0.19$ 0.19$ 0.19$ 0.10$ 0.10$ Adjusted funds from operations, basic0.19$ 0.19$ 0.19$ 0.14$ 0.13$ Adjusted funds from operations, fully diluted0.19$ 0.19$ 0.19$ 0.14$ 0.13$ (1) Adjustments are shown net of non-controlling interests where applicable. (2) See detail on page 11.

American Realty Capital Trust, Inc. Adjusted First Quarter Operating Detail (in 000’s except share and per share data) Jan and Feb 2012Mar 2012Q1 2012Adjustments (1) Adjusted Q1 2012Revenues: Rental income29,386$ 14,694$ 44,080$ 44,080$ Operating expense reimbursements1,023 511 1,534 1,534 Total revenues30,409 15,205 45,614 45,614 Operating expenses: Acquisition and transaction related261 380 641 (641) - Property operating1,793 896 2,689 2,689 Fees to affiliate4,152 - 4,152 (4,152) - General and administrative902 1,082 1,984 (599) 1,385 Equity based compensation251 256 507 133 640 Depreciation and amortization17,344 8,714 26,058 26,058 Listing and internalization- 17,269 17,269 (17,269) - Total operating expenses24,703 28,597 53,300 30,772 Operating income5,706 (13,392) (7,686) 14,842 Other income (expense): Interest expense(6,440) (3,417) (9,857) (9,857) Extinguishment of debt- (6,626) (6,626) 6,626 - Equity in income of unconsolidated joint venture14 8 22 22 Other income (loss), net176 88 264 264 Unrealized gain (loss) on derivative instruments- (4,046) (4,046) 4,520 474 Total other expense, net(6,250) (13,993) (20,243) (9,097) Net loss(544) (27,385) (27,929) 5,745 Net income attributable to non-controlling interests(96) (48) (144) (144) Net income (loss) attributable to stockholders(640) (27,433) (28,073) 5,601 Net income (loss) per share (2)0.03$ Funds from operations: Add: Non-cash mark-to-market adjustments- 4,046 4,046 (474) Add: Listing and internalization expenses- 17,269 17,269 - Add: Debt extinguishment expenses- 6,626 6,626 - Add: Depreciation and amortization17,113 8,665 25,778 25,778 Funds from operations16,473 9,173 25,646 30,905 Funds from operations per share (2)0.19$ Adjusted funds from operations: Add: Acquisition expenses641 - 641 641 Less: Amortization of below-market leases(51) (25) (76) (76) Add: Amortization of deferred financing costs558 390 948 948 Less: Straight-line rent(1,316) (645) (1,961) (1,961) Add: Equity based compensation251 256 507 640 Adjusted funds from operations16,556$ 9,149$ 25,705$ 31,097$ Adjusted funds from operations per share (2)0.19$ 1, 2012 including the effect of the issuer Tender Offer. (1) Adjustments made for items related to the Listing and Internalization as well as to normalize periodic expenses. (2) Based on 163,712,513 shares for the adjusted Q1 2012 calculation representing the estimated weighted average shares for the quarter

American Realty Capital Trust, Inc. Dividend Summary (in 000’s except per share data) MonthCash (1)DRIPTotalDividends per share (annualized) Sep-129,442$ -$ 9,442.00$ 0.715$ Aug-129,244 - 9,244 0.70 Jul-129,244 - 9,244 0.70 Jun-129,244 - 9,244 0.70 May-129,244 - 9,244 0.70 Apr-129,244 - 9,244 0.70 3/12/2012 (2)12,661 - 12,661 0.70 Feb-125,731 4,787 10,518 0.70 Jan-125,733 4,802 10,535 0.70 2012 to date79,787 9,589 89,376 Q4 201116,696 14,069 30,765 0.70 Q3 201115,270 12,730 28,000 0.70 Q2 20119,333 7,370 16,703 0.70 Q1 20116,225 4,904 11,129 0.70 Total 201147,524 39,073 86,597 Q4 20104,375 3,601 7,976 0.70 Q3 20103,096 2,584 5,680 0.70 Q2 20102,119 1,726 3,845 0.70 Q1 2010 (3)1,821 1,407 3,228 0.67 Total 201011,411 9,318 20,729 Q4 2009967 694 1,661 0.67 Q3 2009526 358 884 0.67 Q2 2009250 160 410 0.67 Q1 2009145 75 220 0.67 Total 20091,888 1,287 3,175 Q4 2008127 64 191 0.67 Q3 2008111 63 174 0.67 Q2 200857 23 80 0.65 Q1 2008- - - Total 2008295 150 445 (1) Excludes dividends paid on unvested restricted shares. (2) Includes a partial period distribution for the period from Mar 1 to Mar 8 of $2.8 million. (3) Includes a special distribution of $0.05 per share paid January 2010. Dividends Paid (1)

American Realty Capital Trust, Inc. Financial and Operational Statistics and Ratios As of September 30, 2012 and for the Quarter then EndedAs of December 31, 2011 and for the Quarter then EndedDebt to total capitalization33.8%27.8% Net debt to total capitalization33.5%26.4% Net debt to enterprise value33.6%26.8% Annualized EBITDA 161,728$ 117,916$ Net debt to annualized EBITDA5.83 5.52 Annualized EBITDA / annualized interest expense3.85 2.88 Annualized EBITDA / annualized fixed charges3.45 2.64 Total debt / gross assets42.4%30.6% Shares outstanding158,576,630 177,963,413 Stock price at end of period11.74$ 10.00$ Market capitalization (equity capitalization) (in 000's) 1,861,690$ 1,779,634$ Total capitalization (in 000's)2,810,141$ 2,463,612$ Enterprise value (in 000's)2,804,322$ 2,430,283$ High stock close price (1)12.37$ NALow stock close price (1)10.67$ NA(1) Balance sheet amounts and ratios are presented as of the end of the period and the prior year December 31. Earnings ratios are for the full year ended 2011 and are annualized for 2012. (2) High and low stock prices are from the Listing to the end of the period.

American Realty Capital Trust, Inc. Debt Summary (dollars in 000’s) 20122013201420152016ThereafterTotalDebt Maturities: Mortgage notes payable443$ 5,922$ 33,031$ 87,744$ 239,868$ 144,136$ 511,144$ Term loan - - - - - 235,000 235,000 Revolving line of credit (1)- - 202,307 - - - 202,307 Total443$ 5,922$ 235,338$ 87,744$ 239,868$ 379,136$ 948,451$ Percentage of Total DebtWeighted Average Effective Interest RateWeighted Average Maturity (years) Debt Summary: Mortgage notes payable53.9%5.22%4.7 Term loan (1)(2)24.8%2.61%4.8 Weghted average4.40%4.7 Revolving line of credit (2)21.3%2.47%1.9 Cost BasisDebtLTV% Secured Debt Summary: Encumbered assets855,098$ 511,144$ 60% Unencumbered assets1,298,863 - 0% Total2,153,961$ 511,144$ 24% (2) Due August 2014. (3) Represents the rate at September 30, 2012. Loan is at a floating rate.

American Realty Capital Trust, Inc. Mortgage Notes Payable LenderMaturityBalance (000's)Coupon RateEffective RatePayment terms (1) ING Life and annuity03/31/201620,500$ 4.030%4.086%IOGoldman Sachs05/06/201611,500 4.188%4.246%IOLadder Capital Finance, LLC03/06/201619,220 4.258%4.317%IOCitigroup09/06/201519,600 4.300%4.360%IOCitigroup07/09/201614,780 4.305%4.365%IO Ladder Capital Finance, LLC06/06/20165,632 4.368%4.429%IOCitigroup11/12/202024,700 4.450%4.512%IO thru 11/2015, then P IWells Fargo Bank, NA02/01/201624,300 4.490%4.552%IOCitigroup10/06/20153,900 4.500%4.563%IOTD Bank09/16/20134,196 4.580%4.644%P+ILadder Capital Finance, LLC04/06/201628,710 4.592%4.656%IOLadder Capital Finance, LLC05/06/201617,590 4.663%4.728%IOCitigroup11/06/202028,200 4.850%4.917%IO thru 10/2015, then P IWells Fargo Bank, NA04/01/201651,600 4.860%4.928%IOLadder Capital Finance, LLC05/06/201611,350 4.863%4.931%IOLadder Capital Finance, LLC07/06/201510,800 5.250%5.323%IOLadder Capital Finance, LLC12/05/201512,450 5.250%5.323%IOJP Morgan06/01/20219,250 5.260%5.333%IOJohn Hancock07/01/202115,000 5.390%5.465%IO thru 7/2016, then P ILadder Capital Finance, LLC05/11/201515,000 5.490%5.566%IOMidfirst Bank06/01/201814,812 5.500%5.500%P ILadder Capital Finance, LLC09/06/20156,550 5.500%5.576%IOCitigroup03/06/202113,800 5.580%5.658%IOU.S. Bank, NA10/06/201510,331 5.612%5.690%P ILadder Capital Finance, LLC01/06/201622,900 5.780%5.860%IOCitigroup07/06/201512,150 5.950%6.033%IO Wells Fargo Bank, NA09/01/20376,965 6.202%6.288%INorth American Savings08/01/20191,550 6.550%6.641%ILadder Capital Finance, LLC12/11/201432,098 6.552%6.643%P+ILadder Capital Finance, LLC02/11/20155,923 6.625%6.717%P+ICapmark09/07/201712,808 6.875%6.970%IO thru 9/2013, then P INational Integrity Life10/05/201922,979 6.875%6.970%P+I511,144$ 5.160%5.220% (1) IO means interest only is due monthy with the principal due at maturity, P I means both principal and interest are due monthly.
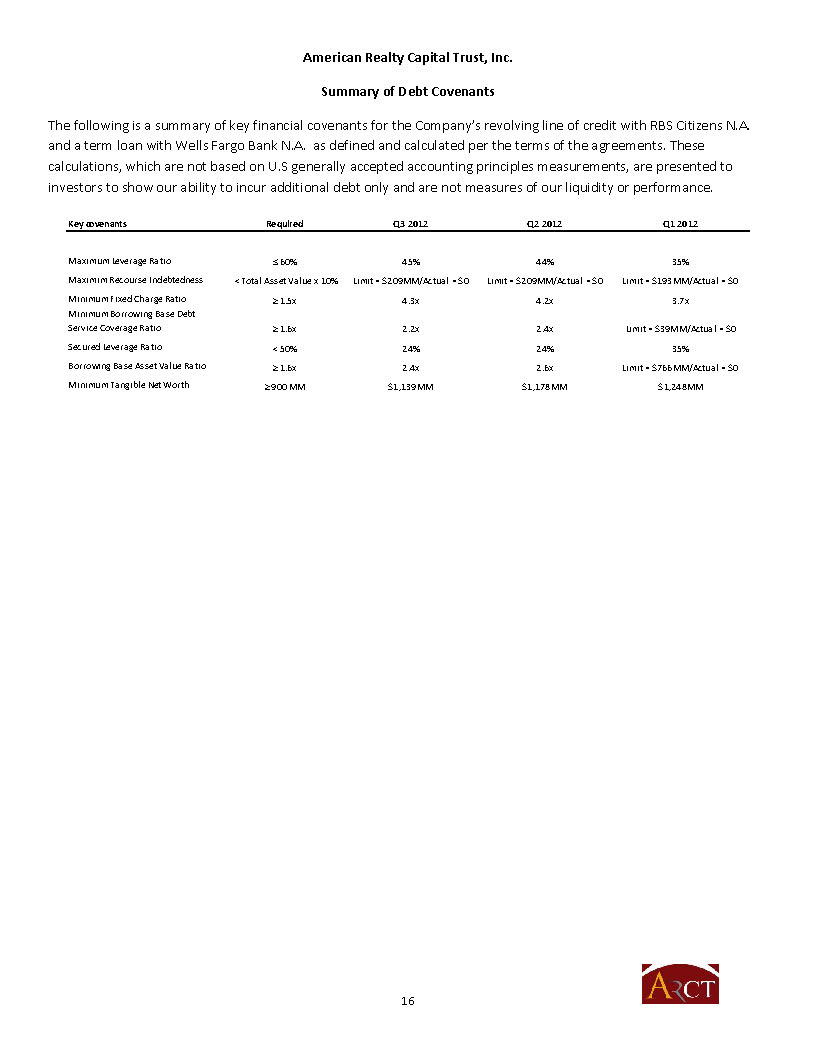
American Realty Capital Trust, Inc. Summary of Debt Covenants The following is a summary of key financial covenants for the Company’s revolving line of credit with RBS Citizens N.A. and a term loan with Wells Fargo Bank N.A. as defined and calculated per the terms of the agreements. These calculations, which are not based on U.S generally accepted accounting principles measurements, are presented to investors to show our ability to incur additional debt only and are not measures of our liquidity or performance. Key covenantsRequiredQ3 2012Q2 2012Q1 2012Maximum Leverage Ratio= 60%45%44%35% Maximim Recourse Indebtedness Total Asset Value x 10%Limit = $209MM/Actual = $0Limit = $209MM/Actual = $0Limit = $193MM/Actual = $0Minimum Fixed Charge Ratio= 1.5x4.3x4.2x3.7xMinimum Borrowing Base Debt Service Coverage Ratio= 1.6x2.2x2.4xLimit = $39MM/Actual = $0Secured Leverage Ratio 50%24%24%35% Borrowing Base Asset Value Ratio= 1.6x2.4x2.6xLimit = $766MM/Actual = $0Minimum Tangible Net Worth= 900 MM$1,139MM$1,178MM$1,248MM

American Realty Capital Trust, Inc. Portfolio Profile September 30, 2012Base purchase price of properties acquired2,153,961$ Number of properties507 Square footage15,754,221 Number of states (including Puerto Rico)44 Number of tenants63 Number of tenant industries20 Average remaining lease term (in years)12.7 Occupancy100.0% Investment grade tenants (based in rental income) (3)74.0% Average capitalization rate (annualized rental income/purchase price) 8.16% Top three tenants percentage of total annualized rent32.9% Top ten tenants percentage of total annualized rent53.1% Acquisitions YTD: Number of properties (1)25Square footage of acquisitons 239,494 Cost of acquisitions (000's)43,223$ Average capitalization rate of acquisitions8.43% Same Store Analysis (2): Same store cash rent Q3 2012 (000's)31,456$ Same store cash rent Q3 2011 (000's)31,165$ Change in cash rent (3)0.9% (1) An addition to the 25 properties acquired, the Company acquired two expansion spaces of properties in its existing portfolio. (2) Note that the Company has had no tenant turnover, lease renegotiations or vacancy since its inception. Average annual rental increases are approximately 1% annually for all leases over the entire lease terms. (3) Leases contain contractual rental increases on varying schedules. Increases in comparative periods may not be indicative of increases to be expected over a period of time.

American Realty Capital Trust, Inc. Lease Expirations Year of ExpirationNumber of Leases ExpiringAverage Annual Rent (in 000's) % of Portfolio Average Annual Rent ExpiringLeased Rentable Square Feet% of Portfolio Rentable Square Feet Expiring2012- -$ 0.0%- 0.0% 2013- - 0.0%- 0.0% 20142 160 0.1%9,841 0.1% 2015- - 0.0%- 0.0% 20163 482 0.2%27,675 0.3% 20171 179 0.1%12,613 0.1% 201869 11,403 6.5%1,006,710 6.4% 201919 8,493 4.8%1,172,653 7.4% 202014 8,845 5.0%1,253,713 8.0% 202126 19,884 11.3%3,048,391 19.3% Total134 49,446$ 28.0%6,531,596 41.6%

American Realty Capital Trust, Inc. Tenant Diversification TenantNumber of PropertiesSquare FeetSquare Feet as a % of Total PortfolioAverage Remaining Lease Term (1)IndustryAverage Annual Rent (in 000's) Average Annual Rent as a % of Total PortfolioFedEx23 2,152,969 13.7%9.5 Freight29,087$ 16.5% Walgreen's42 574,108 3.6%20.1 Pharmacy17,332 9.9% CVS32 420,565 2.7%20.0 Pharmacy11,454 6.5% GSA14 418,926 2.7%10.0 Government Services7,940 4.5% Dollar General71 652,777 4.1%13.4 Discount Retail5,997 3.4% BSFS23 341,500 2.2%11.6 Auto Services5,421 3.1% Express Scripts2 416,141 2.6%6.7 Healthcare4,623 2.6% Payless1 801,651 5.1%13.4 Specialty Retail4,211 2.4% PetSmart1 1,000,375 6.3%9.8 Specialty Retail3,672 2.1% PNC50 272,599 1.7%11.3 Retail Banking3,560 2.0% IHOP22 101,431 0.6%13.5 Restaurant3,541 2.0% Whirlpool2 1,450,350 9.2%8.8 Manufacturing3,342 1.9% Reliant Rehab1 65,141 0.4%18.1 Healthcare3,322 1.9% 3M1 650,760 4.1%8.6 Consumer Products3,294 1.9% Tractor Supply12 232,227 1.5%12.1 Specialty Retail3,221 1.8% First Niagara15 177,774 1.1%10.3 Retail Banking3,161 1.8% Home Depot2 573,565 3.6%16.3 Home Maintenance2,813 1.6% Bojangles17 60,853 0.4%10.6 Restaurant2,791 1.6% Royal Ahold2 116,865 0.7%10.4 Supermarket2,780 1.6% Reckitt Benckiser1 574,106 3.6%9.3 Consumer Products2,668 1.5% Rockland18 121,057 0.8%8.8 Retail Banking2,530 1.4% Texas Instruments1 125,000 0.8%8.2 Technology2,522 1.4% Brown Shoe1 351,723 2.2%18.1 Specialty Retail2,358 1.3% Kum & Go16 75,318 0.5%15.4 Gas/Convenience2,349 1.3% Aaron's18 214,739 1.4%10.1 Specialty Retail2,184 1.2% DaVita Dialysis8 66,851 0.4%8.9 Healthcare1,942 1.1% Citigroup1 64,036 0.4%13.0 Financial Services1,910 1.1% Wal-Mart2 335,367 2.1%6.4 Discount Retail1,898 1.1% Renal Advantage9 74,457 0.5%10.8 Healthcare1,834 1.0% General Electric1 484,348 3.1%6.5 Manufacturing1,806 1.0% Lowe's2 276,590 1.8%11.1 Home Maintenance1,774 1.0% Jack in the Box11 27,228 0.2%17.6 Restaurant1,673 1.0% ConAgra1 65,000 0.4%12.8 Consumer Goods1,648 0.9% Sealy1 257,000 1.6%11.2 Manufacturing1,606 0.9% Rite Aid6 74,919 0.5%10.8 Pharmacy1,447 0.8% Wrangler1 316,800 2.0%8.3 Manufacturing1,417 0.8% Kohl's2 152,658 1.0%15.9 Discount Retail1,208 0.7% (continued)

American Realty Capital Trust, Inc. Tenant Diversification (Continued) TenantNumber of PropertiesSquare FeetSquare Feet as a % of Total PortfolioAverage Remaining Lease Term (1)IndustryAverage Annual Rent (in 000's) Average Annual Rent as a % of Total PortfolioWawa2 12,433 0.1%14.6 Gas/Convenience1,205$ 0.7% Fresenius2 140,000 0.9%9.8 Healthcare1,159 0.7% Pep Boys3 60,140 0.4%10.8 Auto Services1,124 0.6% Ruby Tuesday7 35,788 0.2%6.5 Restaurant1,117 0.6% Lockheed Martin1 125,880 0.8%7.3 Aerospace1,052 0.6% Verizon1 40,000 0.3%9.2 Telecommunications1,042 0.6% Advance Auto9 59,129 0.4%10.5 Auto Retail1,022 0.6% Auto Zone5 35,696 0.2%13.8 Auto Retail960 0.5% Coats Clark1 401,512 2.5%8.3 Manufacturing937 0.5% Jared Jewelry4 25,691 0.2%15.4 Specialty Retail888 0.5% O'Reilly Auto5 41,814 0.3%9.7 Auto Retail883 0.5% Dillons2 120,309 0.8%8.0 Supermarket877 0.5% Sam's Club1 141,583 0.9%12.9 Discount Retail851 0.5% Family Dollar10 86,240 0.5%9.8 Discount Retail795 0.5% Saint Joseph's MM3 46,706 0.3%11.4 Healthcare766 0.4% Trader Joe's1 31,920 0.2%9.3 Supermarket675 0.4% Danfoss1 99,823 0.6%9.1 Manufacturing657 0.4% Chase Bank2 8,030 0.1%24.6 Retail Banking604 0.3% Fifth Third Bank2 8,252 0.1%15.5 Retail Banking520 0.3% National Tire Battery3 33,920 0.2%13.0 Auto Services483 0.3% 7-Eleven2 6,014 0.0%8.2 Gas/Convenience402 0.2% Citizens Bank2 14,307 0.1%6.3 Retail Banking347 0.2% BB T1 3,635 0.0%7.3 Retail Banking298 0.2% QuickTrip1 4,555 0.0%11.4 Gas/Convenience291 0.2% Mrs Baird's2 30,120 0.2%7.0 Consumer Goods265 0.2% Provident Bank1 2,950 0.0%21.4 Retail Banking237 0.1% Total507 15,754,221 100%12.7 175,793$ 100% (1) Remaining lease term in years as of September 30, 2012.

American Realty Capital Trust, Inc. Tenant Industry Diversification IndustryNumber of PropertiesSquare FeetSquare Feet as a % of Total PortfolioAverage Annual Rent (in 000's) Average Annual Rent as a % of Total PortfolioPharmacy80 1,069,592 6.8%30,233$ 17.2% Freight23 2,152,969 13.7%29,087 16.5% Specialty Retail37 2,626,406 16.7%16,534 9.4% Healthcare25 809,296 5.1%13,646 7.8% Retail Banking91 608,604 3.9%11,257 6.4% Discount Retail86 1,368,625 8.7%10,749 6.1% Manufacturing7 3,009,833 19.1%9,765 5.6% Restaurant57 225,300 1.4%9,122 5.2% Government Services14 418,926 2.7%7,940 4.5% Auto Services29 435,560 2.8%7,028 4.0% Consumer Products2 1,224,866 7.8%5,962 3.4% Home Maintenance4 850,155 5.4%4,587 2.6% Supermarket5 269,094 1.7%4,332 2.5% Gas/Convenience21 98,320 0.6%4,247 2.4% Auto Retail19 136,639 0.9%2,865 1.6% Technology1 125,000 0.8%2,522 1.4% Consumer Goods3 95,120 0.6%1,913 1.1% Financial Services1 64,036 0.4%1,910 1.1% Aerospace1 125,880 0.8%1,052 0.6% Telecommunications1 40,000 0.3%1,042 0.6% Total507 15,754,221 100.0%175,793$ 100.0%

American Realty Capital Trust, Inc. Property Geographic Diversification State/PossesionNumber of PropertiesSquare FeetSquare Feet as a % of Total PortfolioAverage Annual Rent (in 000's) Average Annual Rent as a % of Total PortfolioNew York 33 1,046,461 6.6%20,872 11.9% Texas 40 1,032,401 6.6%16,172 9.2% Ohio 26 2,013,638 12.8%12,590 7.2% Illinois 20 1,948,422 12.4%11,583 6.6% Missouri 30 686,508 4.4%9,784 5.6% California 10 727,032 4.6%9,118 5.2% Pennsylvania 42 610,190 3.9%8,899 5.1% Georgia 24 984,356 6.2%7,939 4.5% Florida 22 204,120 1.3%5,347 3.0% Arizona 5 368,773 2.3%5,334 3.0% Kentucky 10 329,254 2.1%5,233 3.0% Michigan 27 449,971 2.9%4,903 2.8% South Carolina 16 171,336 1.1%4,525 2.6% Maryland 2 165,502 1.1%4,137 2.4% Kansas 9 636,671 4.0%4,046 2.3% North Carolina 14 119,216 0.8%3,217 1.8% Louisiana 21 191,274 1.2%2,856 1.6% Utah 2 578,286 3.7%2,855 1.6% New Jersey 33 181,753 1.2%2,757 1.6% Massachusetts 19 127,214 0.8%2,738 1.6% Iowa 7 801,572 5.1%2,709 1.5% Arkansas 6 397,520 2.5%2,629 1.5% Nebraska 4 157,286 1.0%2,528 1.4% Alabama 16 158,371 1.0%2,395 1.4% Tennessee 8 213,262 1.4%2,370 1.3% Wisconsin 2 492,212 3.1%2,030 1.2% West Virginia 5 146,450 0.9%1,913 1.1% Virginia 6 51,513 0.3%1,695 1.0% Minnesota 5 122,898 0.8%1,627 0.9% Oklahoma 7 70,067 0.4%1,434 0.8% Indiana 4 50,908 0.3%1,394 0.8% Mississippi 6 59,559 0.4%1,172 0.7% Colorado 5 96,987 0.6%1,129 0.6% Maine 2 45,145 0.3%1,013 0.6% Puerto Rico 4 28,880 0.2%859 0.5% Washington 2 79,021 0.5%724 0.4% Nevada 2 32,335 0.2%637 0.4% New Hampshire 1 45,968 0.3%596 0.3% Idaho 2 16,788 0.1%448 0.3% Oregon 3 10,678 0.1%388 0.2% Connecticut 1 19,097 0.1%354 0.2% New Mexico 2 12,154 0.1%316 0.2% South Dakota 1 43,762 0.3%296 0.2% North Dakota 1 29,410 0.2%232 0.1% Total507 15,754,221 100.0%175,793 100.0%

American Realty Capital Trust, Inc. Property Age DistributionOfficeRetailTotal(Square feet) Age: 0 - 5 yrs.6,206,450 963,459 2,852,554 10,022,463 6 - 10 yrs.2,469,503 176,079 633,964 3,279,546 11 - 39 yrs.331,920 281,621 1,641,430 2,254,971 Historic (1)- - 197,241 197,241 9,007,873 1,421,159 5,325,189 15,754,221 (1) Historic properties are properties that are 40 years or olderand are comprised of certain retail bank branches where the tenant has maintained certain features of the historic nature of the buildingType of Property

American Realty Capital Trust, Inc. Definitions Average annual rent is rental income under our leases reflecting straight-line rent adjustments associated with contractual rent increases in the leases as required by GAAP, as further adjusted to reflect the effect of (i) tenant concessions and abatements such as free rent, (ii) in respect of our modified gross leased properties, the effect of operating expense reimbursement revenue less property operating expenses, and (iii) with respect to our properties that are subject to ground leases, the effect of ground lease payments. Creditworthy tenants are as determined by us based on our own assessment of the tenant’s financial condition based on out underwriting criteria. Funds from operations and adjusted funds from operations (FFO/AFFO) - the Company considers funds from operations, or FFO, and FFO, as adjusted to exclude acquisition-related fees and expenses, amortization of above-market lease assets and liabilities, amortization of deferred financing costs, straight-line rent, non-cash mark-to-market adjustments, amortization of restricted stock, non-cash compensation and non-recurring gains and losses, or AFFO, useful indicators of the performance of a REIT. Because FFO calculations exclude such factors as depreciation and amortization of real estate assets and gains or losses from sales of operating real estate assets (which can vary among owners of identical assets in similar conditions based on historical cost accounting and useful-life estimates), they facilitate comparisons of operating performance between periods and between other REITs in our peer group. ARCT also adds back to net income, which is used in deriving FFO, certain costs associated with the Listing, Internalization and mortgage prepayments as these expenses and losses do not properly reflect our operation performance. Accounting for real estate assets in accordance with GAAP implicitly assumes that the value of real estate assets diminishes predictably over time. Since real estate values have historically risen or fallen with market conditions, many industry investors and analysts have considered the presentation of operating results for real estate companies that use historical cost accounting to be insufficient by themselves. Additionally, the Company believes that AFFO, by excluding acquisition-related fees and expenses, amortization of above-market lease assets and liabilities, amortization of deferred financing costs, straight-line rent, non-cash mark-to-market adjustments, amortization of restricted stock, non-cash compensation and non-recurring gains and losses, provides information consistent with management's analysis of the operating performance of the properties. By providing AFFO, ARCT believes it is presenting useful information that assists investors and analysts to better assess the sustainability of our operating performance. Further, ARCT believes AFFO is useful in comparing the sustainability of our operating performance with the sustainability of the operating performance of other real estate companies, including exchange-traded and non-traded REITs. As a result, the Company believes that the use of FFO and AFFO, together with the required GAAP presentations, provide a more complete understanding of our performance relative to our peers and a more informed and appropriate basis on which to make decisions involving operating, financing, and investing activities. Internalization - On March 1, 2012, the Company became a self-administered REIT managed full-time by the same management team that built the Company. Investment grade - a determination made by major credit rating agencies. Listing - On March 1, 2012, the Company listed its common stock on The NASDAQ Global Select Market under the symbol “ARCT” Merger Agreement - On September 6, 2012, ARCT and Realty Income Corporation (“Realty Income”) entered into a definitive agreement for Realty Income to acquire all of the outstanding shares of ARCT in a transaction valued at approximately $3.0 billion. Both companies’ board of directors have unanimously approved the agreement. Following a stockholder vote by both companies, the transaction is expected to close during the fourth quarter of 2012 or early in the first quarter of 2013. Under the terms of the agreement, ARCT stockholders will receive a fixed exchange ratio of 0.2874 Realty Income shares for each share of ARCT common stock that they own. Tender Offer - The Company offered to purchase up to $220.0 million in shares of common stock from its stockholders, pursuant to a modified "Dutch Auction" cash Tender Offer. The tender offer was completed on April 4, 2012 when the Company purchased 21.0 million shares at 10.50 per share.