SECURITIES AND EXCHANGE COMMISSION
Washington, D.C. 20549
FORM 8-K
CURRENT REPORT
Pursuant to Section 13 or 15(d) of The
Securities Exchange Act of 1934
Date of Report (Date earliest event reported) October 25, 2012
WILLIAM LYON HOMES
(exact name of registrant as specified in its charter)
DELAWARE
(State or other jurisdiction of incorporation)
| 001-31625 | 33-0864902 | |
| (Commission File Number) | (IRS Employer Identification Number) |
4490 Von Karman Avenue Newport Beach, California
(Address of principal executive offices)
92660
(Zip Code)
Registrant’s Telephone Number, Including Area Code: (949) 833-3600
N/A
(Former name or former address, if changed since last report)
Check the appropriate box below if the Form 8-K filing is intended to simultaneously satisfy the filing obligations of the registrant under any of the following provisions:
| ¨ | Written communications pursuant to Rule 425 under the Securities Act (17 CFR 230.425) |
| ¨ | Soliciting material pursuant to Rule 14a-12 under the Exchange Act (17 CFR 240.14a-12) |
| ¨ | Pre-commencement communications pursuant to Rule 14d-2(b) under the Exchange Act (17 CFR 240.14d-2(b)) |
| ¨ | Pre-commencement communications pursuant to Rule 13e-4(c) under the Exchange Act (17 CFR 240.13e-4(c)) |
| Item 7.01. | Regulation FD Disclosure. |
The information furnished under Item 7.01 in this Current Report on Form 8-K shall not be deemed “filed” for purposes of Section 18 of the Securities Exchange Act of 1934, as amended or otherwise incorporated by reference in any filing pursuant to the Securities Act of 1933, as amended, or the Securities Exchange Act of 1934, as amended, except as otherwise expressly stated in such filing. Unless the context otherwise requires, references in this current report on Form 8-K to the “Company,” “we,” “us,” or “our,” or similar terms, refer to William Lyon Homes, a Delaware corporation, and its subsidiaries, “Parent” refers to William Lyon Homes and “California Lyon” refers to William Lyon Homes, Inc., a California corporation.
Our Company
William Lyon Homes is one of the largest private homebuilders in the United States, with operations in select California, Arizona and Nevada metropolitan areas. Headquartered in Newport Beach, California, we are primarily engaged in the design, construction, marketing and sale of single-family detached and attached homes in and around Los Angeles, San Diego, Orange County, the San Francisco Bay Area, Phoenix and Las Vegas. Our core markets rank within the top 35 residential housing markets in the U.S., based on 2011 single-family housing permits as measured by the U.S. Census Bureau. Our core markets are expected to experience population and economic growth which we expect will provide strong and sustainable demand for new housing. We hold top market share positions in most of our markets and for the nine months ended September 30, 2012 we were the fifth largest homebuilder in Southern California based upon home closings as reported by Hanley Wood. Our homes are designed to meet the needs of a broad array of customers, resulting in home sales across a diverse range of product lines and price points, with an emphasis on sales to entry-level and first-time move-up homebuyers. We are committed to achieving the highest standards in design, quality and customer satisfaction and have received numerous industry awards and commendations recognizing our achievements. We believe that the attractive fundamentals in our markets, our leading market share positions and our focus on providing the best customer experience will provide us with significant growth and cash flow opportunities as the U.S. housing market continues to rebound.
Our company has a distinguished legacy of more than 55 years of homebuilding operations. Since our founding under the name The Presley Companies in 1956, we have sold in excess of 74,000 homes. For the twelve months ended September 30, 2012, we delivered 811 homes, with an average selling price of approximately $273,000. Our home sales revenues and total revenues for the twelve months ended September 30, 2012 were $222 million and $353 million, respectively. We are currently selling homes in 19 communities, and as of September 30, 2012, we had a consolidated backlog of 414 sold but unclosed homes and an owned inventory book value of $369 million.
We have experienced significant operating momentum within each of our four operating segments in the 2012 year-to-date period, during which time a variety of key housing, employment and other related economic statistics in our markets have increasingly demonstrated signs of recovery. This rebound in market conditions, when combined with our disciplined operating strategy, has resulted in three consecutive quarters of growth in our net new home orders, home closings and unit backlog. For the nine months ended September 30, 2012, our net new home orders per average sales location increased an average of 60% as compared to the same nine month period in 2011, while our home closings were up 46% over the same year over year period. At September 30, 2012, our unit backlog was up 115% as compared to September 30, 2011. In addition, our adjusted homebuilding gross margin increased to 23.6% for the period from February 25, 2012 to September 30, 2012 as compared to 20.2% for the nine month period ended September 30, 2011.
2
Our Competitive Strengths
Rationalized capital structure and significant recent equity investments
We believe we are well-positioned with a strong balance sheet and sufficient liquidity with which to execute our business plan. Through our recent Chapter 11 bankruptcy process, we were able to rationalize our balance sheet, allowing us to reduce our annual interest expense and to lower our debt burden, better aligning it to the current scale of our operations. In connection with fresh start accounting in accordance with U.S. GAAP, our inventory holdings were readjusted to fair market value. As of September 30, 2012, on an adjusted basis after giving effect to the Refinancing Transactions (as defined below), we had a ratio of owned inventory and cash to total debt of 1.5x.
Through the restructuring process we raised $85 million of new equity, including $25 million ($21 million in cash and a real estate option of $4 million) from the Lyon family and $60 million in cash from new preferred and common shareholders. In addition, since June 2012 we have raised an additional $30 million of new cash equity and funded $10.5 million of land acquisitions through the issuance of 25.2 million common shares and 12.2 million preferred shares. The most recent equity investment in our company, by affiliates of Paulson & Co.’s Real Estate Private Equity fund in October 2012, implied an equity market valuation of approximately $212 million. Separately, pursuant to our certificate of incorporation and subject to certain exceptions, we have agreed to use best efforts to complete a qualified underwritten public offering of our common stock (an “IPO”) by February 2015, which date may be extended for up to two additional twelve month periods with the consent of the holders of a majority of our Class A Common Stock.
Our principal equity holders, including affiliates of Luxor Capital, Paulson & Co. and Colony Capital, have made meaningful capital contributions to help us execute our growth plan and achieve our long-term business objectives. Each of our sponsors possesses a multi-faceted understanding of the residential real estate sector and provides us with valuable perspectives on our current operations. Our equity holders’ investments have helped facilitate the continued de-leveraging and growth of our business and we expect our liquidity and financial position, to allow us to take advantage of growth opportunities as the U.S. housing industry recovers.
High-quality land recorded at fair value
We benefit from sizeable and well-located land holdings. As of September 30, 2012, we owned 10,534 lots and had options to purchase an additional 867 lots, all of which are entitled. Our significant land holdings allow us to be selective in identifying land acquisition opportunities as we have an ample supply of current owned lot inventory. Our owned lot inventory allows us to generate cash flows as our current positions are developed and monetized. In addition, some of our holdings represent multi-phase, master-planned communities, which provide us the unique opportunity to add value to our undeveloped land through re-entitlements, repositioning, and / or opportunistic bulk land sales to third party builders. We believe that our current inventory of owned and controlled lots is sufficient to supply our homebuilding operations at current and expected operating levels (including future land sales) for approximately four to five years.
In addition, unlike many of our public homebuilding competitors, our book value of inventory has been adjusted to fair market value in accordance with fresh start accounting requirements. To facilitate the adoption of fresh start accounting, we engaged a third-party valuation firm to assist us with assessing our enterprise value and the allocation of value to our assets and liabilities. At September 30, 2012, our owned homebuilding inventory book basis of $369 million reflected a 40% discount to such inventory’s original cost basis and includes the impact of $129 million of inventory impairments and fresh start accounting adjustments recognized during the restructuring process. The current carrying value of our inventory is further supported by the recent expansion of our gross profit margins and the fact that we have not recorded any inventory impairments since our emergence from bankruptcy in February 2012. We expect that the location and attractive book basis of our inventory position us to benefit from an improving U.S. housing market and will continue to contribute to favorable gross margins and profitability.
3
Disciplined operating platform to promote profitability and cash flow
We combine a decentralized management approach to those aspects of our business where detailed knowledge of local market conditions is paramount with centralized management in select areas where we believe central control is required, especially in land investment. Our local and regional management teams are responsible for construction, land development, sales and marketing and governmental processing, while our corporate staff provide back-office support for financial, treasury, human resources and legal matters. We believe that we have built a scalable foundation which will support and foster revenue growth without a corresponding increase in SG&A expense.
To manage the risks associated with land ownership, we utilize a five member Corporate Land Committee to analyze potential land acquisitions. Moreover, we are increasingly focused on land as a component of a home’s cost structure, rather than on the land’s speculative value, and typically seek projects with shorter life-cycles. We also review the status of entitlements and other governmental processing to mitigate zoning and other development risk. In addition, all purchases of land $3 million or higher and all purchases of unentitled land requires board of director approval. As of September 30, 2012, all of our land in inventory is entitled. Prior to committing to the acquisition of land, we conduct feasibility studies covering pertinent aspects of the proposed commitment. These studies may include a variety of elements from technical aspects such as title, zoning, soil and seismic characteristics, to marketing studies that review population and employment trends, schools, transportation access, buyer profiles, sales forecasts, projected profitability, cash requirements, assessment of political risk and other factors.
Leading local presence in high-growth markets
We hold top market share positions in many of our markets, including a #2 ranking in Orange County and #3 in Los Angeles County based upon net sales for the six month period ended June 30, 2012, as reported by MarketPoint Realty Advisors, #5 in Southern California and #11 in Las Vegas based upon home closings for the nine month period ended September 30, 2012, as reported by Hanley Wood, and #9 in Phoenix based upon builder permits for the twelve month period ended September 30, 2012, as reported by RL Brown Housing Reports. We have significant operating experience in our homebuilding markets, which has allowed us to cultivate long-standing relationships with land owners, local officials, subcontractors and suppliers. Our relationships often provide us with access to new land opportunities in desirable submarkets, high-quality labor and materials. We believe that our strong sales positions, intimate knowledge of local market conditions and decades of operating experience has enabled us to perform favorably compared to the local divisions of national homebuilders and we believe that we are well positioned to continue to do so as the U.S. housing market recovers.
Our active selling communities are located within six of the top 35 residential housing markets in the country and we believe that our markets are located in a dynamic region of the U.S., based on recent and long-term housing and economic indicators. In August 2012, the West experienced a 39.3% year-over-year increase in single-family housing permits as compared to the national growth rate of 19.3%, as reported by the U.S. Census Bureau and the U.S. Department of Housing and Urban Development. Growth in the counties in which we operate has been strong as well, with reported year-over-year single-family housing permit growth in August 2012 of 73.8%, 35.2% and 25.7% in Clark County, San Diego County and Maricopa County, respectively. The growth in net new home orders, home closings and home sales revenue that we have experienced during this period has been consistent with or superior to these growth rates. We believe that our markets exhibit favorable demographic and employment trends that will result in long-term, organic growth opportunities for our Company.
4
Strategically diversified across customers, product offerings and geographies
We believe that our diversified product strategy enables us to serve multiple customer segments and to adapt quickly to a variety of market conditions and consumer preferences. We offer a broad portfolio of products, including single-family detached and attached homes designed for and marketed to targeted customer segments. Our products are differentiated by size, design, features and amenities in order to serve the specific needs of each of our markets, with an emphasis on sales to entry-level and first-time move-up buyers. As evidence of this differentiation, as of September 30, 2012, we offered homes for sale in a price range of $138,000 to $690,000. Despite the diversity of our product offerings, we generally standardize and limit the number of home designs within any given product line. This standardization permits on-site mass production techniques and bulk purchasing of materials and components, thus enabling us to better control and sometimes reduce construction costs and home construction cycles. We also carefully vary the interior decoration among our model homes to appeal to the lifestyles of various targeted buyer segments.
Our multiple core markets and multiple selling communities within those markets allow us to mitigate the impact of economic fluctuations relative to a specific market or submarket. We also believe that our customer and geographic diversification strategies grant us the flexibility to respond effectively to changes in consumer preferences and evolving community demographics, thereby maximizing our long-term profitability.
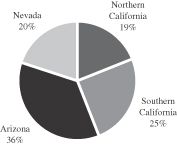
| Home closings by geography (12 months ended September 30, 2012) |
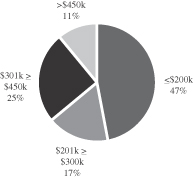
Home closings by buyer profile (12 months ended September 30, 2012) | |
| (Units)
|
(Units)
| |
Deep and experienced management team with significant tenure at our company
We benefit from a strong and experienced management team, with our executive officers and division presidents averaging approximately 21 years of experience in the homebuilding and development industries within California or the Southwestern United States. General William Lyon, our Chairman and Chief Executive Officer, entered the homebuilding business in 1954 and has 58 years of operating experience. Our current executive team, including our Chief Operating Officer, William H. Lyon, our Executive Vice President, Matt Zaist, and our Chief Financial Officer, Colin Severn, have closely managed the operational and financial aspects of our business and bring significant experience, operational and market knowledge and professional relationships within the industry. Our Regional and Division Presidents have substantial industry knowledge and local market expertise, with an average of approximately 15 years of experience at the Company and 24 years in the homebuilding industry. We believe this level of experience and long-standing relationships enable us to quickly identify, evaluate and capitalize on market opportunities, attract and retain new customers and adjust to changing national, regional and local business conditions.
We supplement our management team with a strong and diverse board of directors. We believe that our board of directors provides us with an additional point of reference on all strategic operating and corporate decisions and we have expanded the board in the year to date period to include additional independent members to ensure oversight of the decision making process.
5
Our Business Strategy
Focus on growing free cash flow and optimizing our balance sheet
During the housing industry downturn, we took steps to maximize free cash flow, including limiting land acquisitions and land development expenditures, reducing our speculative home starts and eliminating corporate overhead relative to our sales volume. We reduced our owned and controlled lot count by 45% between December 31, 2006 and September 30, 2012, and reduced our completed and unsold home count by 91% during this same time period from 136 homes to 12 homes. To realign our cost structure, we reduced full-time employee headcount from 730 as of December 31, 2006 to 177 as of September 30, 2012, which represents a 76% reduction. Furthermore, we reduced our sales and marketing and general and administrative expense from $134 million for the year ended December 31, 2006 to $42 million for the 12 months ended September 30, 2012, a 73% reduction. For the period February 25, 2012 to September 30, 2012, after adjusting for amortization of intangibles relating to fresh start adjustments, our selling, general, and administrative (“SG&A”) expense as a percentage of total home sales revenue was 17.2%, an improvement of approximately 365 basis points over the nine month period ended September 30, 2011. We believe that we have built a scalable foundation which will support and foster revenue growth without requiring meaningful incremental SG&A expense.
In addition, we have and will continue to seek to optimize our balance sheet by further enhancing our liquidity and cash position and improving our credit metrics. Although we are comfortable with our current leverage, we are focused on reducing our debt levels and lowering our overall cost of capital as part of our long-term capitalization strategy.
Disciplined approach to inventory management
We intend to capitalize on our existing land supply, which we believe is largely sufficient to support our homebuilding operations for the next four to five years and limits our need to acquire incremental land in order to execute our current business plan. We also maintain a supply of lots that we intend to strategically sell to other homebuilders to capitalize on strong demand for finished lot inventory. During the twelve months ended September 30, 2012, we generated $100 million in revenue from land sales, which included $90 million from the sale of a 27-acre parcel in Palo Alto and Mountain View, California, known as the former Mayfield Mall. We have undertaken a strategy to invest primarily in the most dynamic submarkets close to employment centers and major transportation corridors in high barrier to entry metropolitan areas. Our current policy is to buy only entitled land, but we command the necessary expertise to work a land parcel through the entire development cycle including the entitlement process, which we believe represents incremental margin opportunities. To reduce the risks associated with land investment, we utilize deal structures including long-term purchase options and land banking arrangements, rolling lot takedowns, purchase contracts that provide for payment to land sellers upon closing of homes built on land purchased from them and non-recourse or seller financing when possible.
We seek to minimize the number of completed and unsold homes and balance our construction projects based on real-time information that we receive from our communities concerning the pace of homes that are pre-sold. As of September 30, 2012, we had only 12 completed and unsold homes in inventory. Going forward, we will continue to utilize our entitlement, development and master-planned-community expertise and capitalize on our strong relationships with land sellers and master-planned-community developers to bolster our land position as attractive opportunities arise.
Preserve and build on leading positions in existing and future markets
We believe that our existing markets exhibit positive demographic trends and offer attractive long-term growth prospects. Building homes in attractive locations in these established markets allows us to continually improve our market share and enhance profitability. We believe that maintaining a significant market share in
6
our markets enables us to achieve economies of scale as well as differentiate ourselves from most of our competitors. It also allows us to leverage our reputation, long-standing local relationships and strong track-record to source attractive acquisition opportunities. We will pursue growth within our current markets, and potentially in additional markets in the Western U.S., to the extent that we believe such growth is consistent with our disciplined operating strategy, balanced land policies and overall commitment to superior product quality. In the future we may grow our business through selective opportunistic acquisitions, joint ventures and other strategic transactions with other homebuilders.
Continue to deliver superior quality and customer service
We believe that we compete effectively in our markets due to our long-standing reputation as a producer of high-quality homes and our industry-leading, award-winning customer support services. Our divisions have received numerous industry awards and commendations, including several prestigious 2011 Eliant Homebuyers’ Choice Awards in categories such as “Overall Purchase Experience,” “Best Construction Experience,” “Highest Percent of Sales from Referrals” and “Overall Home Purchase & Ownership Experience.” We will continue to focus on building and selling homes that combine high-quality craftsmanship with locally-influenced design characteristics that ultimately reflect the various lifestyles and aspirations of our multiple customer segments. We will also strive to continue to provide the highest level of customer service during the sales process and after a home is sold. We typically engage our sales personnel on a long-term, rather than a project-by-project basis, which we believe results in a more motivated sales force with an extensive knowledge of the Company’s operating policies and products. We also have a variety of programs and services in place to ensure customer satisfaction and help us improve production efficiency, reduce warranty costs and increase customer referrals. We believe that delivering high-quality homes and providing around-the-clock customer service makes the experience of buying a William Lyon home unique and differentiated and also facilitates feedback from our buyers that we can utilize to improve our operations.
7
We may incur a variety of costs to engage in future growth or expansion of our operations or acquisitions or disposals of businesses, and the anticipated benefits may never be realized.
As a part of our business strategy, we may make acquisitions of, or significant investments in, businesses. Any future acquisitions, investments and/or disposals would be accompanied by risks such as:
| • | difficulties in assimilating the operations and personnel of acquired companies or businesses; |
| • | diversion of our management’s attention from ongoing business concerns; |
| • | our potential inability to maximize our financial and strategic position through the successful incorporation or disposition of operations; |
| • | maintenance of uniform standards, controls, procedures and policies; and |
| • | impairment of existing relationships with employees, contractors, suppliers and customers as a result of the integration of new management personnel and cost-saving initiatives. |
We cannot guarantee that we will be able to successfully integrate any company or business that we might acquire in the future, and out failure to do so could harm our current business. In addition, we may not realize the anticipated benefits of these transactions and there may be other unanticipated or unintended effects. While we would seek protection, for example, through warranties and indemnities in the case of acquisitions, significant liabilities may not be identified in due diligence or come to light after the expiry of warranty or indemnity periods. Additionally, while we would seek to limit our ongoing exposure, for example, through liability caps and period limits on warranties and indemnities in the case of disposals, some warranties and indemnities may give rise to unexpected and significant liabilities. Any claims arising in the future may adversely affect our business, financial condition and operating results.
8
| Nine Months Ended September 30, 2012 |
||||||||||||||||||||||||||||||||||
| Successor(1) | Predecessor(1) | Predecessor(1) | ||||||||||||||||||||||||||||||||
| Period From February 25 through September 30, |
Period from January 1, 2012 through February 24, |
Nine Months Ended September 30, |
Year Ended December 31, | |||||||||||||||||||||||||||||||
| 2012 | 2012 | 2011 | 2011 | 2010 | 2009 | 2008 | 2007 | |||||||||||||||||||||||||||
| (unaudited) | (unaudited) | |||||||||||||||||||||||||||||||||
| Adjusted EBITDA(1) |
$ | 15,592 | $ | (8,435 | ) | $ | (9,580 | ) | $ | (24,201 | ) | $ | 13,279 | $ | (95,666 | ) | $ | 3,191 | $ | (26,233 | ) | |||||||||||||
| (1) | Adjusted EBITDA means net loss plus (i) provision for (benefit from) income taxes, (ii) interest expense, (iii) amortization of capitalized interest included in cost of sales, (iv) non-cash impairment charges, (v) gain on retirement of debt, (vi) loss on sale of fixed asset (vii) depreciation and amortization, (viii) cash distributions of income from unconsolidated joint ventures less equity in income of unconsolidated joint ventures, and (ix) equity in (income) loss of unconsolidated joint ventures. Adjusted EBITDA should not be considered as an alternative for net income (loss), cash flows from operating activities and other consolidated income or cash flow statement data prepared in accordance with accounting principles generally accepted in the United States or as a measure of profitability or liquidity. A reconciliation of net (loss) income to adjusted EBITDA is provided as follows: |
| Nine Months Ended September 30, 2012 |
||||||||||||||||||||||||||||||||||
| Successor | Predecessor | Predecessor | ||||||||||||||||||||||||||||||||
| Period From February 25 through September 30, |
Period from January 1, 2012 through February 24, |
Nine Months Ended September 30, |
Year Ended December 31, | |||||||||||||||||||||||||||||||
| (dollars in thousands) |
2012 | 2012 | 2011 | 2011 | 2010 | 2009 | 2008 | 2007 | ||||||||||||||||||||||||||
| Net (loss) income attributable to William Lyon Homes |
(7,611) | 228,383 | (62,030) | (193,330) | (136,786) | (20,525) | (111,638) | (349,408) | ||||||||||||||||||||||||||
| Provision for (benefit from) income taxes |
11 | — | 10 | 10 | (412) | (101,908) | (41,592) | 32,658 | ||||||||||||||||||||||||||
| Interest expense: |
||||||||||||||||||||||||||||||||||
| Interest incurred |
22,335 | 7,145 | 45,763 | 61,464 | 62,791 | 48,782 | 66,748 | 76,497 | ||||||||||||||||||||||||||
| Interest capitalized |
(15,008) | (4,638) | (27,782) | (36,935) | (39,138) | (12,880) | (42,308) | (76,497) | ||||||||||||||||||||||||||
| Amortization of capitalized interest in cost of sales |
11,200 | 1,360 | 11,517 | 18,082 | 16,762 | 17,978 | 37,907 | 57,241 | ||||||||||||||||||||||||||
| Non-cash impairment charge |
— | — | 24,896 | 128,314 | 111,860 | 45,269 | 141,207 | 231,120 | ||||||||||||||||||||||||||
| Gain on retirement of debt |
(975) | — | — | — | (5,572) | (78,144) | (54,044) | — | ||||||||||||||||||||||||||
| Loss on sale of fixed asset |
— | — | — | 83 | 122 | 3,009 | — | — | ||||||||||||||||||||||||||
| Depreciation and amortization |
5,640 | 586 | 216 | 281 | 385 | 1,493 | 2,218 | 2,460 | ||||||||||||||||||||||||||
| Cash distributions of income from |
— | — | 1,435 | 1,435 | 4,183 | 840 | 816 | — | ||||||||||||||||||||||||||
| Equity in (income) loss of |
— | — | (3,605) | (3,605) | (916) | 420 | 3,877 | (304) | ||||||||||||||||||||||||||
|
|
|
|
|
|
|
|
|
|
|
|
|
|
|
|
|
|||||||||||||||||||
| Adjusted EBITDA |
15,592 | (8,435) | (9,580) | (24,201) | 13,279 | (95,666) | 3,191 | (26,233) | ||||||||||||||||||||||||||
9
The combined nine months ended September 30, 2012 period consisted of three consecutive quarters of improvement in net new home orders over the 2011 period. Total third quarter net new home orders increased 66% from 168 in the third quarter of 2011 to 279 in the third quarter of 2012. Total second quarter net new home orders increased 50% from 201 in the second quarter of 2011 to 302 in the second quarter of 2012. Total first quarter net new home orders increased 89% from 170 in the first quarter of 2011 to 321 in the first quarter of 2012. The increase in net new home orders is due to an improvement in the housing market and overall homebuyer demand. In addition, we have opened new communities in well located areas with strong homebuyer demand. The increase in net new home orders positively impacts the number of homes in backlog, which are homes that will close in future periods.
On a consolidated basis, the backlog of homes sold but not closed as of September 30, 2012 was 414 homes, up 115% from 193 homes as of September 30, 2011. The third quarter ended September 30, 2012 was the third consecutive quarter of year over year increases in backlog homes sold but not closed. As of June 30, 2012, the backlog of homes sold but not closed was 403 homes, up 133% from 173 homes as of June 30, 2011. As of March 31, 2012, the backlog of homes sold but not closed was 332 homes, up 132% from 143 homes as of March 31, 2011. Homes in backlog are generally closed within three to six months. The dollar amount of backlog of homes sold but not closed on a consolidated basis as of September 30, 2012 was $108.4 million, up 99% from $54.3 million as of September 30, 2011.
During the combined nine months ended September 30, 2012, the number of homes closed increased 46% to 627 in the 2012 period from 430 in the 2011 period. The combined nine months ended September 30, 2012 period consisted of three consecutive quarters of improvement in the number of homes closed over the 2011 period. Total third quarter number of homes closed increased 81% from 148 in the third quarter of 2011 to 268 in the third quarter of 2012. Total second quarter number of homes closed increased 35% from 171 in the second quarter of 2011 to 231 in the second quarter of 2012. Total first quarter number of homes closed increased 15% from 111 in the first quarter of 2011 to 128 in the first quarter of 2012.
We had total consolidated operating revenues of $353.3 million and $251.2 million for the twelve months ended September, 2012 and 2011, respectively, and $226.8 million, $294.7 million and $309.2 million for the years ended December 31, 2011, 2010 and 2009, respectively. Homes closed by us, including our joint ventures, were 811 and 633 for the twelve months ended September 30, 2012 and 2011, respectively, and 614, 760 and 915 for the years ended December 31, 2011, 2010 and 2009, respectively. On a consolidated basis, our dollar amount of backlog of homes sold but not closed as of September 30, 2012 was $108.4 million, a 270% increase compared to $29.3 million as of December 31, 2011, which was a 3% decrease from the $30.1 million as of December 31, 2010. We expect our entire backlog at September 30, 2012 to be converted to deliveries and revenues during 2012, net of cancellations. The cancellation rate of buyers who contracted to buy a home but did not close escrow was approximately 14% during the twelve months ended September 30, 2012 and 18% during 2011.
During the twelve months ended September 30, 2012, sales absorption rates, new home orders per average sales location and cancellation rates improved significantly in our markets.
| • | In Southern California, net new home orders per average sales location decreased 3% to 35.11 during the twelve months ended September 30, 2012 from 36.15 for the twelve months ended September 30, 2011. The cancellation rate in Southern California decreased to 19% during the twelve months ended September 30, 2012 from 24% during the twelve months ended September 30, 2011. |
| • | In Northern California, net new home orders per average sales location increased 61% to 48.25 during the twelve months ended September 30, 2012 from 29.89 for the twelve months ended September 30, 2011. In Northern California, the cancellation rate decreased to 21% during the twelve months ended September 30, 2012 from 22% during the twelve months ended September 30, 2011. |
| • | In Arizona, net new home orders per average sales location increased to 152.80 during the twelve months ended September 30, 2012 from 78.50 for the twelve months ended September 30, 2011. In Arizona, the cancellation rate increased to 8% during the twelve months ended September 30, 2012 compared to 7% during the twelve months ended September 30, 2011. |
| • | In Nevada, net new home orders per average sales location increased to 36.67 during the twelve months ended September 30, 2012 from 22.00 during the twelve months ended September 30, 2011. In Nevada, the cancellation rate decreased to 14% during the twelve months ended September 30, 2012 from 16% during the twelve months ended September 30, 2011. |
10
The following table sets forth sales from real estate operations attributable to each of our homebuilding segments for the twelve months ending September, 2012 and September, 2011 and during the preceding three fiscal years:
| Nine Months Ended September 30, 2012 |
||||||||||||||||||||||||||||
| Successor | Predecessor | Combined | Predecessor | |||||||||||||||||||||||||
| Period From February 25, through September 30, |
Period From January 1, through February 24, |
Twelve Months Ended September 30, |
Twelve Months Ended September 30, |
Year
Ended December 31, |
||||||||||||||||||||||||
| (in thousands) |
2012 | 2012 | 2012 | 2011 | 2011 | 2010 | 2009 | |||||||||||||||||||||
| Consolidated |
||||||||||||||||||||||||||||
| Southern California(1) |
$ | 68,187 | $ | 7,759 | $ | 112,900 | $ | 161,199 | $ | 130,737 | $ | 206,241 | $ | 179,282 | ||||||||||||||
| Northern California(2) |
131,747 | 11,014 | 157,489 | 56,935 | 54,140 | 56,095 | 43,211 | |||||||||||||||||||||
| Arizona(3) |
38,634 | 4,316 | 51,718 | 14,214 | 20,075 | 16,595 | 51,215 | |||||||||||||||||||||
| Nevada(4) |
24,007 | 2,481 | 31,210 | 18,893 | 21,871 | 15,767 | 35,535 | |||||||||||||||||||||
|
|
|
|
|
|
|
|
|
|
|
|
|
|
|
|||||||||||||||
| $ | 262,575 | $ | 25,570 | $ | 353,317 | $ | 251,241 | $ | 226,823 | $ | 294,698 | $ | 309,243 | |||||||||||||||
|
|
|
|
|
|
|
|
|
|
|
|
|
|
|
|||||||||||||||
| (1) | The Southern California Segment consists of operations in Orange, Los Angeles, San Bernardino and San Diego counties. |
| (2) | The Northern California Segment consists of operations in Contra Costa, Placer, Sacramento, San Joaquin, Santa Clara and Solano counties. |
| (3) | The Arizona Segment consists of operations in the Phoenix metropolitan area. |
| (4) | The Nevada Segment consists of operations in the Las Vegas metropolitan area. |
The below table is a summary of our existing land portfolio by homebuilding segment and development status at September 30, 2012. Since December 31, 2006 we have reduced our total owned and controlled lots by 45%.
| Owned Lots |
Controlled Lots |
Total Lots |
Owned Inventory Book Value ($ in millions) |
|||||||||||||
| Active developments |
||||||||||||||||
| Southern California |
1,027 | 193 | 1,220 | $ | 140 | |||||||||||
| Northern California |
320 | 674 | 994 | 22 | ||||||||||||
| Arizona |
4,344 | — | 4,344 | 140 | ||||||||||||
| Nevada |
797 | — | 797 | 30 | ||||||||||||
|
|
|
|
|
|
|
|
|
|||||||||
| Total Active Developments |
6,488 | 867 | 7,355 | $ | 332 | |||||||||||
|
|
|
|
|
|
|
|
|
|||||||||
| Future Developments |
||||||||||||||||
| Arizona |
1,903 | — | 1,903 | $ | 22 | |||||||||||
| Nevada |
2,143 | — | 2,143 | 15 | ||||||||||||
|
|
|
|
|
|
|
|
|
|||||||||
| Total Future Developments |
4,046 | — | 4,046 | $ | 37 | |||||||||||
|
|
|
|
|
|
|
|
|
|||||||||
| Total |
10,534 | 867 | 11,401 | $ | 369 | |||||||||||
|
|
|
|
|
|
|
|
|
|||||||||
11
SIGNATURES
Pursuant to the requirements of the Securities Exchange Act of 1934, as amended, the registrant has duly caused this report to be signed on its behalf by the undersigned, hereunto duly authorized.
| WILLIAM LYON HOMES | ||
| By: | /S/ COLIN T. SEVERN | |
| Colin T. Severn | ||
| Vice President, Chief Financial Officer and Corporate Secretary | ||
Date: October 25, 2012
12