Attached files
| file | filename |
|---|---|
| 8-K - CURRENT REPORT - PACER INTERNATIONAL INC | d426254d8k.htm |
| EX-99.2 - PRESS RELEASE - PACER INTERNATIONAL INC | d426254dex992.htm |
EXHIBIT 99.1
Pacer International Reports Third Quarter Results
DUBLIN Ohio, October 25, 2012(BUSINESS WIRE)—Pacer International, Inc. (Nasdaq: PACR), the asset-light North American freight transportation and logistics services provider, today reported financial results for the three and nine month periods ended September 30, 2012.
THIRD QUARTER RESULTS
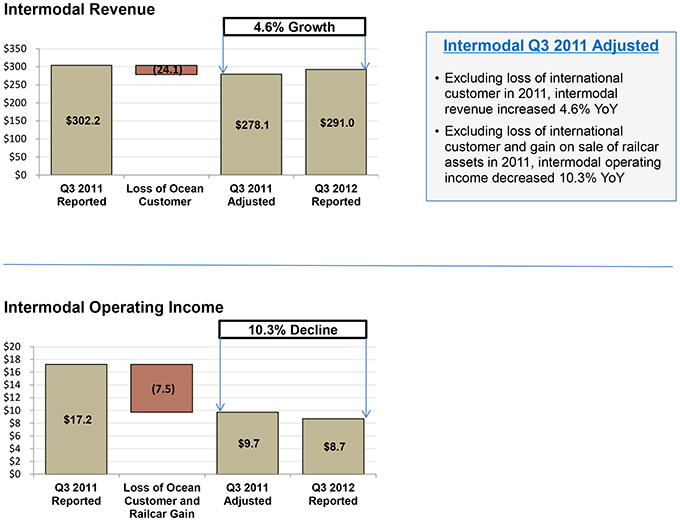
| • | Income from operations in the intermodal segment, excluding the gain on sale of railcar assets of $4.8 million in the third quarter of 2011 and the previously announced reduction in volume from an ocean carrier customer, decreased year over year by $1.0 million. Total intermodal income from operations decreased $8.5 million and logistics income from operations decreased $1.5 million. Overall income from operations decreased by $9.1 million; |
| • | Earnings per share decreased from $0.19 in the 2011 period to $0.03 in the 2012 period. Excluding the 2011 gain on sale of railcar assets, earnings per share decreased $0.02 year over year; |
| • | Selling, general and administrative expenses improved by $4.0 million or 10.7%; |
| • | Total intermodal revenue declined $11.2 million or 3.7%. Excluding the impact from the reduction in volume from an ocean carrier customer of $24.1 million in the third quarter of 2011, intermodal revenues grew by 4.6%. Logistics revenues declined to $58.1 million. In total, revenues decreased by 7.2% to $348.9 million; |
| • | Intermodal gross margin declined by $5.9 million. Excluding the reduced volume from the ocean carrier customer, intermodal gross margin decreased by $3.2 million. Logistics gross margin declined by $2.2 million; |
| • | Net income decreased $5.5 million to $1.1 million. |
(In millions, except for per share data)
| 2012 | 2011 | |||||||||||||||
| Q1 | Q2 | Q3 | Q3 | |||||||||||||
| Revenue |
$ | 345.9 | $ | 368.3 | $ | 348.9 | $ | 375.8 | ||||||||
| Gross margin |
$ | 37.8 | $ | 38.6 | $ | 37.9 | $ | 46.0 | ||||||||
| Gross margin % |
10.9 | % | 10.5 | % | 10.9 | % | 12.2 | % | ||||||||
| SG&A |
$ | 36.0 | $ | 34.2 | $ | 33.5 | $ | 37.5 | ||||||||
| Income from operations |
— | 2.5 | 2.3 | 11.4 | ||||||||||||
| Net income (loss) |
(0.3 | ) | 1.3 | 1.1 | 6.6 | |||||||||||
| Earnings (loss) per share |
$ | (0.01 | ) | $ | 0.04 | $ | 0.03 | $ | 0.19 | |||||||
“We have taken several actions in the quarter to improve our intermodal margins and we are exiting the quarter stronger from all of these actions. However, the competitive pricing environment along with rising rail costs will continue to be a challenge in our intermodal segment. Our logistics segment, excluding the cost of strategic organizational changes in Europe during the quarter, continues to improve in a sluggish global freight forwarding market and an increasingly competitive landscape. We will continue to take actions in both segments to improve financial performance going forward,” said Chief Financial Officer John J. Hafferty.
“Clearly a challenging quarter as a softening economic environment makes it difficult to achieve yields necessary to offset higher purchased transportation costs. We are addressing under-performing traffic corridors, reducing controllable costs and working with our carriers to mitigate cost increases. Our service performance is excellent and we will continue to seek margins that are comparable to the service provided,” said Chief Executive Officer Dan Avramovich.
A tabular reconciliation detailing the adjustments made to arrive at the adjusted financial results set forth above and elsewhere in this press release from financial results determined in accordance with accounting principles generally accepted in the United States of America (“GAAP”) is contained in the reconciliation schedules attached to this press release.
YEAR-TO-DATE RESULTS
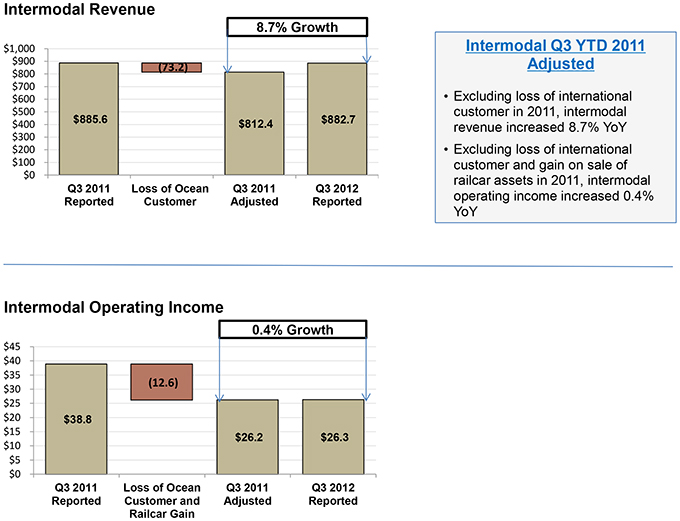
| • | Income from operations in the intermodal segment, excluding the gain on sale of railcar assets of $4.8 million in 2011 and the reduced volume from the ocean carrier customer, increased year over year by $0.1 million. Total intermodal income from operations decreased $12.5 million and logistics income from operations decreased $6.8 million. Overall income from operations decreased by $18.0 million; |
| • | Earnings per share decreased from $0.37 in the 2011 period to $0.06 in the 2012 period. Excluding the 2011 gain on sale of railcar assets, earnings per share decreased $0.17 year over year; |
| • | Selling, general and administrative expenses improved by $7.3 million or 6.6%; |
| • | Total intermodal revenue declined $2.9 million or 0.3%. Excluding the impact from the previously announced reduction in volume from an ocean carrier customer of $73.2 million through the third quarter of 2011, intermodal revenues grew by 8.7%. Logistics revenues declined by 23.0% to $181.0 million. In total, revenues decreased by 5.1% to $1,063.1 million; |
| • | Intermodal gross margin declined by $13.4 million. Excluding the reduced volume from the ocean carrier customer, intermodal gross margin decreased by $5.6 million. Logistics gross margin declined by $6.7 million; |
| • | Net income decreased $10.7 million to $2.1 million. |
(In millions, except for per share data)
| 2012 Year-to-Date |
2011 Year-to-Date |
|||||||
| Revenue |
$ | 1,063.1 | $ | 1,120.5 | ||||
| Gross margin |
$ | 114.3 | $ | 134.4 | ||||
| Gross margin % |
10.8 | % | 12.0 | % | ||||
| SG&A |
$ | 103.7 | $ | 111.0 | ||||
| Income from operations |
4.8 | 22.8 | ||||||
| Net income |
2.1 | 12.8 | ||||||
| Earnings per share |
$ | 0.06 | $ | 0.37 | ||||
2012 GUIDANCE
Given our year-to-date results, we are revising our full year 2012 earnings per share guidance which we now expect to range between $0.10 and $0.14 per share. We expect revenues in 2012 to range between $1.400 billion and $1.450 billion.
2013 GUIDANCE
As we continue to operate in an uncertain economic environment we are offering a cautious early look at 2013. We expect earnings per share in 2013 to range between $0.25 and $0.35.
CONFERENCE CALL TODAY Pacer International will hold a conference call for investors, analysts, business and trade media, and other interested parties at 8:30 a.m. ET, today (Thursday, October 25, 2012). To participate, please call five minutes early by dialing (800) 230-1059(in USA) and ask for “Pacer International Earnings Call.” International callers can dial (612) 234-9959.
An audio-only, simultaneous Webcast of the live conference call can be accessed through the Investors link on the company’s website at www.pacer.com. For persons unable to participate in either the conference call or the Webcast, a digitized replay will be available from October 25, 2012 at 11:00 a.m. ET to November 25, 2012 at 11:59 p.m. ET. For the replay, dial (800) 475-6701(USA) or (320) 365-3844 (international), using access code 252022. During such period, the replay also can be accessed through the Events Calendar within the Investors link on the company’s website at www.pacer.com
Pacer International, Inc.
Unaudited Condensed Consolidated Balance Sheets
(in millions)
| September 30, 2012 | December 31, 2011 | |||||||
| Assets | ||||||||
| Current assets |
||||||||
| Cash and cash equivalents |
$ | 12.3 | $ | 24.0 | ||||
| Accounts receivable, net |
141.0 | 133.5 | ||||||
| Prepaid expenses and other |
13.5 | 12.3 | ||||||
| Deferred income taxes |
2.6 | 4.0 | ||||||
|
|
|
|
|
|||||
| Total current assets |
169.4 | 173.8 | ||||||
|
|
|
|
|
|||||
| Property and equipment |
||||||||
| Property and equipment, cost |
107.0 | 99.8 | ||||||
| Accumulated depreciation |
(60.2 | ) | (56.1 | ) | ||||
|
|
|
|
|
|||||
| Property and equipment, net |
46.8 | 43.7 | ||||||
|
|
|
|
|
|||||
| Other assets |
||||||||
| Deferred income taxes |
14.5 | 14.1 | ||||||
| Other assets |
11.0 | 11.7 | ||||||
|
|
|
|
|
|||||
| Total other assets |
25.5 | 25.8 | ||||||
|
|
|
|
|
|||||
| Total assets |
$ | 241.7 | $ | 243.3 | ||||
|
|
|
|
|
|||||
| Liabilities and Stockholders’ Equity | ||||||||
| Current liabilities |
||||||||
| Accounts payable and other accrued liabilities |
122.4 | 127.1 | ||||||
| Long-term liabilities |
||||||||
| Other |
1.3 | 0.9 | ||||||
|
|
|
|
|
|||||
| Total liabilities |
123.7 | 128.0 | ||||||
|
|
|
|
|
|||||
| Stockholders’ equity |
||||||||
| Common stock |
0.4 | 0.4 | ||||||
| Additional paid-in-capital |
305.8 | 304.7 | ||||||
| Accumulated deficit |
(188.1 | ) | (190.2 | ) | ||||
| Accumulated other comprehensive (loss) income |
(0.1 | ) | 0.4 | |||||
|
|
|
|
|
|||||
| Total stockholders’ equity |
118.0 | 115.3 | ||||||
|
|
|
|
|
|||||
| Total liabilities and stockholders’ equity |
$ | 241.7 | $ | 243.3 | ||||
|
|
|
|
|
|||||
Pacer International, Inc.
Unaudited Condensed Consolidated Statements of Operations
(in millions, except share and per share data)
| Three Months Ended | Nine Months Ended | |||||||||||||||
| September 30, 2012 | September 30, 2011 | September 30, 2012 | September 30, 2011 | |||||||||||||
| Revenues |
$ | 348.9 | $ | 375.8 | $ | 1,063.1 | $ | 1,120.5 | ||||||||
| Operating Expenses: |
||||||||||||||||
| Cost of purchased transportation and services |
287.7 | 306.7 | 880.6 | 914.5 | ||||||||||||
| Direct operating expenses (excluding depreciation) |
23.3 | 23.1 | 68.2 | 71.6 | ||||||||||||
| Selling, general and administrative expenses |
33.5 | 37.5 | 103.7 | 111.0 | ||||||||||||
| Other income |
— | (4.8 | ) | — | (4.8 | ) | ||||||||||
| Depreciation and amortization |
2.1 | 1.9 | 5.8 | 5.4 | ||||||||||||
|
|
|
|
|
|
|
|
|
|||||||||
| Total operating expenses |
346.6 | 364.4 | 1,058.3 | 1,097.7 | ||||||||||||
|
|
|
|
|
|
|
|
|
|||||||||
| Income from operations |
2.3 | 11.4 | 4.8 | 22.8 | ||||||||||||
| Interest expense |
(0.3 | ) | (0.5 | ) | (1.1 | ) | (1.8 | ) | ||||||||
|
|
|
|
|
|
|
|
|
|||||||||
| Income before income taxes |
2.0 | 10.9 | 3.7 | 21.0 | ||||||||||||
| Income tax expense |
(0.9 | ) | (4.3 | ) | (1.6 | ) | (8.2 | ) | ||||||||
|
|
|
|
|
|
|
|
|
|||||||||
| Net income |
$ | 1.1 | $ | 6.6 | $ | 2.1 | $ | 12.8 | ||||||||
|
|
|
|
|
|
|
|
|
|||||||||
| Earnings per share: |
||||||||||||||||
| Basic: |
||||||||||||||||
| Earnings per share |
$ | 0.03 | $ | 0.19 | $ | 0.06 | $ | 0.37 | ||||||||
|
|
|
|
|
|
|
|
|
|||||||||
| Weighted average shares outstanding |
35,087,082 | 34,978,646 | 35,064,057 | 34,979,784 | ||||||||||||
|
|
|
|
|
|
|
|
|
|||||||||
| Diluted: |
||||||||||||||||
| Earnings per share |
$ | 0.03 | $ | 0.19 | $ | 0.06 | $ | 0.37 | ||||||||
|
|
|
|
|
|
|
|
|
|||||||||
| Weighted average shares outstanding |
35,380,600 | 35,019,152 | 35,328,023 | 35,010,005 | ||||||||||||
|
|
|
|
|
|
|
|
|
|||||||||
Pacer International, Inc.
Unaudited Condensed Consolidated Statements of Cash Flows
(in millions)
| Nine Months Ended | ||||||||
| September 30, 2012 | September 30, 2011 | |||||||
| Cash Flows from Operating Activities |
||||||||
| Net income |
$ | 2.1 | $ | 12.8 | ||||
| Adjustments to reconcile net income to net cash (used in) provided by operating activities: |
||||||||
| Depreciation and amortization |
5.8 | 5.4 | ||||||
| Gain on sale of railcar assets |
— | (4.8 | ) | |||||
| Amortization of deferred gain on sale lease-back transactions |
(0.6 | ) | (0.5 | ) | ||||
| Deferred taxes |
1.0 | 8.0 | ||||||
| Stock based compensation expense |
1.3 | 1.8 | ||||||
| Changes in operating assets and liabilities: |
||||||||
| Accounts receivable, net |
(7.5 | ) | 14.3 | |||||
| Prepaid expenses and other |
(1.2 | ) | 0.7 | |||||
| Accounts payable and other accrued liabilities |
(4.6 | ) | (11.9 | ) | ||||
| Other long-term assets |
0.9 | 0.8 | ||||||
| Other long-term liabilities |
(1.1 | ) | (0.3 | ) | ||||
|
|
|
|
|
|||||
| Net cash (used in) provided by operating activities |
(3.9 | ) | 26.3 | |||||
|
|
|
|
|
|||||
| Cash Flows from Investing Activities |
||||||||
| Capital expenditures |
(9.3 | ) | (5.4 | ) | ||||
| Purchase of railcar assets |
(28.4 | ) | (22.1 | ) | ||||
| Net proceeds from sale of railcar assets |
— | 28.9 | ||||||
| Net proceeds from sale lease-back transaction |
30.2 | — | ||||||
| Net proceeds from sales of property and equipment |
0.1 | 0.2 | ||||||
|
|
|
|
|
|||||
| Net cash (used in) provided by investing activities |
(7.4 | ) | 1.6 | |||||
|
|
|
|
|
|||||
| Cash Flows from Financing Activities |
||||||||
| Net repayments under revolving line of credit |
— | (13.4 | ) | |||||
| Debt issuance costs paid to third parties |
(0.2 | ) | — | |||||
| Repurchase and retirement of Pacer common stock |
(0.1 | ) | (0.1 | ) | ||||
| Withholding tax paid upon vesting of restricted and performance stock units |
(0.1 | ) | — | |||||
|
|
|
|
|
|||||
| Net cash used in financing activities |
(0.4 | ) | (13.5 | ) | ||||
|
|
|
|
|
|||||
| Net (decrease) increase in cash and cash equivalents |
(11.7 | ) | 14.4 | |||||
| Cash and cash equivalents—beginning of period |
24.0 | 4.2 | ||||||
|
|
|
|
|
|||||
| Cash and cash equivalents—end of period |
$ | 12.3 | $ | 18.6 | ||||
|
|
|
|
|
|||||
Pacer International, Inc.
Unaudited Results by Segment
(in millions)
| Three Months Ended September 30, | Nine Months Ended September 30, | |||||||||||||||||||||||||||||||
| 2012 | 2011 | Change | % Change | 2012 | 2011 | Change | % Change | |||||||||||||||||||||||||
| Revenues |
||||||||||||||||||||||||||||||||
| Intermodal |
$ | 291.0 | $ | 302.2 | $ | (11.2 | ) | (3.7 | )% | $ | 882.7 | $ | 885.6 | $ | (2.9 | ) | (0.3 | )% | ||||||||||||||
| Logistics |
58.1 | 73.7 | (15.6 | ) | (21.2 | ) | 181.0 | 235.2 | (54.2 | ) | (23.0 | ) | ||||||||||||||||||||
| Inter-segment eliminations |
(0.2 | ) | (0.1 | ) | (0.1 | ) | N/M | (0.6 | ) | (0.3 | ) | (0.3 | ) | N/M | ||||||||||||||||||
|
|
|
|
|
|
|
|
|
|
|
|
|
|
|
|
|
|||||||||||||||||
| Total |
348.9 | 375.8 | (26.9 | ) | (7.2 | ) | 1,063.1 | 1,120.5 | (57.4 | ) | (5.1 | ) | ||||||||||||||||||||
| Cost of purchased transportation and services and direct operating expense 1/ |
||||||||||||||||||||||||||||||||
| Intermodal |
263.7 | 269.0 | (5.3 | ) | (2.0 | ) | 800.9 | 790.4 | 10.5 | 1.3 | ||||||||||||||||||||||
| Logistics |
47.5 | 60.9 | (13.4 | ) | (22.0 | ) | 148.5 | 196.0 | (47.5 | ) | (24.2 | ) | ||||||||||||||||||||
| Inter-segment eliminations |
(0.2 | ) | (0.1 | ) | (0.1 | ) | N/M | (0.6 | ) | (0.3 | ) | (0.3 | ) | N/M | ||||||||||||||||||
|
|
|
|
|
|
|
|
|
|
|
|
|
|
|
|
|
|||||||||||||||||
| Total |
311.0 | 329.8 | (18.8 | ) | (5.7 | ) | 948.8 | 986.1 | (37.3 | ) | (3.8 | ) | ||||||||||||||||||||
| Gross margin |
||||||||||||||||||||||||||||||||
| Intermodal |
27.3 | 33.2 | (5.9 | ) | (17.8 | ) | 81.8 | 95.2 | (13.4 | ) | (14.1 | ) | ||||||||||||||||||||
| Logistics |
10.6 | 12.8 | (2.2 | ) | (17.2 | ) | 32.5 | 39.2 | (6.7 | ) | (17.1 | ) | ||||||||||||||||||||
|
|
|
|
|
|
|
|
|
|
|
|
|
|
|
|
|
|||||||||||||||||
| Total |
$ | 37.9 | $ | 46.0 | $ | (8.1 | ) | (17.6 | )% | $ | 114.3 | $ | 134.4 | $ | (20.1 | ) | (15.0 | )% | ||||||||||||||
| Gross margin percentage |
||||||||||||||||||||||||||||||||
| Intermodal |
9.4 | % | 11.0 | % | (1.6 | )% | 9.3 | % | 10.7 | % | (1.4 | )% | ||||||||||||||||||||
| Logistics |
18.2 | 17.4 | 0.8 | 18.0 | 16.7 | 1.3 | ||||||||||||||||||||||||||
|
|
|
|
|
|
|
|
|
|
|
|
|
|||||||||||||||||||||
| Total |
10.9 | % | 12.2 | % | (1.3 | )% | 10.8 | % | 12.0 | % | (1.2 | )% | ||||||||||||||||||||
| Income (loss) from operations |
||||||||||||||||||||||||||||||||
| Intermodal |
8.7 | 17.2 | (8.5 | ) | (49.4 | ) | 26.3 | 38.8 | (12.5 | ) | (32.2 | ) | ||||||||||||||||||||
| Logistics |
(2.3 | ) | (0.8 | ) | (1.5 | ) | N/M | (8.0 | ) | (1.2 | ) | (6.8 | ) | N/M | ||||||||||||||||||
| Corporate |
(4.1 | ) | (5.0 | ) | 0.9 | (18.0 | ) | (13.5 | ) | (14.8 | ) | 1.3 | (8.8 | ) | ||||||||||||||||||
|
|
|
|
|
|
|
|
|
|
|
|
|
|
|
|
|
|||||||||||||||||
| Total |
$ | 2.3 | $ | 11.4 | $ | (9.1 | ) | (79.8 | )% | $ | 4.8 | $ | 22.8 | $ | (18.0 | ) | (78.9 | )% | ||||||||||||||
| 1/ | Direct operating expenses are only incurred in the intermodal segment |
Pacer International, Inc.
Reconciliation of GAAP Results to Adjusted Results
For the Three and Nine Months Ended September 30, 2012 and September 30, 2011
(in millions)
| Three Months Ended September 30, 2012 |
Three Months Ended September 30, 2011 | Adjusted Variance 2012 vs 2011 |
% Adjusted Variance 2012 vs 2011 |
|||||||||||||||||||||
| GAAP Results | GAAP Results |
Adjustments | Adjusted Results |
|||||||||||||||||||||
| Revenues |
||||||||||||||||||||||||
| Intermodal |
$ | 291.0 | $ | 302.2 | $ | (24.1 | )/1 | $ | 278.1 | $ | 12.9 | 4.6 | % | |||||||||||
| Cost of purchased transportation and services and direct operating expense |
||||||||||||||||||||||||
| Intermodal |
263.7 | 269.0 | (21.4 | )/1 | $ | 247.6 | 16.1 | 6.5 | ||||||||||||||||
| Gross margin |
||||||||||||||||||||||||
| Intermodal |
27.3 | 33.2 | (2.7 | ) | 30.5 | (3.2 | ) | (10.5 | ) | |||||||||||||||
| Gross margin percentage |
||||||||||||||||||||||||
| Intermodal |
9.4 | % | 11.0 | % | 11.0 | % | 11.0 | % | (1.6 | )% | ||||||||||||||
| Income (loss) from operations |
||||||||||||||||||||||||
| Intermodal |
$ | 8.7 | $ | 17.2 | $ | (7.5 | )/2 | $ | 9.7 | $ | (1.0 | ) | (10.3 | )% | ||||||||||
| Nine Months Ended September 30, 2012 |
Nine Months Ended September 30, 2011 | Adjusted Variance 2012 vs 2011 |
% Adjusted Variance 2012 vs 2011 |
|||||||||||||||||||||
| GAAP Results | GAAP Results |
Adjustments | Adjusted Results |
|||||||||||||||||||||
| Revenues |
||||||||||||||||||||||||
| Intermodal |
$ | 882.7 | $ | 885.6 | $ | (73.2 | )/1 | $ | 812.4 | $ | 70.3 | 8.7 | % | |||||||||||
| Cost of purchased transportation and services and direct operating expense |
||||||||||||||||||||||||
| Intermodal |
800.9 | 790.4 | (65.4 | )/1 | $ | 725.0 | 75.9 | 10.5 | ||||||||||||||||
| Gross margin |
||||||||||||||||||||||||
| Intermodal |
81.8 | 95.2 | (7.8 | ) | 87.4 | (5.6 | ) | (6.4 | ) | |||||||||||||||
| Gross margin percentage |
||||||||||||||||||||||||
| Intermodal |
9.3 | % | 10.7 | % | 10.7 | % | 10.7 | % | (1.4 | )% | ||||||||||||||
| Income (loss) from operations |
||||||||||||||||||||||||
| Intermodal |
$ | 26.3 | $ | 38.8 | $ | (12.6 | )/2 | $ | 26.2 | $ | 0.1 | 0.4 | % | |||||||||||
| 1/ | Adjustment to reflect previously announced reduction in volume from an ocean carrier customer that transitioned its western U.S. intermodal business directly to the railroad. Purchased transportation and direct operating expenses were adjusted at the average intermodal margin percentage for the 2011 period. |
| 2/ | Adjustment to reflect previously announced reduction in volume from an ocean carrier customer that transitioned its western U.S. intermodal business directly to the railroad. Purchased transportation and direct operating expenses were adjusted at the average intermodal margin percentage for the 2011 period. In addition, adjustment to eliminate the gain on sale of railcar assets of $4.8 million which occurred in Q3 2011. |