Attached files
| file | filename |
|---|---|
| EX-99.3 - EXHIBIT 99.3 - OCCIDENTAL PETROLEUM CORP /DE/ | ex99_3-20121025.htm |
| EX-99.1 - EXHIBIT 99.1 - OCCIDENTAL PETROLEUM CORP /DE/ | ex99_1-20121025.htm |
| EX-99.2 - EXHIBIT 99.2 - OCCIDENTAL PETROLEUM CORP /DE/ | ex99_2-20121025.htm |
| 8-K - FORM 8-K - OCCIDENTAL PETROLEUM CORP /DE/ | form8k-20121025.htm |
| EX-99.5 - EXHIBIT 99.5 - OCCIDENTAL PETROLEUM CORP /DE/ | ex99_5-20121025.htm |
EXHIBIT 99.4

Occidental Petroleum Corporation
Third Quarter 2012 Earnings Conference Call
October 25, 2012
Third Quarter 2012 Earnings Conference Call
October 25, 2012
1

2
• Income from continuing operations — $1.4 Billion in
3Q12 vs. $1.8 Billion in 3Q11 or $1.3 Billion in 2Q12.
3Q12 vs. $1.8 Billion in 3Q11 or $1.3 Billion in 2Q12.
– EPS $1.70 (diluted) vs. $2.18 (diluted) in 3Q11 or $1.64 (diluted)
in 2Q12.
in 2Q12.
• 3Q12 income from continuing operations improved
$0.06 per diluted share from 2Q12:
$0.06 per diluted share from 2Q12:
– Higher margins in marketing and trading businesses;
– partially offset by lower earnings in the chemical segment.
– In the oil and gas segment, the effect of higher liquids
production and domestic gas prices was partially offset by the
impact of a 3% decline in realized worldwide crude oil prices.
production and domestic gas prices was partially offset by the
impact of a 3% decline in realized worldwide crude oil prices.
Third Quarter 2012 Earnings - Highlights
Third Quarter 2012 Earnings - Highlights
2
Third Quarter 2012 Earnings - Oil & Gas
Segment Variance Analysis - 3Q12 vs. 2Q12
Segment Variance Analysis - 3Q12 vs. 2Q12
Third Quarter 2012 Earnings - Oil & Gas
Segment Variance Analysis - 3Q12 vs. 2Q12
Segment Variance Analysis - 3Q12 vs. 2Q12
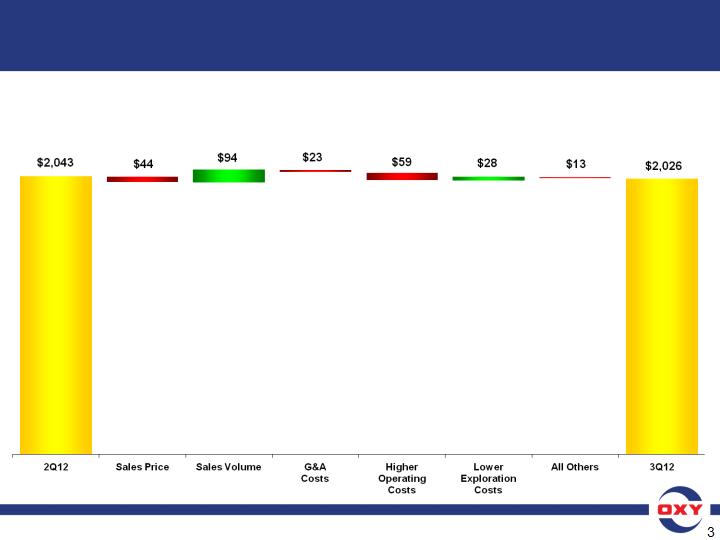
• Core Results for 3Q12 of $2.0 B vs. $2.0 B in 2Q12
($ in millions)
3

4
3Q12 3Q11
Oil and Gas Production Volumes (mboe/d) 766 739
• 3Q12 production of 766 mboe/d increased 4% from 3Q11;
• Domestic production was 469 mboe/d, an increase of
7 mboe/d from 2Q12 and the eighth consecutive quarterly
domestic volume record for the company;
7 mboe/d from 2Q12 and the eighth consecutive quarterly
domestic volume record for the company;
• Domestic production was 8% higher than 3Q11.
– Almost all of the sequential quarterly increase came from the
Permian and Williston basins;
Permian and Williston basins;
– CA production was higher in liquids but flat on a BOE basis with
2Q12, mainly due to lower gas volumes associated with initial
start-up issues of the new gas plant. These issues were resolved
mid-quarter although the positive effect of the plant on 3Q12 was
limited;
2Q12, mainly due to lower gas volumes associated with initial
start-up issues of the new gas plant. These issues were resolved
mid-quarter although the positive effect of the plant on 3Q12 was
limited;
– CA’s current production run rate is ~150 mboe/d.
Third Quarter 2012 Earnings - Oil & Gas Production
Details regarding other country-specific production levels available in the IR Supplemental Schedules
4

5
• Latin America volumes were 32 mboe/d;
• In the Middle East region, volumes were 265 mboe/d:
– Dolphin’s production was 13 mboe/d lower than 2Q12 resulting
from the full cost recovery of pre-startup capital, as we noted last
quarter;
from the full cost recovery of pre-startup capital, as we noted last
quarter;
– Qatar’s production was also impacted by a facility outage in
August, which reduced production by 5 mboe/d. The outage
was subsequently resolved;
August, which reduced production by 5 mboe/d. The outage
was subsequently resolved;
– The rest of the Middle East partially offset these decreases in
part due to higher spending levels.
part due to higher spending levels.
• Factors affecting production sharing and similar contracts,
including oil prices, did not significantly impact this quarter’s
production volumes compared to 3Q11 or 2Q12.
including oil prices, did not significantly impact this quarter’s
production volumes compared to 3Q11 or 2Q12.
Third Quarter 2012 Earnings - Oil & Gas Production
Third Quarter 2012 Earnings - Oil & Gas Production
Details regarding country specific production levels available in the IR Supplemental Schedules
5

6
• 3Q12 realized prices were mixed for our products compared
to 2Q12.
to 2Q12.
− Our worldwide crude oil realized price was $96.62 per bbl,
a decrease of about 3%;
a decrease of about 3%;
− worldwide NGLs were $40.65 per barrel, also a decrease of
about 3%;
about 3%;
− domestic natural gas prices were $2.48 per mcf, an improvement
of 19%.
of 19%.
• The change in worldwide crude oil realized price was
primarily due to the mix of sales volumes in 3Q12
primarily due to the mix of sales volumes in 3Q12
• 3Q12 realized prices were lower than 3Q11 prices for all
our products.
our products.
– On a year-over-year basis, price decreases were 1% for worldwide
crude oil;
crude oil;
– 27% for worldwide NGLs, and;
– 41% percent for domestic natural gas.
Third Quarter 2012 Earnings - Oil & Gas Segment
Realized Prices
Realized Prices
Third Quarter 2012 Earnings - Oil & Gas Segment
Realized Prices
Realized Prices
6

7
• Realized oil prices for the quarter represented 105%
of the average WTI and 88% of the average Brent price.
of the average WTI and 88% of the average Brent price.
• Realized NGL prices were 44% of the average WTI and
realized domestic gas prices were 90% of the average
NYMEX price.
realized domestic gas prices were 90% of the average
NYMEX price.
• Price changes at current global prices affect our quarterly
earnings before income taxes by $36 mm for a $1 per bbl
change in oil prices and $8 mm for a $1 per bbl change in
NGL prices.
earnings before income taxes by $36 mm for a $1 per bbl
change in oil prices and $8 mm for a $1 per bbl change in
NGL prices.
• A swing of 50 cents per mm BTUs in domestic gas prices
affects quarterly pre-tax earnings by about $35 mm.
affects quarterly pre-tax earnings by about $35 mm.
• These price change sensitivities include the impact of
production-sharing and similar contract volume changes
on income.
production-sharing and similar contract volume changes
on income.
Third Quarter 2012 Earnings - Oil & Gas Segment
Realized Prices
Realized Prices
Third Quarter 2012 Earnings - Oil & Gas Segment
Realized Prices
Realized Prices
7

8
Third Quarter 2012 Earnings - Oil & Gas Segment
3Q12 3Q11
Reported Segment Earnings ($mm) $2,026 $2,612
WTI Oil Price ($/bbl) $92.22 $89.76
Brent Oil Price ($/bbl) $109.48 $112.22
NYMEX Gas Price ($/mcf) $2.76 $4.28
Oxy’s Realized Prices
Worldwide Oil ($/bbl) $96.62 $97.24
- 1% year-over-year
Worldwide NGLs ($/bbl) $40.65 $56.06
- 27% year-over-year
US Natural Gas ($/mcf) $2.48 $4.23
- 41% year-over-year
8

9
• Oil and gas cash production costs were $15.00 per boe
for the first nine months of 2012, compared with $12.84
per boe for the full year 2011.
for the first nine months of 2012, compared with $12.84
per boe for the full year 2011.
– The cost increase reflects higher well maintenance activity, in part
reflecting our higher well count, higher workover activity and higher
support and injection costs.
reflecting our higher well count, higher workover activity and higher
support and injection costs.
• Taxes other than on income, which are generally related
to product prices, were $2.43 per boe for the first nine
months of 2012, compared with $2.21 per boe for the
full year of 2011.
to product prices, were $2.43 per boe for the first nine
months of 2012, compared with $2.21 per boe for the
full year of 2011.
• 3Q12 exploration expense was $69 million.
Third Quarter 2012 Earnings - Oil & Gas
Segment - Production Costs and Taxes
Segment - Production Costs and Taxes
Third Quarter 2012 Earnings - Oil & Gas
Segment - Production Costs and Taxes
Segment - Production Costs and Taxes
9
Third Quarter 2012 Earnings - Chemical
Segment Variance Analysis - 3Q12 vs. 2Q12
Segment Variance Analysis - 3Q12 vs. 2Q12
Third Quarter 2012 Earnings - Chemical
Segment Variance Analysis - 3Q12 vs. 2Q12
Segment Variance Analysis - 3Q12 vs. 2Q12
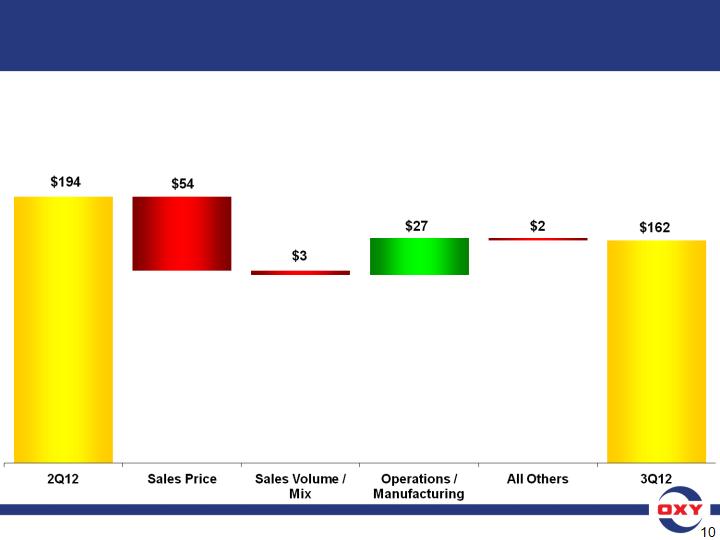
• Core Results for 3Q12 were $162 mm vs. $194 mm in 2Q12
– The sequential quarterly and year-over-year decline were due to lower Asian market demand
that drove export prices lower, partially offset by lower ethylene costs.
that drove export prices lower, partially offset by lower ethylene costs.
($ in millions)
10
Third Quarter 2012 Earnings - Midstream
Segment Variance Analysis - 3Q12 vs. 2Q12
Segment Variance Analysis - 3Q12 vs. 2Q12
Third Quarter 2012 Earnings - Midstream
Segment Variance Analysis - 3Q12 vs. 2Q12
Segment Variance Analysis - 3Q12 vs. 2Q12
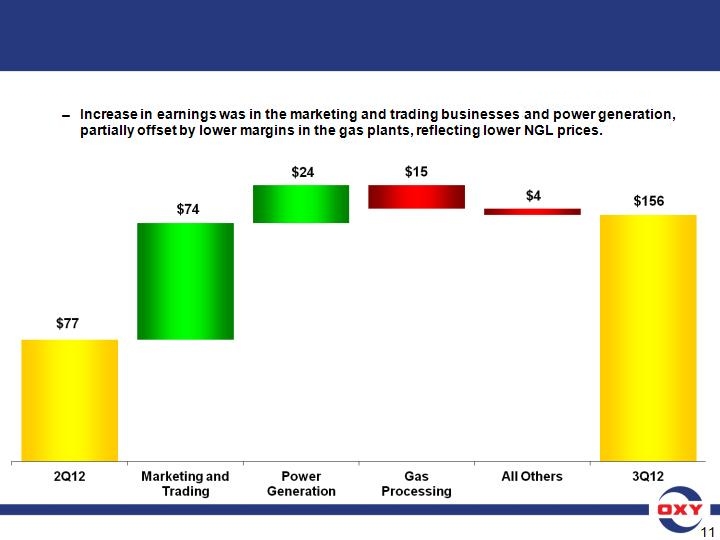
• Core Results for 3Q12 were $156 mm vs. $77 mm in 2Q12
($ in millions)
11

12
• The worldwide effective tax rate was 38% for 3Q12. The
lower rate compared to our guidance was attributable to
a shift in the mix of income toward domestic.
lower rate compared to our guidance was attributable to
a shift in the mix of income toward domestic.
• Our 3Q12 US and foreign tax rates are included in
the Investor Relations Supplemental Schedules.
the Investor Relations Supplemental Schedules.
Third Quarter 2012 Earnings - Taxes
12
Third Quarter 2012 Earnings -
2012 YTD Cash Flow
2012 YTD Cash Flow
Third Quarter 2012 Earnings -
2012 YTD Cash Flow
2012 YTD Cash Flow
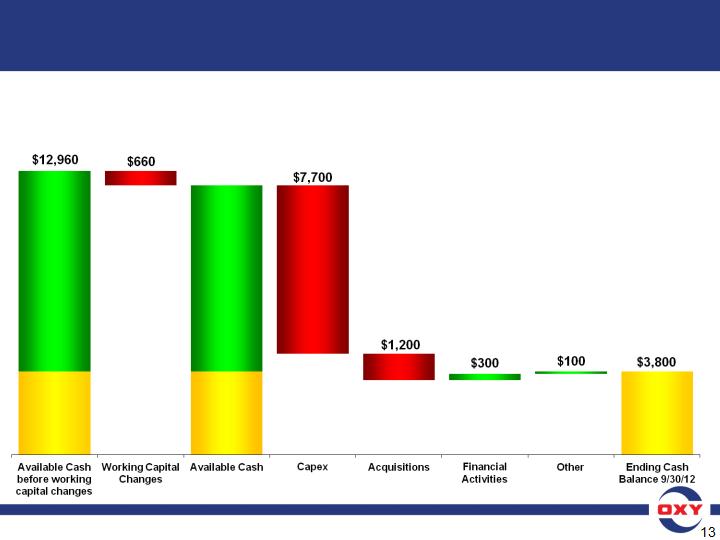
– Working capital reduced our nine-month cash flow from operations of $9.2 billion by ~$660 mm to $8.5 billion.
~$510 mm of working capital use occurred in 3Q12. Capex was $7.7 billion for the first nine months, of which
$2.6 billion was spent in 3Q12; YTD capex was 82% in oil and gas, 14% in midstream and remainder in chemicals.
Financial activities, which included dividends paid, stock buybacks and a $1.74 billion borrowing earlier this year,
provided a net $300 mm of cash flow.
($ in millions)
Cash Flow
From
Operations
before
Working
Capital
changes
From
Operations
before
Working
Capital
changes
$9,160
Beginning
Cash
$3,800
12/31/11
Cash
$3,800
12/31/11
Beginning
Cash
$3,800
12/31/11
Cash
$3,800
12/31/11
Cash Flow
From
Operations
$8,500
From
Operations
$8,500
$12,300
13

14
Third Quarter 2012 Earnings -
Shares Outstanding & Debt/Capital
Shares Outstanding & Debt/Capital
Shares Outstanding (mm) YTD12 9/30/12
Weighted Average Basic 810.1
Weighted Average Diluted 810.8
Basic Shares Outstanding 809.3
Diluted Shares Outstanding 810.1
9/30/12 12/31/11
Debt/Capital 16% 13%
14

15
Third Quarter 2012 Earnings - Key Performance Metrics
Third Quarter 2012 Earnings - Key Performance Metrics
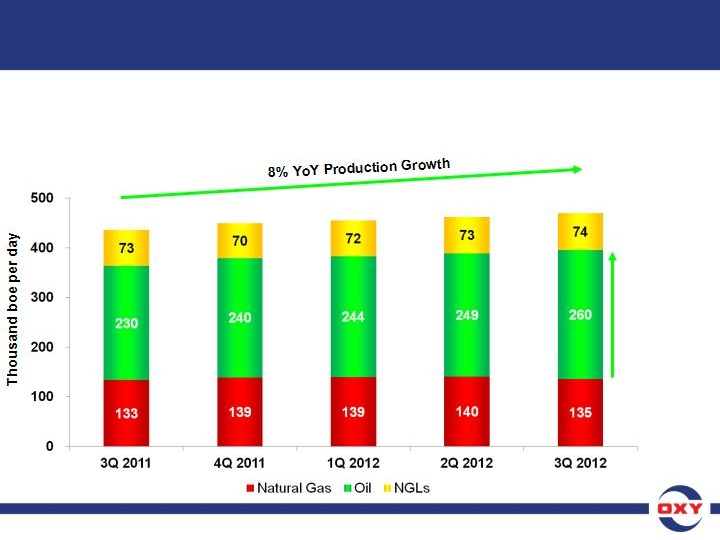
• Occidental’s domestic oil and gas segment produced record
volumes for the eighth consecutive quarter and continued to
execute on our liquids production growth strategy.
volumes for the eighth consecutive quarter and continued to
execute on our liquids production growth strategy.
• 3Q12 domestic production of 469 mboe/d, consisting of 334 mboe/d
of liquids and 812 mmcf/d of gas, was an increase of 7 mboe/d
compared to 2Q12.
of liquids and 812 mmcf/d of gas, was an increase of 7 mboe/d
compared to 2Q12.
• The increase in the domestic production over 2Q12 was almost
entirely in oil, which grew from 249 mb/d to 260 mb/d.
entirely in oil, which grew from 249 mb/d to 260 mb/d.
− Gas production declined 28 mmcf/d on a sequential quarterly basis, mainly
in CA, some of which was due to the initial start-up issues of the new gas plant.
in CA, some of which was due to the initial start-up issues of the new gas plant.
• Compared to 3Q11, domestic production grew by 8%, or 33 mboe/d,
of which 30 mb/d was oil production growth.
of which 30 mb/d was oil production growth.
• Our annualized return on equity for the first nine months of 2012
was 15% and return on capital employed was 13%.
was 15% and return on capital employed was 13%.
Note: See attached GAAP reconciliation
15
16
436
449
455
462
469
• Compared to 3Q11, our domestic production grew by 8%, or 33
mboe/d, of which 30 mb/d was oil production growth.
mboe/d, of which 30 mb/d was oil production growth.
+30 mb/d oil
production
growth
production
growth
Third Quarter 2012 Earnings - Key Performance Metrics
Third Quarter 2012 Earnings - Key Performance Metrics
16

17
Third Quarter 2012 Earnings - Oxy’s Strategy
Third Quarter 2012 Earnings - Oxy’s Strategy
• Three main objectives:
− Generate rates of return on invested capital
significantly in excess of our cost of capital;
significantly in excess of our cost of capital;
− Achieve moderate growth of the business;
− Deliver continued dividend growth.
• With regard to returns, we don't believe that a depleting or
shrinking business can maintain high rates of return. One can
reduce spending to achieve short term higher returns,
but these returns would not be sustainable as the Company
would deplete.
shrinking business can maintain high rates of return. One can
reduce spending to achieve short term higher returns,
but these returns would not be sustainable as the Company
would deplete.
• Our business model is to balance the need for growth of
the business while maintaining attractive returns.
the business while maintaining attractive returns.
• We are currently in an investing phase in many of our
businesses where higher than normal portion of our
capital is spent on longer-term projects.
businesses where higher than normal portion of our
capital is spent on longer-term projects.
17
2012 YTD Total Capital - $7.7 Billion
• These expenditures include
capital for:
capital for:
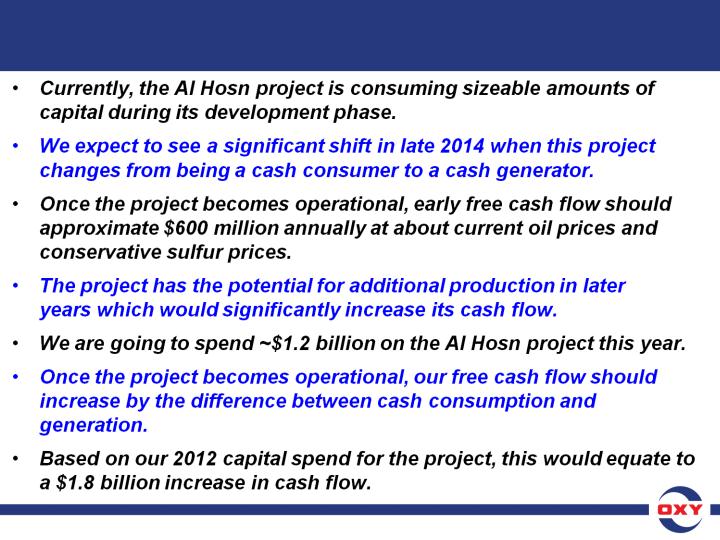
• the Al Hosn Shah gas project
which is expected to start
production in late 2014;
which is expected to start
production in late 2014;
• gas and CO2 processing
plants and pipelines to
maintain or expand the
capacity of these facilities to
handle future production
increases;
plants and pipelines to
maintain or expand the
capacity of these facilities to
handle future production
increases;
• the chemical segment, and
other items.
other items.
18
Third Quarter 2012 Earnings - Oxy’s Strategy
Third Quarter 2012 Earnings - Oxy’s Strategy
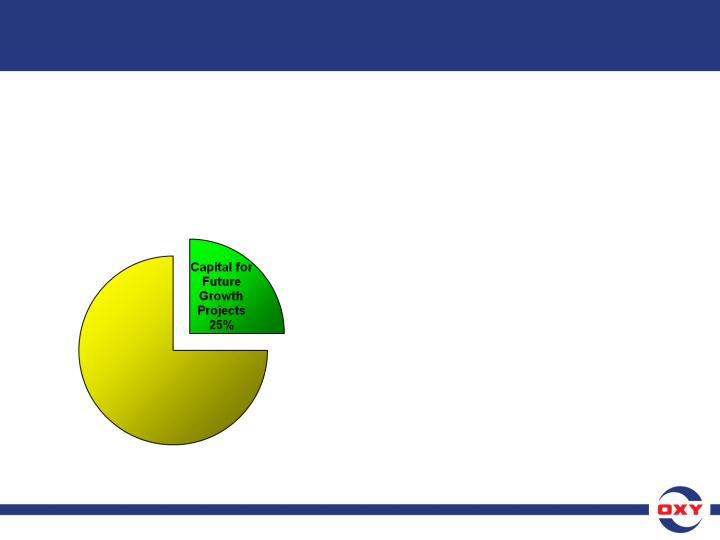
• This year, we expect to spend
~25% of our total capital
expenditures on future growth
projects that will contribute to
our operations over the next
several years.
~25% of our total capital
expenditures on future growth
projects that will contribute to
our operations over the next
several years.
18

19
• Domestically and internationally, we have a mix of both
higher return assets and higher growth assets.
higher return assets and higher growth assets.
• Importantly, many of our higher growth assets are
relatively early in their development, although we have
already experienced meaningful success.
relatively early in their development, although we have
already experienced meaningful success.
• Our Permian CO2 operation continues to be our most
profitable business generating the highest free cash
flow after capital among all of our assets.
profitable business generating the highest free cash
flow after capital among all of our assets.
• The Permian non-CO2 business is one of the fastest
growing assets in our entire portfolio.
growing assets in our entire portfolio.
− Since we began significant delineation and development efforts
in 2010, we have grown production by over 25%.
in 2010, we have grown production by over 25%.
Third Quarter 2012 Earnings - Permian
Third Quarter 2012 Earnings - Permian
19
20
Third Quarter 2012 Earnings - Permian
Third Quarter 2012 Earnings - Permian
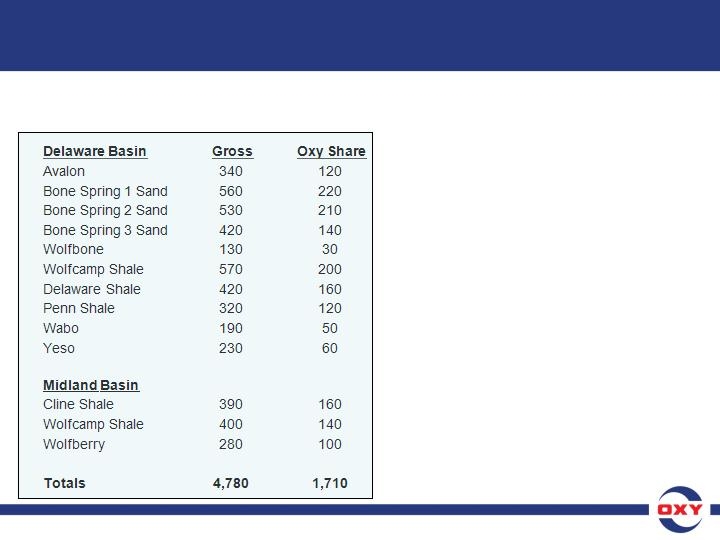
Oxy Acreage in Select Permian Basin Plays
(Thousands of Acres)
• As a result of the significant
activity by us and our partners,
our Permian acreage where we
believe resource development is
likely, has grown from our
estimate of about 3 mm gross
acres earlier in the year to about
4.8 mm acres in October.
activity by us and our partners,
our Permian acreage where we
believe resource development is
likely, has grown from our
estimate of about 3 mm gross
acres earlier in the year to about
4.8 mm acres in October.
• Oxy's net share of this acreage
grew from about 1 mm acres to
about 1.7 mm acres during the
same period.
grew from about 1 mm acres to
about 1.7 mm acres during the
same period.
20

21
• In CA, we have a very large acreage position with diverse
geologic characteristics and numerous reservoir targets.
geologic characteristics and numerous reservoir targets.
• Development opportunities range from conventional to
steam floods, water floods and shales.
steam floods, water floods and shales.
• The drilling costs and expected ultimate recoveries
(EURs) also vary for each.
(EURs) also vary for each.
Third Quarter 2012 Earnings - California
Third Quarter 2012 Earnings - California
21
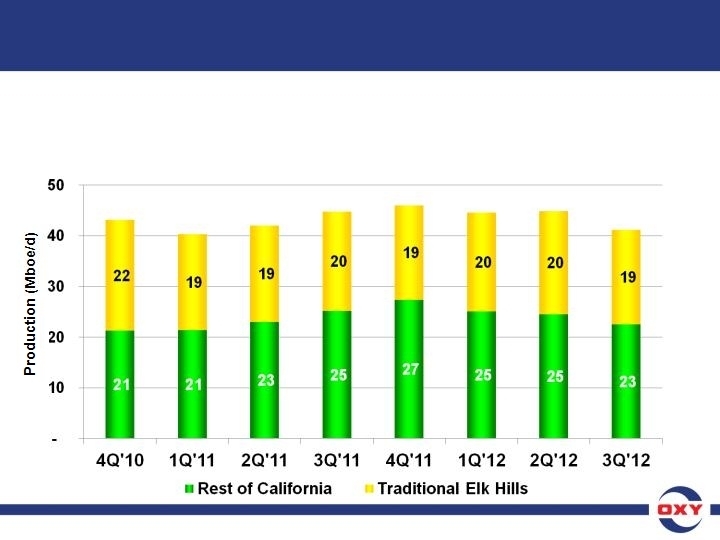
22
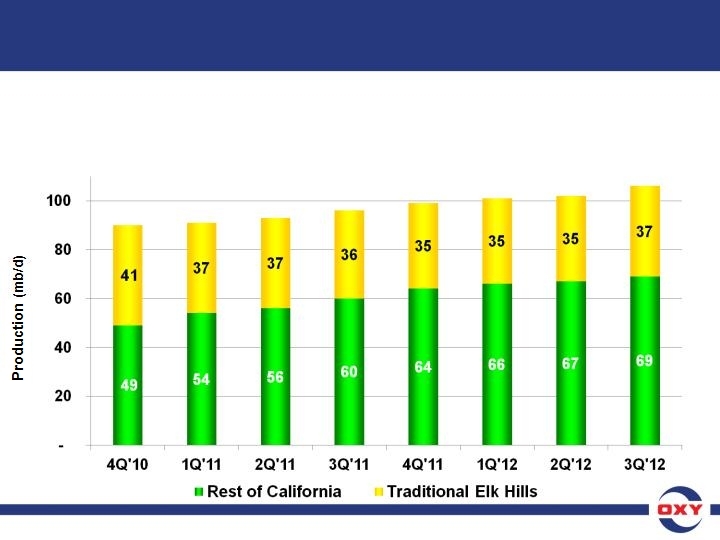
• In mid-2010, we shifted our development program to conventional
and unconventional opportunities outside of the traditional and
more mature Elk Hills areas.
and unconventional opportunities outside of the traditional and
more mature Elk Hills areas.
90
91
93
96
99
101
Third Quarter 2012 Earnings -
California Liquids Production Volumes
California Liquids Production Volumes
Third Quarter 2012 Earnings -
California Liquids Production Volumes
California Liquids Production Volumes
102
106
Liquids Production Volumes
22
23
• Recently, we further modified our programs to emphasize oil production
in light of depressed gas and associated liquids prices. As a result, gas
production in all of CA declined in 3Q12.
in light of depressed gas and associated liquids prices. As a result, gas
production in all of CA declined in 3Q12.
43
40
42
45
46
45
Third Quarter 2012 Earnings -
California Gas Production Volumes
California Gas Production Volumes
Third Quarter 2012 Earnings -
California Gas Production Volumes
California Gas Production Volumes
45
42
Gas Production Volumes
23

24
• Total CA production growth on a BOE basis is slower
than we thought it would be, in part due to the Elk Hills
decline, permitting issues and more recently low gas prices.
than we thought it would be, in part due to the Elk Hills
decline, permitting issues and more recently low gas prices.
• On a positive note, overall performance of the new
resources has been consistent with expectations,
including our unconventional opportunities for which
well performance is similar to the type curves we showed
you a couple of years ago.
resources has been consistent with expectations,
including our unconventional opportunities for which
well performance is similar to the type curves we showed
you a couple of years ago.
Third Quarter 2012 Earnings - California
Third Quarter 2012 Earnings - California
24
25
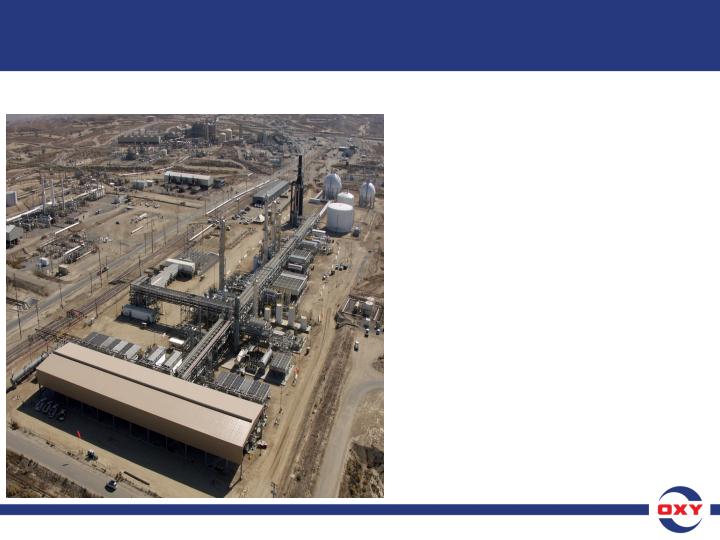
• Over the last several years we
have spent $370 mm on the
new Elk Hills gas plant.
have spent $370 mm on the
new Elk Hills gas plant.
• The plant went into operation in
early July and, notwithstanding
initial startup issues, is
positively affecting our
operational efficiency and
production including higher
liquids yields.
early July and, notwithstanding
initial startup issues, is
positively affecting our
operational efficiency and
production including higher
liquids yields.
• The plant operated optimally
for about one month last
quarter and has been operating
as expected since.
for about one month last
quarter and has been operating
as expected since.
Third Quarter 2012 Earnings - California
Third Quarter 2012 Earnings - California
Elk Hills Cryogenic Gas Processing Plant
25

26
• We will continue our focus on higher return, low cost
opportunities in CA, and this is a very diverse opportunity set.
opportunities in CA, and this is a very diverse opportunity set.
• For example, Lost Hills - a major steam flood project
– We expect to achieve significant production growth to
about 15 mb/d in several years from the current 4 mb/d;
about 15 mb/d in several years from the current 4 mb/d;
– Total oil in place in Lost Hills is estimated to be about
500 million barrels;
500 million barrels;
– Using reasonable assumptions, we expect to recover
over 50 million barrels net to Oxy;
over 50 million barrels net to Oxy;
– Our drilling costs in this area average in the low
$200,000's per well and we expect to bring this average
cost down over time.
$200,000's per well and we expect to bring this average
cost down over time.
Third Quarter 2012 Earnings - California
Third Quarter 2012 Earnings - California
26

27
• In the Williston basin in North Dakota, we currently have over
310,000 net acres with significant resource potential, which we
estimate to be about 250 million net barrels.
310,000 net acres with significant resource potential, which we
estimate to be about 250 million net barrels.
• Our production in the basin has tripled since we entered the
area over a year and a half ago.
area over a year and a half ago.
• We have recently slowed our drilling activity in the basin and
significantly reduced our rig count.
significantly reduced our rig count.
• While well costs have declined modestly, we will only increase
our rig count when costs come down enough to make returns
competitive with the rest of our portfolio.
our rig count when costs come down enough to make returns
competitive with the rest of our portfolio.
• We believe over the long-term, the total resource base in the
Williston basin represents a significant opportunity for the Company.
Williston basin represents a significant opportunity for the Company.
• In the Mid-Continent, including our assets in South Texas, we have
significantly reduced our gas directed drilling.
significantly reduced our gas directed drilling.
• However, we could ramp up our gas production rapidly and
meaningfully if prices for gas and associated liquids improved from
their current levels on a sustained basis.
meaningfully if prices for gas and associated liquids improved from
their current levels on a sustained basis.
Third Quarter 2012 Earnings -
Williston / Mid-Continent
Williston / Mid-Continent
Third Quarter 2012 Earnings -
Williston / Mid-Continent
Williston / Mid-Continent
27
Third Quarter 2012 Earnings - International
Third Quarter 2012 Earnings - International
28
29
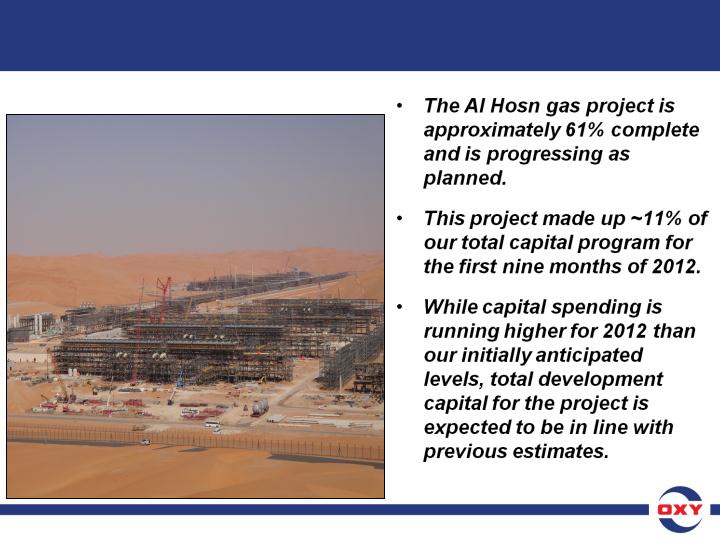
Third Quarter 2012 Earnings - International
Third Quarter 2012 Earnings - International
Al Hosn Gas Project
29
30
Third Quarter 2012 Earnings - International
Third Quarter 2012 Earnings - International
30
31
Third Quarter 2012 Earnings - Operating Costs &
Capital
Capital
Third Quarter 2012 Earnings - Operating Costs &
Capital
Capital
31
32
Third Quarter 2012 Earnings -
Operating Costs & Capital
Operating Costs & Capital
Third Quarter 2012 Earnings -
Operating Costs & Capital
Operating Costs & Capital
32
33
Third Quarter 2012 Earnings - 4Q12 Outlook
Capital Program
Capital Program
Third Quarter 2012 Earnings - 4Q12 Outlook
Capital Program
Capital Program
33

34
• Over the past year, we have achieved our goal of
increasing domestic production by 6 to 8 mboe/d
quarter-over-quarter.
increasing domestic production by 6 to 8 mboe/d
quarter-over-quarter.
– We expect our 4Q12 oil production to grow by about this much.
– However, the expected decline in gas production resulting from
the change in our capital program focus may offset some of the
increased oil production on an equivalent basis.
the change in our capital program focus may offset some of the
increased oil production on an equivalent basis.
• Internationally, at current prices we expect production
to be approximately flat with 3Q12, while sales volumes
increase slightly.
to be approximately flat with 3Q12, while sales volumes
increase slightly.
• We expect 4Q12 exploration expense to be about
$100 mm for seismic and drilling in our exploration
programs.
$100 mm for seismic and drilling in our exploration
programs.
Third Quarter 2012 Earnings - 4Q12 Outlook
Oil and Gas Production
Oil and Gas Production
34

35
• The fourth quarter is typically the chemical segment’s
weakest quarter.
weakest quarter.
• We estimate 4Q12 earnings will be about $140 mm,
or slightly lower than 3Q12.
or slightly lower than 3Q12.
– Along with seasonal factors, weak global demand from the
European and Asian economies and rising natural gas costs
will keep pressure on margins.
European and Asian economies and rising natural gas costs
will keep pressure on margins.
• We expect our combined worldwide tax rate in 4Q12
to increase to about 40% to 41%.
to increase to about 40% to 41%.
Third Quarter 2012 Earnings - 4Q12 Outlook
Chemicals & Taxes
Chemicals & Taxes
35

36
Third Quarter 2012 Earnings - Summary
Third Quarter 2012 Earnings - Summary
• We believe we have a deep portfolio of development opportunities
that will allow us to continue to deliver returns that are 5 to 6
percentage points above our cost of capital.
that will allow us to continue to deliver returns that are 5 to 6
percentage points above our cost of capital.
• Total return to our shareholders is the combination of
appreciation in stock price and dividends.
appreciation in stock price and dividends.
• As I have mentioned before, if we are unable to generate
value to our stockholders as measured by relative stock
performance over a reasonable period of time, the Company's
policy would then be to retain a smaller portion of its earnings
and return a larger portion to its stockholders.
value to our stockholders as measured by relative stock
performance over a reasonable period of time, the Company's
policy would then be to retain a smaller portion of its earnings
and return a larger portion to its stockholders.
• We have increased our dividends at a compounded annual rate of
15.8% over the last 10 years through 11 dividend increases.
15.8% over the last 10 years through 11 dividend increases.
• We expect to increase our dividends again next year and in the
future at a rate that would maximize returns to our stockholders.
future at a rate that would maximize returns to our stockholders.
36
37
Third Quarter 2012 Earnings - Q&A
Third Quarter 2012 Earnings - Q&A
37
|
Occidental Petroleum Corporation
|
||
|
Return on Capital Employed (ROCE)
|
||
|
Reconciliation to Generally Accepted Accounting Principles (GAAP)
|
||
|
2012
|
||
|
RETURN ON CAPITAL EMPLOYED (%)
|
12.6
|
|
|
GAAP measure - net income
|
4,262
|
|
|
Interest expense
|
87
|
|
|
Tax effect of interest expense
|
(30
|
)
|
|
Earnings before tax-effected interest expense
|
4,319
|
|
|
GAAP stockholders' equity
|
40,474
|
|
|
Debt
|
7,622
|
|
|
Total capital employed
|
48,096
|
|
|
ROCE - Annualized for the nine months of September 30, 2012
|
12.6
|
|
ROCE-ROE