Attached files
| file | filename |
|---|---|
| 8-K - FIRST MERCHANTS CORPORATION - 3RD QUARTER 2012 EARNING SLIDES - FIRST MERCHANTS CORP | f8k3rdqtr2012earningslides.htm |

1
First Merchants Corporation
3rd Quarter 2012
Earnings Call
3rd Quarter 2012
Earnings Call
October 25, 2012

2
Michael C. Rechin
President
and Chief Executive Officer

3
The Corporation may make forward-looking statements about
its relative business outlook. These forward-looking statements
and all other statements made during this meeting that do not
concern historical facts are subject to risks and uncertainties
that may materially affect actual results.
Specific forward-looking statements include, but are not limited
Specific forward-looking statements include, but are not limited
to, any indications regarding the financial services industry, the
economy and future growth of the balance sheet or income
statement.
Please refer to our press releases, Form 10-Qs and 10-Ks
Please refer to our press releases, Form 10-Qs and 10-Ks
concerning factors that could cause actual results to differ
materially from any forward-looking statements.

4
EPS
§ $.35 3rd Quarter EPS
§ $1.09 YTD EPS
Reported Total Revenue and Loan Growth
§ $38.7M 3rd Quarter Loan Growth
(1.4% Qtr-over-Qtr, 5.5% Annualized)
§ $41.3M 3rd Quarter Total Net-Interest Income-FTE
(4.6% Qtr-over-Qtr Increase)
§ $14.3M 3rd Quarter Total Non-Interest Income
(8.3% Qtr-over-Qtr Increase)
§ $55.6M 3rd Quarter Total Revenue
(5.5% Qtr-over-Qtr Increase)
§ 4.32% Net Interest Margin
(5.1% Qtr-over-Qtr Increase)

5
Mark K. Hardwick
Executive Vice President
and Chief Financial Officer

6
2010
2011 Q1-’12 Q2-’12 Q3-’12
1. Investments
$ 827 $ 946 $ 960 $ 944 $ 929
2. Loans Held for Sale 21 18 22 15 28
3. Loans 2,836 2,713 2,793 2,798 2,836
4. Allowance (83) (71) (70) (70) (69)
5. CD&I & Goodwill 154 150 150 150 150
6. BOLI 97 124 123 124 125
7. Other 319 293 258 271 251
8. Total Assets $4,171 $4,173 $4,236 $4,232 $4,250
($ in Millions)

7
(as of 09/30/2012)
QTD Yield = 5.29%
YTD Yield = 5.23%
Total = $2.9B
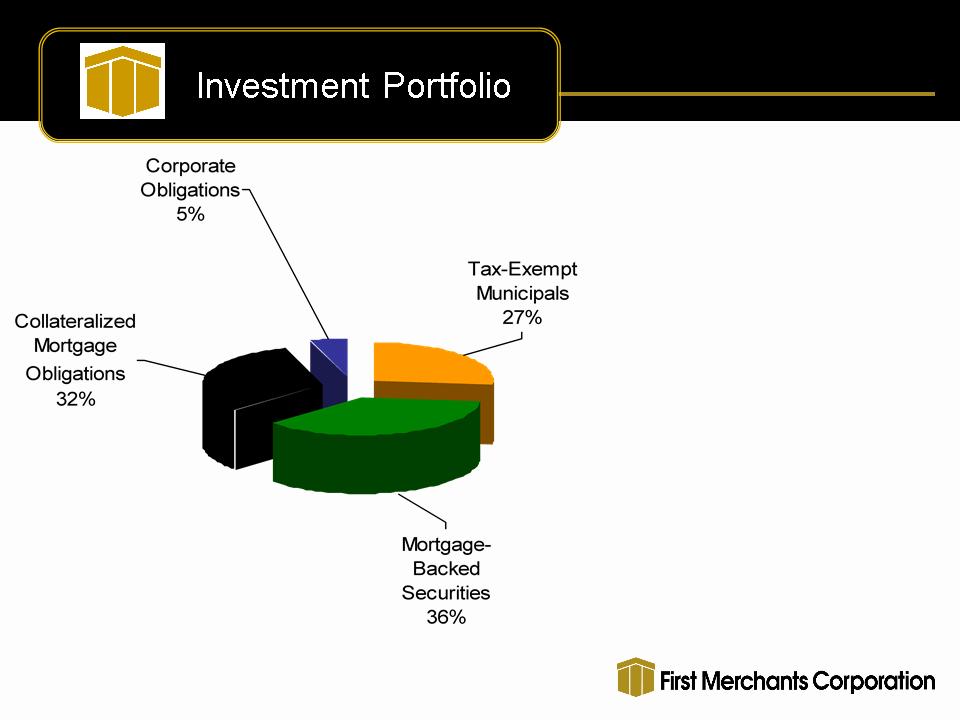
8
(as of 09/30/2012)
§ $929 Million Balance
§ Average duration - 3.8 years
§ Tax equivalent yield of 3.66%
§ Net unrealized gain of $44.8 million

9
2010
2011 Q1-’12 Q2-’12 Q3-’12
1. Customer Non-Maturity Deposits
$2,127 $2,196 $2,273 $2,343 $2,293
2. Customer Time Deposits 996 816 836 808 784
3. Brokered Deposits 146 123 170 138 118
4. Borrowings 277 378 287 263 361
5. Other Liabilities 28 34 31 33 40
6. Hybrid Capital 142 111 111 111 107
7. Preferred Stock (CPP) 68 ― ― ―
―
8. Preferred Stock (SBLF) ― 91
91 91 91
9. Common Equity
387 424 437 445 456
10. Total Liabilities and Capital $4,171 $4,173 $4,236 $4,232 $4,250
($ in Millions)

10
(as of 09/30/2012)

11
2010
2011 Q1-’12 Q2-’12 Q3-’12
1. Total Risk-Based
Capital Ratio 15.74% 16.54% 16.39% 16.75% 16.62%
2. Tier 1 Risk-Based
Capital Ratio 12.82% 13.92% 14.14% 14.49% 14.39%
3. Leverage Ratio 9.50% 10.17% 10.61% 10.73% 10.98%
4. Tier 1 Common Risk-
Based Capital Ratio 7.64% 8.83% 9.20% 9.54% 9.71%
5. TCE/TCA 5.86% 6.84% 7.07% 7.27% 7.51%

12
|
|
|
|
|
|
|
|
|
|
|
|
|
|
|
|
|
|
|
|
|
|
|
|
|
|
|
|
|
|
|
|
|
|
|
|
|
|
|
|
|
|
|
|
|
|
|
|
|
|
|
|
|
|
|
|
|
|
|
|
|
|
|
|
|
|
|
|
|
|
|
|
|
|
|
|
|
|
|
|
|
|
|
|
|
|
|
|
|
|
|
|
|
|
|
|
|
|
|
|
|
|
|
|
|
|
|
|
|
|
|
|
|
|
|
|
|
|
|
|
|
|
|
Q3-’10 Q4-’10 Q1-’11 Q2-’11 Q3-’11 Q4-’11 Q1-’12 Q2-’12 Q3-’12
Net Interest Income - FTE
($millions) $ 37.2 $ 36.7 $ 36.9 $ 37.3 $ 37.3 $ 37.6 $ 37.6 $ 39.5 $ 41.3
Tax Equivalent Yield on Earning
Assets 5.38% 5.13% 5.11% 5.04% 5.01% 4.83% 4.74% 4.75% 4.89%
Cost of Supporting
Liabilities 1.45% 1.30% 1.16% 1.05% 0.99% 0.84% 0.78% 0.64% 0.57%
|
|
|||||||||
|
|
|||||||||
|
|
|||||||||
|
|
|||||||||
|
|
|||||||||
|
|
|
|
|
|
|
|
|
|
|
|
|
|
|
|
|
|
|
|
|
|
|
|
|
|
|
|
|
|
|
|
|
|
|
|
|
|
|
|
|
|
|
|
|
|
|
|
|
|
|
|
|
|
|
|
|
|
|
|
|
|
|
|
|
|
|
|
|
|
|
|
|
|
|
|
|
|
|
|
|
|
|
|
|
|
|
|
|
|
|
|
|
|
|
|
|
|
|
|
|
|
|
|
|
|
|
|
|
|
|
|
|
|
|
|
|
|
|
|
|
|
|
|
|
|
|
|
|
|
|
|
|
|
|
|
|
|
|
|
|
|
|
|
|
|
|
|
|
|
|
|
|
|
|
|
|
|
|
|
|
|
|
|
|
|
|
|
|
|
|
|
|
|
|
|
|
|
|
|
|
|
|
|
|
|
|
|
|
|
|
|
|
|
|
|
|
|
|
|
|
|
|
|
|
|
|
|
|
|
|
|
|
|
|
|
|
|
|
|
|
|
|
|
|
|
|
|
|
|
|
|
|
|
|
|
|
|
|
|
|
|
|
|
|
|
|
|
|
|
|
|
|
|
|
|
|
|
|
|
|
|
|
|
|
|
|
|
|
|
|
|
|
|
|
|
|
|
|
|
|
|
|
|
|
|
|
|
|
|
|
|
|
|
|
|
|
|
|
|
|
|
|
|
|
|
|
|
|
|
|
|
|
|
|
|
|
|
|
|
|
|
|
|
|
|
|
|
|
|
|
|
|
|
|
|
|
|
|
|
|
|
|
|
|
|
|
|
|
|
|
|
|
|
|
|
|
|
|
|
|
|
|
|
|
|
|
|
|
|
|
|
|
|
|
|
|
|
|
|
|
|
|
|
|
|
|
|
|
|
|
|
|
|
|
|
|
|
|
|
|
|
|
|
|
|
|
|
|
|
|
|
|
|
|
|
|
|
|
|
|
|
|
|
|
|
|
|
|
|
|
|
|
|
|
|
|
|
|
|
|
|
|
|
|
|
|
|
|
|
|
|
|
|
|
|
|
|
|
|
|
|
|
|
|
|
|
|
|
|
|
|
|
|
|
|
|
|
|
|
|
|
|
|
|
|
|
|
|
|
|
|
|
|
|
|
|
|
|
|
|
|
|
|
|
|
|
|
|
|
|
|
|
|
|
|
|
|
|
|
|
|
|
|
|
|
|
|
|
|
|
|
|
|
|
|
|
|
|
|
|
|
|
|
|
|
|
|
|
|
|
|
|
|
|
|
|
|
|
|
|
|
|
|
|
|
|
|
|
|
|
|
|
|
|
|
|
|
|
|
|
|
|
|
|
|
|
|
|
|
|
|
|
|
|
|
|
|
|
|
|
|
|
|
|
|
|
|
|
|
|
|
|
|
|
|
|
|
|
|
|
|
|
|
|
|
|
|
|
|
|
|
|
|
|
|
|
|
|
|
|
|
|
|
|
|
|
|
|
|
|
|
|
|
|
|
|
|
|
|
|
|
|
|
|
|
|
|
|
|
|
|
|
|
|
|
|
|
|
|
|
|
|
|
|
|
|
|
|
|
|
|
|
|
|
|
|
|
|
|
|
|
|
|
|
|
|
|
|
|
|
|
|
|
|
|
|
|
|
|
|
|
|
|
|
|
|
|
|
|
|
|
|
|
|
|
|
|
|
|
|
|
|
|
|
|
|
|
|
|
|
|
|
|
|
|
|
|
|
|
|
|
|
|
|
|
|
|
|
|
|
|
|
|
|
|
|
|
|
|
|
|
|
|
|
|
|
|
|
|
|
|
|
|
|
|
|
|
|
|
|
|
|
|
|
|
|
|
|
|
|
|
|
|
|
|
|
|
|
|
|
|
|
|
|
|
|
|
|
|
|
|
|
|
|
|
|
|
|
|
|
|
|
|
|
|
|
|
|
|
|
|
|
|
|
|
|
|
|
|
|
|
|
|
|
|
|
|
|
|
|
|
|
|
|
|
|
|
|
|
|
|
|

13
2010 2011 Q1-’12 Q2-’12 Q3-’12
1. Service Charges on Deposit Accounts $13.3 $12.0 $2.8 $ 2.9 $ 2.9
2. Trust Fees 7.7 7.7 2.0 1.9 2.0
3. Insurance Commission Income 6.2 5.7 1.7 1.5 1.6
4. Electronic Card Fees 6.1 6.5 1.7 2.1 1.7
5. Cash Surrender Value of Life Ins 2.1 2.6 1.4 0.7 0.7
6. Gains on Sales Mortgage Loans 6.8 7.4 2.0 2.3 2.9
7. Securities Gains/Losses
1.9 2.0 0.8 0.5 0.8
8. Gain on FDIC Acquisition ― ― 9.1 ― ―
9. Other
4.4 5.2 1.2 1.3 1.7
10. Total $48.5 $49.1 $22.7 $13.2 $14.3
11. Adjusted Non-Interest Income1
$46.6 $47.1 $12.8 $12.7 $13.5
1Adjusted for Bond Gains & Losses and Gain on FDIC-Modified Whole-Bank Transaction
($ in Millions)

14
2010
2011 Q1-’12 Q2-’12 Q3-’12
1. Salary & Benefits $ 73.3 $74.7 $19.4 $19.6 $20.1
2. Premises & Equipment 17.2 16.9 4.4 4.1 4.4
3. Core Deposit Intangible 4.7 3.5 0.5 0.5 0.5
4. Professional Services
1.4 2.2 0.7 0.5 0.5
5. OREO/Credit-Related Expense 14.6 10.6 2.2 2.1 2.1
6. FDIC Expense 8.1 5.5 1.1 0.9 0.8
7. Outside Data Processing 5.1 5.7 1.4 1.5 1.4
8. Marketing 2.0 2.0 0.4 0.6 0.5
9. Other 15.9 14.8 3.9 4.4 4.1
10. Total $142.3 $135.9 $34.0 $34.2 $34.4
($ in Millions)

15
2010 2011 Q1-’12 Q2-’12 Q3-’12
1. Net Interest Income-FTE $149.4 $149.1 $37.6 $38.8 $38.7
2. Non Interest Income1 46.6 47.1 12.8 12.7 13.5
3. Non Interest Expense (142.3) (135.9) (34.0) (34.2) (34.4)
4. Pre-Tax Pre-Provision Earnings $53.7
$60.3 $16.4 $17.3 $17.8
5. Provision (46.5) (22.6) (4.9) (4.5) (4.6)
6. Adjustments1 1.9 2.0 9.9 1.2 3.4
7. Taxes - FTE (2.3) (14.4) (7.1) (4.8) (5.4)
8. Gain /(Loss) on CPP/Trust Preferred 10.1 (12.3) ―
― ―
9. Preferred Stock Dividend (5.2)
(4.0) (1.1) (1.1) (1.1)
10. Net Income Avail. for Distribution $ 11.7 $ 9.0 $13.2 $ 8.1 $10.1
11. EPS $ 0.48
$0.34 $0.46 $0.28 $0.35
1Adjusted for Bond Gains & Losses, Gain on FDIC-Modified Whole-Bank Transaction, and Fair Market Value Accretion
($ in Millions)

16
1
2
2
2
|
2010
|
Q1
|
Q2
|
Q3
|
Q4
|
Total
|
|
1. Reported
|
$ .01
|
$ .35
|
$ .02
|
$ .10
|
$ .48
|
|
2. Adjusted
|
$ .01
|
($ .05)
|
$ .02
|
$ .10
|
$ .08
|
|
|
|
|
|
|
|
|
2011
|
Q1
|
Q2
|
Q3
|
Q4
|
Total
|
|
3. Reported
|
$ .17
|
$ .18
|
($ .25)
|
$ .24
|
$ .34
|
|
4. Adjusted
|
$ .17
|
$ .18
|
$ .21
|
$ .24
|
$ .80
|
|
|
|
|
|
|
|
|
2012
|
Q1
|
Q2
|
Q3
|
Q4
|
Total
|
|
5. Reported
|
$ .46
|
$ .28
|
$ .35
|
-
|
$1.09
|
|
6. Adjusted
|
$ .25
|
$ .26
|
$ .29
|
-
|
$ .80
|
1Adjusted for gains and losses on CPP/Trust Preferred refinance and repayment net of taxes (Line 8 on slide 15)
2Adjusted for Gain on FDIC-Modified Whole-Bank Transaction and Fair Market Value Accretion
1

17
John J. Martin
Senior Vice President
and Chief Credit Officer

18
($ in Millions)

19

20
($ in Millions)

21
($ in Millions)
$ ▲
3Q-’11 4Q-’11 1Q-’12 2Q-’12 3Q-’12 2Q to 3Q
1. Core Loan Portfolio 2,712.9 2,713.4 2,793.0 2,797.6 2,836.3 38.7
2. Held for Sale 12.3 17.9 22.1 15.3 27.7 12.4
Loan Growth:
3. CRE Non-Owner Occupied 598.9 598.1 632.7 639.2 682.0 42.8
4. Commercial/Industrial 552.9 572.0 583.2 597.7 634.2 36.5
Loan Declines:
5. CRE Owner-Occupied 486.6 464.7 466.3 453.1 431.7 (21.4)
6. Other Consumer Loans 94.9 87.7 81.8 86.9 80.1 (6.8)

22
Core Loan Portfolio Growth Led by C & I and Non-Owner Occupied CRE
Renegotiated “A/B” Note Strategy Improving Asset Quality
Limited Impact from Drought on the Agriculture Portfolio
OREO and Other Credit-Related Expenses Trending Lower

23
Michael C. Rechin
President
and Chief Executive Officer

24
Growth Company Attributes
§ Robust Mortgage and Commercial Pipelines
§ Loan Growth Beginning to Take Hold
§ Strong Core Deposit Funding Base
§ Tangible Common Equity - 7.51%
§ Adequate Reserve Level for Portfolio Risk
§ Engaged Workforce Directed Towards Customers and Communities
Continue Investments for the Future
§ Investing in Customers - Product Offerings and ATM Platform
§ Investing in Facilities - Refurbishments and New Facilities
§ Investing in Employees - Hiring, Training and Development

25
Intensify Revenue-Generating Activity and Grow Revenue
§ Accelerate Pipeline Conversion of Commercial Banking
Opportunities
§ Deploy Retail Point-of-Sale CRM System
§ Add Business Banking Professionals in Key Markets
Improve Efficiency and Utilize Capital Flexibility
§ Complete Three Announced Banking Center Consolidations
§ Harvest Benefits from Investments in Consumer Collections,
Human Resource and Finance Systems
§ Leverage Back-Office Infrastructure
§ Clarify SBLF Repayment Alternatives
Evaluating Non-Organic Growth Opportunities
“Growth and Top-Tier
Performance”
Performance”

26
First Merchants Corporation common stock is traded
on the NASDAQ Global Select Market under the
symbol FRME.
Additional information can be found at
www.firstmerchants.com
Investor inquiries:
David L. Ortega, Investor Relations
Telephone: 765.378.8937
dortega@firstmerchants.com