Attached files
| file | filename |
|---|---|
| 8-K - FORM 8-K - Colfax CORP | v326544_8k.htm |
| EX-99.1 - EXHIBIT 99.1 - Colfax CORP | v326544_ex99-1.htm |

Third Quarter 2012 Earnings Conference Call October 25, 2012

2 The following information contains forward - looking statements, including forward - looking statements within the meaning of the Private Securities Litigation Reform Act of 1995. Such forward - looking statements include, but are not limited to, statements concerning Colfax's plans, objectives, expectations and intentions and other statements that are not historical or current facts. Forward - looking statements are based on Colfax's current expectations and involve risks and uncertainties that could cause actual results to differ materially from those expressed or implied in such forward - looking statements. Factors that could cause Colfax's results to differ materially from current expectations include, but are not limited to, factors detailed in Colfax's reports filed with the U.S. Securities and Exchange Commission including its 2011 Annual Report on Form 10 - K under the caption “Risk Factors”. In addition, these statements are based on a number of assumptions that are subject to change. This presentation speaks only as of this date. Colfax disclaims any duty to update the information herein. Forward - Looking Statements

3 3 Q3 2012 Results

4 Q3 2012 Highlights • Adjusted net income of $40.7 million ($0.33 per share) compared to $13.2 million ($0.30 per share) in Q3 2011, which includes a non - cash 3 cents per share gain related to adjustments to deferred tax balances • Net sales of $954.4 million, a decrease of 1.8% from Q3 2011 proforma net sales of $971.7 million; an organic increase of 5.1% • Adjusted operating income of $85.3 million compared to $19.6 million in Q3 2011 • Third quarter gas - and fluid - handling orders of $443.8 million compared to proforma orders of $451.2 million in Q3 2011, a decrease of 1.6%; an organic increase of 4.0% • Gas - and fluid - handling backlog of $1.4 billion at period end 4

5 Year to Date 2012 Highlights • Adjusted net income of $109.3 million ($0.92 per share) compared to $35.2 million ($0.79 per share) in Q3 2011 • Net sales of $2.9 billion, an increase of 3.5% from the nine months ended September 30, 2011 proforma net sales of $2.8 billion • Adjusted operating income of $245.9 million compared to $55.2 million in Q3 2011 • Gas - and fluid - handling orders of $1.5 billion compared to proforma orders of $1.4 billion in the nine months ended September 30, 2011, an increase of 3.5%; organic increase of 3.1% 5

6 6 Gas - and Fluid - Handling

7 Gas - and Fluid - Handling Q3 2012 Highlights • Net sales of $464.9 million compared to proforma net sales of $423.0 million in Q3 2011, an increase of 9.9%; an organic increase of 14.6% • Adjusted segment operating income of $51.7 million and adjusted segment operating income margin of 11.1% • Q3 2012 orders of $443.8 million compared to proforma orders of $451.2 million in Q3 2011, a decrease of 1.6%; an organic increase of 4.0% • Backlog of $1.4 billion at period end 7

8 Gas - and Fluid - Handling YTD 2012 Highlights • Net sales of $1.4 billion compared to proforma net sales of $1.2 billion in the nine months ended September 30, 2011, an increase of 13.0%; an organic increase of 14.4% • Adjusted segment operating income of $153.3 million and adjusted segment operating income margin of 11.1% • Orders of $1.5 billion compared to proforma orders of $1.4 billion the nine months ended September 30, 2011, an increase of 3.5%; an organic increase of 3.1% 8
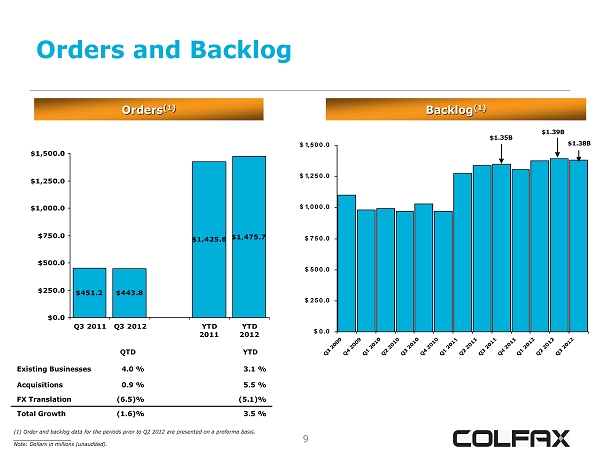
9 Orders and Backlog 9 Orders (1) $451.2 $443.8 $1,425.6 $1,475.7 $0.0 $250.0 $500.0 $750.0 $1,000.0 $1,250.0 $1,500.0 Q3 2011 Q3 2012 YTD 2011 YTD 2012 Backlog (1) $0.0 $250.0 $500.0 $750.0 $1,000.0 $1,250.0 $1,500.0 Q3 2009Q4 2009Q1 2010Q2 2010Q3 2010Q4 2010Q1 2011Q2 2011Q3 2011Q4 2011Q1 2012Q2 2012Q3 2012 (1) Order and backlog data for the periods prior to Q2 2012 are presented on a proforma basis. __________________ Note: Dollars in millions (unaudited). QTD YTD Existing Businesses 4.0 % 3.1 % Acquisitions 0.9 % 5.5 % FX Translation (6.5)% (5.1)% Total Growth (1.6)% 3.5 % $1.35B $1.39B $1.38B

10 Revenue 10 Revenue (1) $423.0 $464.9 $1,226.7 $1,386.7 $0.0 $250.0 $500.0 $750.0 $1,000.0 $1,250.0 $1,500.0 Q3 2011 Q3 2012 YTD 2011 YTD 2012 (1) Q3 2011 and YTD 2011 sales are presented on a proforma basis. __________________ Note: Dollars in millions (unaudited). Aftermarket Revenue – YTD 2012 Foremarket 69% Aftermarket 31% Geographic Exposure – YTD 2012 Developed Economies 55% Emerging Markets 45% QTD YTD Existing Businesses 14.6 % 14.4 % Acquisitions 1.2 % 3.8 % FX Translation (5.9)% (5.2)% Total Growth 9.9 % 13.0 %
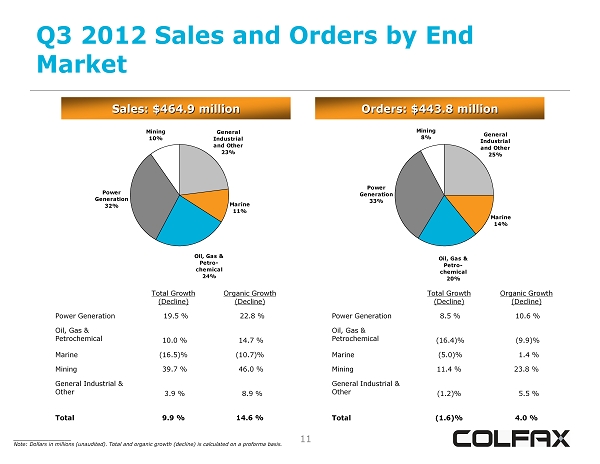
11 Q3 2012 Sales and Orders by End Market 11 Sales: $464.9 million Orders: $443.8 million Total Growth (Decline) Organic Growth (Decline) Power Generation 19.5 % 22.8 % Oil, Gas & Petrochemical 10.0 % 14.7 % Marine (16.5)% (10.7)% Mining 39.7 % 46.0 % General Industrial & Other 3.9 % 8.9 % Total 9.9 % 14.6 % Power Generation 33% Marine 14% Mining 8% Oil, Gas & Petro- chemical 20% General Industrial and Other 25% Total Growth (Decline) Organic Growth (Decline) Power Generation 8.5 % 10.6 % Oil, Gas & Petrochemical (16.4)% (9.9)% Marine (5.0)% 1.4 % Mining 11.4 % 23.8 % General Industrial & Other (1.2)% 5.5 % Total (1.6)% 4.0 % __________________ Note: Dollars in millions (unaudited). Total and organic growth (decline) is calculated on a proforma basis. Power Generation 32% Marine 11% Mining 10% Oil, Gas & Petro- chemical 24% General Industrial and Other 23%

12 YTD 2012 Sales and Orders by End Market 12 Sales: $1,386.7 million Orders: $1,475.7 million Total Growth (Decline) Organic Growth (Decline) Power Generation 20.0 % 22.1% Oil, Gas & Petrochemical 18.6 % 13.0% Marine (11.9)% (7.1)% Mining 36.3 % 43.0 % General Industrial & Other 7.2 % 10.6 % Total 13.0 % 14.4 % Total Growth (Decline) Organic Growth (Decline) Power Generation 16.4 % 18.5 % Oil, Gas & Petrochemical 0.6 % (12.4)% Marine (3.7)% 1.6 % Mining (3.1)% 4.8 % General Industrial & Other (3.2)% 0.2 % Total 3.5 % 3.1 % __________________ Note: Dollars in millions (unaudited). Total and organic growth (decline) is calculated on a proforma basis. Power Generation 31% Marine 12% Mining 9% Oil, Gas & Petro- chemical 25% General Industrial and Other 23% Power Generation 34% Marine 11% Mining 9% Oil, Gas & Petro- chemical 24% General Industrial and Other 22%
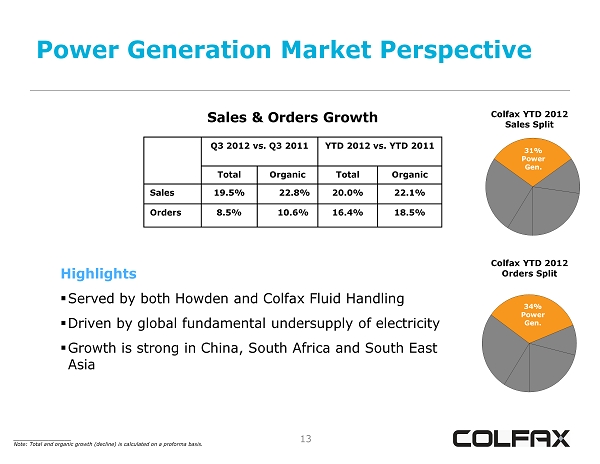
13 Power Generation Market Perspective 13 Sales & Orders Growth Q3 2012 vs. Q3 2011 YTD 2012 vs. YTD 2011 Total Organic Total Organic Sales 19.5% 22.8% 20.0% 22.1% Orders 8.5% 10.6% 16.4% 18.5% Colfax YTD 2012 Sales Split 31% Power Gen. Colfax YTD 2012 Orders Split Highlights ▪ Served by both Howden and Colfax Fluid Handling ▪ Driven by global fundamental undersupply of electricity ▪ Growth is strong in China, South Africa and South East Asia 34% Power Gen. __________________ Note: Total and organic growth (decline) is calculated on a proforma basis.

14 Oil, Gas & Petrochemical Market Perspective 14 Sales & Orders Growth (Decline) Colfax YTD 2012 Sales Split 25% OG&P Colfax YTD 2012 Orders Split 24% OG&P Highlights ▪ Served by both Howden and Colfax Fluid Handling ▪ National oil companies in Latin America and Russia expanding production and refinery capacity ▪ Thomassen compressor acquisition increases presence in this market __________________ Note: Total and organic growth (decline) is calculated on a proforma basis. Q3 2012 vs. Q3 2011 YTD 2012 vs. YTD 2011 Total Organic Total Organic Sales 10.0% 14.7% 18.6% 13.0% Orders (16.4)% (9.9)% 0.6% (12.4)%

15 Marine Market Perspective 15 Sales & Orders (Decline) Growth Colfax YTD 2012 Sales Split 12% Marine Colfax YTD 2012 Orders Split Highlights ▪ Comprised of commercial marine and government, or defense, customers ▪ Primarily served by Colfax Fluid Handling ▪ New ship build is down from 2011 peak ▪ Q3 orders strong for supply vessels 11% Marine __________________ Note: Total and organic growth (decline) is calculated on a proforma basis. Q3 2012 vs. Q3 2011 YTD 2012 vs. YTD 2011 Total Organic Total Organic Sales (16.5)% (10.7)% (11.9)% (7.1)% Orders (5.0)% 1.4% (3.7)% 1.6 %
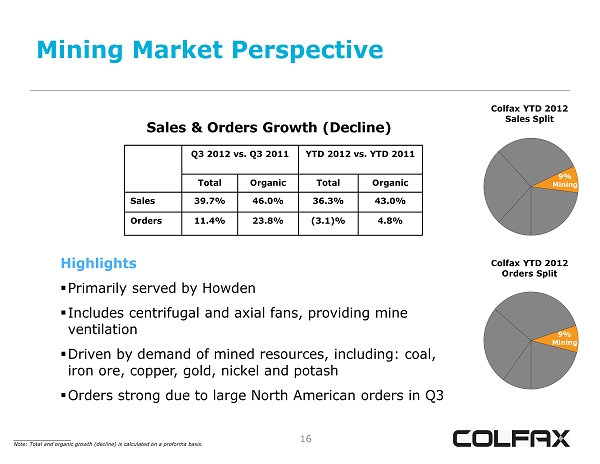
16 Mining Market Perspective 16 Sales & Orders Growth (Decline) Colfax YTD 2012 Sales Split 9% Mining Colfax YTD 2012 Orders Split Highlights ▪ Primarily served by Howden ▪ Includes centrifugal and axial fans, providing mine ventilation ▪ Driven by demand of mined resources, including: coal, iron ore, copper, gold, nickel and potash ▪ Orders strong due to large North American orders in Q3 9% Mining __________________ Note: Total and organic growth (decline) is calculated on a proforma basis. Q3 2012 vs. Q3 2011 YTD 2012 vs. YTD 2011 Total Organic Total Organic Sales 39.7% 46.0% 36.3% 43.0% Orders 11.4% 23.8% (3.1)% 4.8%

17 General Industrial & Other Market Perspective 17 Sales & Orders Growth (Decline) Colfax YTD 2012 Sales Split 23% GI&O Colfax YTD 2012 Orders Split Highlights ▪ Includes both Howden and Colfax Fluid Handling ▪ Represents a variety of industrial fans and compressors, tunnel ventilation and pumps serving various industrial needs ▪ Sales and order growth was driven by industrial fans and compressors, particularly fans serving the steel industry 22% GI&O __________________ Note: Total and organic growth (decline) is calculated on a proforma basis. Q3 2012 vs. Q3 2011 YTD 2012 vs. YTD 2011 Total Organic Total Organic Sales 3.9% 8.9% 7.2% 10.6% Orders (1.2)% 5.5% (3.2)% 0.2%

18 18 Fabrication Technology

19 Fabrication Technology Q3 2012 Highlights • Net sales of $489.6 million compared to proforma net sales of $548.8 million in Q3 2011, a decrease of 10.8%; an organic decline of 2.2% • Adjusted segment operating income of $43.9 million and adjusted operating income margin of 9.0% • Tight cost control and improved pricing drove margin improvement • Continued sequential margin improvement in India despite challenging economic environment • Revenue and operating income negatively impacted by the start up of a new consumables facility in the U.S. 19

20 Fabrication Technology YTD 2012 Highlights • Net sales of $1.5 billion, a decrease of 4.0% compared to proforma YTD Q3 2011 sales; an organic increase of 3.3% • Adjusted segment operating income of $123.2 million and adjusted operating income margin of 8.2% • Higher consumable volumes in North America, the Middle East and South America 20

21 Revenue 21 Revenue (1) $548.8 $489.6 $1,562.5 $1,449.8 $0.0 $200.0 $400.0 $600.0 $800.0 $1,000.0 $1,200.0 $1,400.0 $1,600.0 Q3 2011 Q3 2012 YTD 2011 YTD 2012 (1) Q3 2011 and YTD 2011 sales are presented on a proforma basis. __________________ Note: Dollars in millions (unaudited). Revenue – YTD 2012 Equipment 26% Consumables 74% Geographic Exposure – YTD 2012 Developed Economies 42% Emerging Markets 58% QTD YTD Volume (0.8)% 2.2% Price/Mix (1.4)% 1.1% Acquisitions 0.0 % 0.4% FX Translation (8.6)% (7.7)% Total Decline (10.8)% (4.0)%

22 22 Results of Operations

23 Income Statement Summary (unaudited) 23 Refer to Appendix for Non - GAAP reconciliation and footnotes. __________________ Note: Dollars in millions, except per share amounts Three Months Ended September 28, 2012 September 30, 2011 Net sales $ 954.4 $ 170.3 Gross profit $ 288.0 $ 60.7 % of sales 30.2% 35.6% SG&A expense $ 217.1 $ 41.1 % of sales 22.7% 24.1% Adjusted operating income $ 85.3 $ 19.6 % of sales 8.9% 11.5% Adjusted net income $ 40.7 $ 13.2 % of sales 4.3% 7.8% Adjusted net income per share $ 0.33 $ 0.30

24 Income Statement Summary (unaudited) 24 Refer to Appendix for Non - GAAP reconciliation and footnotes. __________________ Note: Dollars in millions, except per share amounts Nine Months Ended September 28, 2012 September 30, 2011 Net sales $ 2,886.5 $ 515.6 Gross profit $ 844.6 $ 178.6 % of sales 29.3% 34.6% SG&A expense $ 661.2 $ 123.4 % of sales 22.9% 23.9% Adjusted operating income $ 245.9 $ 55.2 % of sales 8.5% 10.7% Adjusted net income $ 109.3 $ 35.2 % of sales 3.8% 6.8% Adjusted net income per share $ 0.92 $ 0.79

25 25 Appendix

26 Disclaimer 26 Colfax has provided financial information that has not been prepared in accordance with GAAP. These non - GAAP financial measures are adjusted net income, adjusted net income per share, projected adjusted net income per share, adjusted operating income, organic sales growth (decline) and organic order growth (decline). Adjusted net income, adjusted net income per share, projected adjusted net income per share and adjusted operating income exclude asbestos coverage litigation expense, expenses related to major restructuring programs or any additional structural changes announced in the future, expenses related to the Charter acquisition and significant year - one fair value adjustment amortization expense. The effective tax rates used to calculate adjusted net income and adjusted net income per share are 25.3% and 29.0% for the third quarter and nine months ended September 28, 2012, respectively, and 31% for both the third quarter and nine months ended September 30, 2011. Projected adjusted earnings per share was calculated using a 30% effective tax rate for the fourth quarter of 2012. Organic sales growth (decline) and organic order growth (decline) exclude the impact of bolt - on acquisitions and foreign exchange rate fluctuations and are presented on a proforma basis (the proforma comparison includes the 2011 sales and orders for Howden and ESAB, excluding the first 12 days of the year to date reporting period). These non - GAAP financial measures assist Colfax in comparing its operating performance on a consistent basis because, among other things, they remove the impact of asbestos insurance coverage issues, costs related to the Charter acquisition, major restructuring programs and items outside the control of its operating management. Sales and order information by end market are estimates. We periodically update our customer groupings order to refine these estimates.
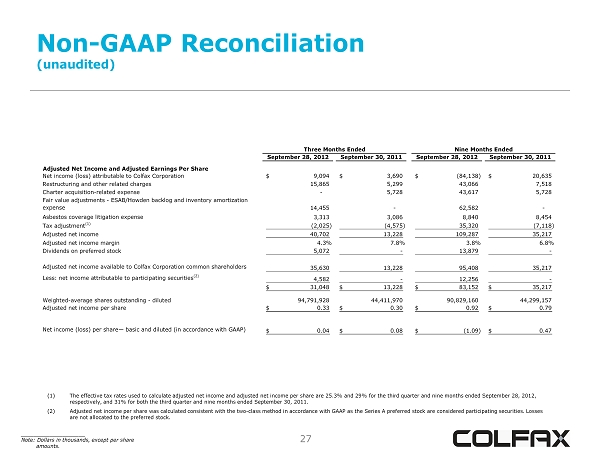
27 Non - GAAP Reconciliation (unaudited) ____________________ Note: Dollars in thousands, except per share amounts. (1) The effective tax rates used to calculate adjusted net income and adjusted net income per share are 25.3% and 29% for the thi rd quarter and nine months ended September 28, 2012, respectively, and 31% for both the third quarter and nine months ended September 30, 2011. (2) Adjusted net income per share was calculated consistent with the two - class method in accordance with GAAP as the Series A prefer red stock are considered participating securities. Losses are not allocated to the preferred stock. September 28, 2012 September 30, 2011 September 28, 2012 September 30, 2011 Adjusted Net Income and Adjusted Earnings Per Share Net income (loss) attributable to Colfax Corporation 9,094$ 3,690$ (84,138)$ 20,635$ Restructuring and other related charges 15,865 5,299 43,066 7,518 Charter acquisition-related expense - 5,728 43,617 5,728 Fair value adjustments - ESAB/Howden backlog and inventory amortization expense 14,455 - 62,582 - Asbestos coverage litigation expense 3,313 3,086 8,840 8,454 Tax adjustment (1) (2,025) (4,575) 35,320 (7,118) Adjusted net income 40,702 13,228 109,287 35,217 Adjusted net income margin 4.3% 7.8% 3.8% 6.8% Dividends on preferred stock 5,072 - 13,879 - Adjusted net income available to Colfax Corporation common shareholders 35,630 13,228 95,408 35,217 Less: net income attributable to participating securities (2) 4,582 - 12,256 - 31,048$ 13,228$ 83,152$ 35,217$ Weighted-average shares outstanding - diluted 94,791,928 44,411,970 90,829,160 44,299,157 Adjusted net income per share 0.33$ 0.30$ 0.92$ 0.79$ Net income (loss) per share— basic and diluted (in accordance with GAAP) 0.04$ 0.08$ (1.09)$ 0.47$ Nine Months EndedThree Months Ended

28 Non - GAAP Reconciliation (unaudited) ____________________ Note: Dollars in thousands. Net sales -$ -$ Operating income 32,361 7.0% 31,357 6.4% (12,052) 51,666 5.4% 15,471 9.1% (10,031) 5,440$ 3.2% Charter acquisition-related expense - - - - - 5,728 5,728 Restructuring and other related charges 1,564 12,498 1,803 15,865 5,299 - 5,299 Asbestos coverage litigation expense 3,313 - - 3,313 3,086 - 3,086 Fair value adjustments - ESAB/Howden backlog and inventory amortization expense 14,455 - - 14,455 - - - Adjusted operating income 51,693 11.1% 43,855 9.0% (10,249) 85,299 8.9% 23,856$ 14.0% (4,303)$ 19,553$ 11.5% Q3 2012 Q3 2011 Gas and Fluid Handling Fabrication Technology Corporate and Other Total Colfax Corporation Corporate and Other Total Colfax CorporationFluid Handling 954,440$ 170,294$ 170,294$ 464,873$ 489,567$

29 Non - GAAP Reconciliation (unaudited) ____________________ Note: Dollars in thousands. Net sales -$ -$ Operating income 93,467 6.7% 74,642 5.0% (80,268) 87,841 3.0% 54,861$ 10.6% (21,382)$ 33,479$ 6.5% Charter acquisition-related expense - - 43,617 43,617 - 5,728 5,728 Restructuring and other related charges 5,379 31,620 6,067 43,066 6,469 1,049 7,518 Asbestos coverage litigation expense 8,840 - - 8,840 8,454 - 8,454 Fair value adjustments - ESAB/Howden backlog and inventory amortization expense 45,597 16,985 - 62,582 - - - Adjusted operating income 153,283 11.1% 123,247 8.2% (30,584) 245,946 8.5% 69,784$ 13.5% (14,605)$ 55,179$ 10.7% YTD Q3 2012 Total Colfax Corporation Fluid Handling YTD Q3 2011 Total Colfax Corporation Corporate and Other Gas and Fluid Handling Fabrication Technology Corporate and Other 1,386,699$ 1,499,760$ 2,886,459$ 515,601$ 515,601$

30 Sales & Order Growth (unaudited) ____________________ Note: Dollars in millions. $ % $ % Proforma for the three months ended September 30, 2011 971.7$ 451.2$ Components of Change: Existing Businesses 49.5 5.1 % 18.0 4.0 % Acquisitions 5.3 0.5 % 4.2 0.9 % Foreign Currency Translation (72.1) (7.4)% (29.6) (6.5)% Total (17.3) (1.8)% (7.4) (1.6)% For the three months ended September 28, 2012 954.4$ 443.8$ $ % $ % $ % Proforma as of and for the nine months ended September 30, 2011 2,789.3$ 1,425.6$ 1,348.2$ Components of Change: Existing Businesses 228.7 8.2 % 44.4 3.1 % 70.0 5.2 % Acquisitions 52.3 1.9 % 78.3 5.5 % 12.2 0.9 % Foreign Currency Translation (183.8) (6.6)% (72.6) (5.1)% (51.3) (3.8)% Total 97.2 3.5 % 50.1 3.5 % 30.9 2.3 % As of and for the nine months ended September 28, 2012 2,886.5$ 1,475.7$ 1,379.1$ Sales Orders Backlog Sales Orders

31 Balance Sheet (unaudited) September 28, December 31, 2012 2011 ASSETS CURRENT ASSETS: Cash and cash equivalents $ 517,343 $ 75,108 Tradereceivables,lessallowancefordoubtfulaccountsof$8,920 and $2,578 882,867 117,475 Inventories, net 519,358 56,136 Other current assets 313,948 102,489 Total current assets 2,233,516 351,208 Property, plant and equipment, net 662,294 90,939 Goodwill 1,929,436 204,844 Intangible assets, net 745,583 41,029 Other assets 484,895 400,523 Total assets $ 6,055,724 $ 1,088,543 LIABILITIES AND SHAREHOLDERS’ EQUITY CURRENT LIABILITIES: Current portion of long-term debt $ 34,033 $10,000 Accounts payable 636,521 54,035 Accrued liabilities 550,060 176,007 Total current liabilities 1,220,614 240,042 Long-term debt, less current portion 1,659,070 101,518 Other liabilities 996,343 557,708 Total liabilities 3,876,027 899,268 Equity: Preferred stock, $0.001 par value; 20,000,000 and 10,000,000 shares authorized; 13,877,552 and none issued and outstanding 14 — Commonstock,$0.001parvalue;400,000,000and200,000,000 shares authorized; 93,977,842 and 43,697,570 issued and outstanding 94 44 Additional paid-in capital 2,191,064 415,527 Accumulated deficit (153,520) (55,503) Accumulated other comprehensive loss (81,141) (170,793) Total Colfax Corporation equity 1,956,511 189,275 Noncontrolling interest 223,186 — Total equity 2,179,697 189,275 Total liabilities and equity $ 6,055,724 $ 1,088,543
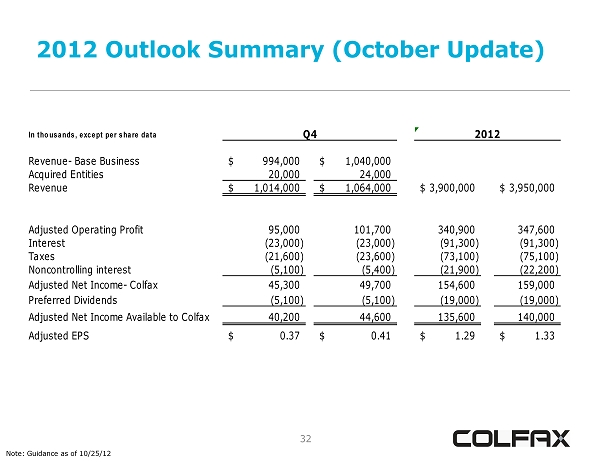
32 2012 Outlook Summary (October Update) Note: Guidance as of 10/25/12 In thousands, except per share data Revenue- Base Business 994,000$ 1,040,000$ Acquired Entities 20,000 24,000 Revenue 1,014,000$ 1,064,000$ 3,900,000$ 3,950,000$ Adjusted Operating Profit 95,000 101,700 340,900 347,600 Interest (23,000) (23,000) (91,300) (91,300) Taxes (21,600) (23,600) (73,100) (75,100) Noncontrolling interest (5,100) (5,400) (21,900) (22,200) Adjusted Net Income- Colfax 45,300 49,700 154,600 159,000 Preferred Dividends (5,100) (5,100) (19,000) (19,000) Adjusted Net Income Available to Colfax 40,200 44,600 135,600 140,000 Adjusted EPS 0.37$ 0.41$ 1.29$ 1.33$ Q4 2012

33 Non - GAAP Reconciliation (unaudited) Projected net loss per share - diluted $ 0.15 $ 0.19 $ (0.98) $ (0.94) Participating shares adjustment - - 0.13 0.13 Fair value adjustments - Charter inventory and backlog 0.15 0.15 0.78 0.78 Restructuring costs 0.07 0.07 0.48 0.48 Asbestos coverage litigation 0.02 0.02 0.11 0.11 Charter transaction costs - - 0.44 0.44 Tax adjustment (0.02) (0.02) 0.33 0.33 Projected adjusted net income per share - diluted $ 0.37 $ 0.41 $ 1.29 $ 1.33 2012 EPS Range Q4 Note: Guidance as of 10/25/12