Attached files
| file | filename |
|---|---|
| 8-K - FORM 8-K - AVIENT CORP | d427312d8k.htm |
Exhibit 99.1

NEWS RELEASE
FOR IMMEDIATE RELEASE
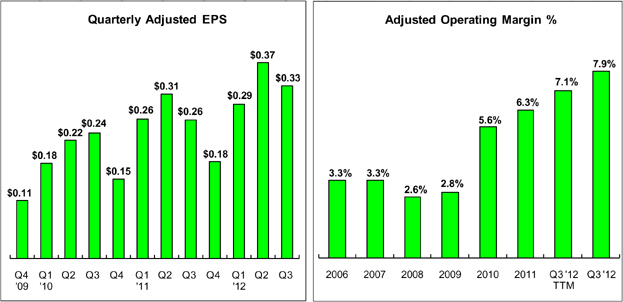
PolyOne Announces Strong Third Quarter 2012 Results
| • | Earnings per share of $0.27; earnings per share as adjusted of $0.33, a third quarter record and a 27% year-over-year increase |
| • | Expanded operating margins and operating profits in all business platforms |
| • | Mix improvement strategy drives margin expansion |
| • | Accelerating conference call to discuss third quarter earnings to 9:00 a.m. EDT Wednesday, October 24, which will also include discussion on the recently announced Spartech Corporation acquisition |
CLEVELAND – October 24, 2012 – PolyOne Corporation (NYSE: POL) today reported $740.2 million of revenues for the third quarter of 2012, compared to $735.8 million in the third quarter of 2011.
Diluted earnings per share totaled $0.27 in the third quarter of 2012 compared to $0.23 in the third quarter of 2011. Adjusted diluted earnings per share increased 27% to $0.33 for the third quarter of 2012, compared to $0.26 in the third quarter last year.
“I am very pleased with our record third quarter results, which marks PolyOne’s twelfth consecutive quarter of year-over-year double-digit adjusted earnings per share growth. Over the past three years, PolyOne has grown adjusted EPS more than twice the CAGR of the S&P 500,” said Stephen D. Newlin, chairman, president and chief executive officer. “We delivered record third quarter adjusted earnings per share, driven by our ongoing and successful mix improvement strategy.”
Commenting on the quarter, Mr. Newlin said, “This was an outstanding quarter on many dimensions, including earnings growth and organic operating margin expansion due to mix improvement, with all platforms contributing to this success. On-time delivery to our customers reached an all-time record level of 96%, as measured to their original requested date, while we successfully maintained world-class working capital levels. Innovation was a significant driver of mix improvement, as evidenced by record levels of our Specialty platform sales generated from products introduced in the past five years.”
“We ended the quarter with $249 million of cash as a result of excellent working capital management. This, coupled with $179 million of availability under our asset-based revolver, leaves us with ample liquidity to fund future growth initiatives and provide returns to shareholders through dividends and share buybacks,” added Richard J. Diemer, Jr., senior vice president and chief financial officer.
Commenting on the company’s outlook, Mr. Newlin said, “We are encouraged that the impact of the weaker European economy appears to be stabilizing, albeit at lower levels. Through the disciplined execution of our four pillar strategy, we expect to deliver double-digit adjusted earnings per share growth in the fourth quarter of 2012 over last year.”
The company recorded special items of $8.3 million ($5.3 million after tax; $0.06 per share) in the third quarter of 2012, the most significant of which related to environmental remediation. Special items of $4.8 million ($3.1 million after tax; $0.03 per share) in the third quarter of 2011 also related primarily to environmental remediation costs.
The company’s performance for the third quarter will be discussed on a conference call at 9:00 a.m. Eastern Daylight Time Wednesday, October 24. The call can be accessed by dialing 866-356-3377 (International: 617-597-5392) and entering Passcode 27155297, or via webcast at www.polyone.com/investor.
About PolyOne
PolyOne Corporation, with 2011 revenues of $2.9 billion, is a premier provider of specialized polymer materials, services and solutions. The company is dedicated to serving customers in diverse industries around the globe, by creating value through collaboration, innovation and an unwavering commitment to excellence. Guided by its Core Values, Sustainability Promise and No Surprises PledgeSM, PolyOne is committed to its customers, employees, communities and shareholders through ethical, sustainable and fiscally responsible principles. For more information, visit www.polyone.com.
# # #
2
To access PolyOne’s news library online, please visit www.polyone.com/news
Investor Relations Contact:
Cynthia D. Tomasch
Vice President, Planning & Investor Relations
PolyOne Corporation
+1 440-930-3155
cynthia.tomasch@polyone.com
Media Contact:
Kyle Rose Director, Corporate Communications
PolyOne Corporation
+1 440-930-3162
kyle.rose@polyone.com
3
Cautionary Note on Forward-Looking Statements
This document contains “forward-looking statements” within the meaning of the Private Securities Litigation Reform Act of 1995. In particular, statements in this document regarding the proposed acquisition of Spartech Corporation are forward-looking statements. Forward-looking statements give current expectations or forecasts of future events and are not guarantees of future performance. They are based on management’s expectations that involve a number of business risks and uncertainties, any of which could cause actual results to differ materially from those expressed in or implied by the forward-looking statements. They use words such as “will,” “anticipate,” “estimate,” “expect,” “project,” “intend,” “plan,” “believe,” and other words and terms of similar meaning in connection with any discussion of future operating or financial condition, performance and/or sales. Factors that could cause actual results to differ materially from those implied by these forward-looking statements include, but are not limited to: the time required to consummate the proposed acquisition; the satisfaction or waiver of conditions in the merger agreement; any material adverse changes in the business of Spartech Corporation; the ability to obtain required regulatory, shareholder or other third-party approvals and consents and otherwise consummate the proposed acquisition; our ability to achieve the strategic and other objectives relating to the proposed acquisition, including any expected synergies; our ability to successfully integrate Spartech Corporation and achieve the expected results of the acquisition, including, without limitation, the acquisition being accretive; disruptions, uncertainty or volatility in the credit markets that could adversely impact the availability of credit already arranged and the availability and cost of credit in the future; the financial condition of our customers, including the ability of customers (especially those that may be highly leveraged and those with inadequate liquidity) to maintain their credit availability; the speed and extent of an economic recovery, including the recovery of the housing market; our ability to achieve new business gains; the effect on foreign operations of currency fluctuations, tariffs, and other political, economic and regulatory risks; changes in polymer consumption growth rates where we conduct business; changes in global industry capacity or in the rate at which anticipated changes in industry capacity come online; fluctuations in raw material prices, quality and supply and in energy prices and supply; production outages or material costs associated with scheduled or unscheduled maintenance programs; unanticipated developments that could occur with respect to contingencies such as litigation and environmental matters; an inability to achieve or delays in achieving or achievement of less than the anticipated financial benefit from initiatives related to working capital reductions, cost reductions, and employee productivity goals; an inability to raise or sustain prices for products or services; an inability to maintain appropriate relations with unions and employees; the inability to achieve expected results from our acquisition activities; our ability to continue to pay cash dividends; the amount and timing of repurchases of our common shares, if any; and other factors affecting our business beyond our control, including, without limitation, changes in the general economy, changes in interest rates and changes in the rate of inflation. The above list of factors is not exhaustive.
We undertake no obligation to publicly update forward-looking statements, whether as a result of new information, future events or otherwise. You are advised to consult any further disclosures we make on related subjects in our reports on Form 10-Q, 8-K and 10-K that we provide to the Securities and Exchange Commission.
4
Additional Information
In connection with the proposed transaction between PolyOne Corporation and Spartech Corporation, a registration statement on Form S-4 will be filed with the SEC. SPARTECH CORPORATION STOCKHOLDERS ARE ENCOURAGED TO READ THE REGISTRATION STATEMENT AND ANY OTHER RELEVANT DOCUMENTS FILED WITH THE SEC, INCLUDING THE PROXY STATEMENT/PROSPECTUS THAT WILL BE PART OF THE REGISTRATION STATEMENT, WHEN THEY BECOME AVAILABLE, BECAUSE THEY WILL CONTAIN IMPORTANT INFORMATION ABOUT THE PROPOSED MERGER. The final proxy statement/prospectus will be mailed to stockholders of Spartech Corporation. Investors and security holders will be able to obtain the documents free of charge at the SEC’s website, www.sec.gov, from PolyOne at its website, www.polyone.com, or 33587 Walker Road, Avon Lake, Ohio 44012, Attention: Corporate Secretary, or from Spartech Corporation at its website, www.Spartech.com, or 120 S. Central Avenue, Suite 1700, Clayton, MO 63105, Attention: Corporate Secretary.
Participants in Solicitation
PolyOne and Spartech Corporation and their respective directors and executive officers may be deemed to be participants in the solicitation of proxies in respect of the proposed merger. Information concerning PolyOne’s participants is set forth in the proxy statement, dated March 23, 2012, for PolyOne’s 2012 Annual Meeting of Stockholders as filed with the SEC on Schedule 14A and PolyOne’s current reports on Form 8-K, as filed with the SEC on May 11, 2012 and September 25, 2012. Information concerning Spartech Corporation’s participants is set forth in the proxy statement, dated January 24, 2012, for Spartech Corporation’s 2012 Annual Meeting of Stockholders as filed with the SEC on Schedule 14A and Spartech Corporation’s current report on Form 8-K, as filed with the SEC on March 16, 2012. Additional information regarding the interests of participants of PolyOne and Spartech Corporation in the solicitation of proxies in respect of the proposed merger will be included in the registration statement and proxy statement/prospectus and other relevant materials to be filed with the SEC when they become available. This communication does not constitute an offer to sell or the solicitation of an offer to buy any securities, nor shall there be any sale of securities in any jurisdiction in which such offer, solicitation, or sale would be unlawful prior to registration or qualification under the securities laws of any such jurisdiction.
5
Attachment 1
Summary of Consolidated Statements of Income (Unaudited)
Third Quarter 2012
(In millions, except per share data)
| Three Months Ended September 30, |
Nine Months Ended September 30, |
|||||||||||||||
| 2012 | 2011 | 2012 | 2011 | |||||||||||||
| Sales |
$ | 740.2 | $ | 735.8 | $ | 2,313.3 | $ | 2,223.1 | ||||||||
| Operating income |
50.4 | 42.5 | 148.4 | 272.8 | ||||||||||||
| Net income |
24.0 | 21.6 | 68.8 | 160.3 | ||||||||||||
| Basic earnings per share |
$ | 0.27 | $ | 0.24 | $ | 0.77 | $ | 1.72 | ||||||||
| Diluted earnings per share |
$ | 0.27 | $ | 0.23 | $ | 0.76 | $ | 1.69 | ||||||||
Senior management uses comparisons of net income and diluted earnings per share (EPS) before adjustments to assess performance and facilitate comparability of results with prior periods. Below is a reconciliation of these non-GAAP financial measures to their most directly comparable measure calculated and presented in accordance with U.S. GAAP.
| Reconciliation to Consolidated Statements of Income | Three Months
Ended September 30, 2012 |
Three Months Ended September 30, 2011 |
||||||||||||||
| $ | EPS | $ | EPS | |||||||||||||
| Net income |
$ | 24.0 | $ | 0.27 | $ | 21.6 | $ | 0.23 | ||||||||
| Special items, after tax (Attachment 2) |
5.3 | 0.06 | 3.1 | 0.03 | ||||||||||||
| Tax adjustments (a) |
0.1 | — | (0.3 | ) | — | |||||||||||
|
|
|
|
|
|
|
|
|
|||||||||
| Adjusted net income / EPS |
$ | 29.4 | $ | 0.33 | $ | 24.4 | $ | 0.26 | ||||||||
|
|
|
|
|
|
|
|
|
|||||||||
| Reconciliation to Consolidated Statements of Income | Nine Months
Ended September 30, 2012 |
Nine Months Ended September 30, 2011 |
||||||||||||||
| $ | EPS | $ | EPS | |||||||||||||
| Net income |
$ | 68.8 | $ | 0.76 | $ | 160.3 | $ | 1.69 | ||||||||
| SunBelt equity income, after tax |
— | — | (3.7 | ) | (0.04 | ) | ||||||||||
| Special items, after-tax (Attachment 2) |
19.4 | 0.22 | (75.8 | ) | (0.80 | ) | ||||||||||
| Tax adjustments (a) |
1.1 | 0.01 | (1.4 | ) | (0.02 | ) | ||||||||||
|
|
|
|
|
|
|
|
|
|||||||||
| Adjusted net income / EPS |
$ | 89.3 | $ | 0.99 | $ | 79.4 | $ | 0.83 | ||||||||
|
|
|
|
|
|
|
|
|
|||||||||
| (a) | Tax adjustments include the net tax loss (benefit) from one-time income tax items and deferred income tax valuation allowance adjustments. |
6
Attachment 2
PolyOne Corporation
Summary of Special Items (Unaudited)
(In millions, except per share data)
| Special items (1): | Three Months Ended September 30, |
Nine Months Ended September 30, |
||||||||||||||
| 2012 | 2011 | 2012 | 2011 | |||||||||||||
| Cost of sales |
||||||||||||||||
| Employee separation and plant phaseout costs |
$ | — | $ | (0.6 | ) | $ | (0.4 | ) | $ | (1.1 | ) | |||||
| Reimbursement of previously incurred environmental costs |
— | 1.3 | — | 3.2 | ||||||||||||
| Environmental remediation costs |
(5.2 | ) | (4.8 | ) | (9.7 | ) | (7.9 | ) | ||||||||
| Acquisition related costs |
— | — | (5.4 | ) | (0.1 | ) | ||||||||||
|
|
|
|
|
|
|
|
|
|||||||||
| Impact on cost of sales |
(5.2 | ) | (4.1 | ) | (15.5 | ) | (5.9 | ) | ||||||||
| Selling and administrative expense |
||||||||||||||||
| Employee separation and plant phaseout costs |
(1.3 | ) | (0.5 | ) | (10.1 | ) | (0.7 | ) | ||||||||
| Legal related costs |
(0.3 | ) | (0.1 | ) | (0.9 | ) | (0.9 | ) | ||||||||
| Unrealized loss on foreign currency option contracts |
(0.8 | ) | — | (0.6 | ) | — | ||||||||||
| Acquisition related costs |
(0.7 | ) | (0.2 | ) | (1.9 | ) | (1.1 | ) | ||||||||
|
|
|
|
|
|
|
|
|
|||||||||
| Impact on selling and administrative expense |
(3.1 | ) | (0.8 | ) | (13.5 | ) | (2.7 | ) | ||||||||
| Gain on sale of investment in SunBelt |
— | — | 0.4 | 128.2 | ||||||||||||
|
|
|
|
|
|
|
|
|
|||||||||
| Impact on operating income |
(8.3 | ) | (4.9 | ) | (28.6 | ) | 119.6 | |||||||||
| Other income (expense), net |
||||||||||||||||
| Gain on sale of investment in O’Sullivan |
— | — | — | 0.5 | ||||||||||||
| Royalty income |
— | 0.1 | — | 1.4 | ||||||||||||
|
|
|
|
|
|
|
|
|
|||||||||
| Impact on other income (expense), net |
— | 0.1 | — | 1.9 | ||||||||||||
| Impact on income before income tax |
(8.3 | ) | (4.8 | ) | (28.6 | ) | 121.5 | |||||||||
| Income tax benefit (expense) on special items |
3.0 | 1.7 | 9.2 | (45.7 | ) | |||||||||||
|
|
|
|
|
|
|
|
|
|||||||||
| Impact of special items on net income |
$ | (5.3 | ) | $ | (3.1 | ) | $ | (19.4 | ) | $ | 75.8 | |||||
|
|
|
|
|
|
|
|
|
|||||||||
| Basic impact per common share |
$ | (0.06 | ) | $ | (0.03 | ) | $ | (0.22 | ) | $ | 0.81 | |||||
| Diluted impact per common share |
$ | (0.06 | ) | $ | (0.03 | ) | $ | (0.22 | ) | $ | 0.80 | |||||
| Weighted average shares used to compute earnings per share: |
||||||||||||||||
| Basic |
88.8 | 91.8 | 89.0 | 93.0 | ||||||||||||
| Diluted |
90.2 | 94.0 | 90.1 | 95.1 | ||||||||||||
| (1) | Special items is a non-GAAP financial measure. Special items include charges related to specific strategic initiatives or financial restructurings such as: consolidation of operations; debt extinguishment costs; employee separation costs resulting from personnel reduction programs, plant phaseout costs, executive separation agreements; asset impairments; mark-to-market adjustments associated with actuarial gains and losses on pension and other postretirement benefit plans; environmental remediation costs, fines or penalties for facilities no longer owned or closed in prior years; gains and losses on the divestiture of operating businesses, joint ventures and equity investments; gains and losses on facility or property sales or disposals; results of litigation, fines or penalties, where such litigation (or action relating to the fines or penalties) arose prior to the commencement of the performance period; acquisition related costs incurred directly in connection with potential or completed acquisitions; unrealized gains and losses from foreign currency option contracts; other one-time, non-recurring items; and the effect of changes in tax law, accounting principles or other such laws or provisions affecting reported results. |
7
Attachment 3
PolyOne Corporation
Consolidated Statements of Income (Unaudited)
(In millions, except per share data)
| Three Months Ended September 30, |
Nine Months Ended September 30, |
|||||||||||||||
| 2012 | 2011 | 2012 | 2011 | |||||||||||||
| Sales |
$ | 740.2 | $ | 735.8 | $ | 2,313.3 | $ | 2,223.1 | ||||||||
| Cost of sales |
597.5 | 621.8 | 1,875.2 | 1,857.2 | ||||||||||||
|
|
|
|
|
|
|
|
|
|||||||||
| Gross margin |
142.7 | 114.0 | 438.1 | 365.9 | ||||||||||||
| Selling and administrative expense |
92.3 | 71.5 | 290.1 | 227.0 | ||||||||||||
| Income related to previously owned equity affiliates |
— | — | 0.4 | 133.9 | ||||||||||||
|
|
|
|
|
|
|
|
|
|||||||||
| Operating income |
50.4 | 42.5 | 148.4 | 272.8 | ||||||||||||
| Interest expense, net |
(12.4 | ) | (8.3 | ) | (37.1 | ) | (25.2 | ) | ||||||||
| Other (expense) income, net |
(0.4 | ) | (0.9 | ) | (2.7 | ) | 0.5 | |||||||||
|
|
|
|
|
|
|
|
|
|||||||||
| Income before income taxes |
37.6 | 33.3 | 108.6 | 248.1 | ||||||||||||
| Income tax expense |
(13.6 | ) | (11.7 | ) | (39.8 | ) | (87.8 | ) | ||||||||
|
|
|
|
|
|
|
|
|
|||||||||
| Net income |
$ | 24.0 | $ | 21.6 | $ | 68.8 | $ | 160.3 | ||||||||
| Less: Net income attributable to noncontrolling interests |
— | — | — | — | ||||||||||||
|
|
|
|
|
|
|
|
|
|||||||||
| Net income attributable to PolyOne common shareholders |
$ | 24.0 | $ | 21.6 | $ | 68.8 | $ | 160.3 | ||||||||
|
|
|
|
|
|
|
|
|
|||||||||
| Earnings per common share: |
||||||||||||||||
| Basic earnings |
$ | 0.27 | $ | 0.24 | $ | 0.77 | $ | 1.72 | ||||||||
| Diluted earnings |
$ | 0.27 | $ | 0.23 | $ | 0.76 | $ | 1.69 | ||||||||
| Cash dividends declared per common share |
$ | 0.05 | $ | 0.04 | $ | 0.15 | $ | 0.12 | ||||||||
| Weighted-average shares used to compute earnings per share: |
||||||||||||||||
| Basic |
88.8 | 91.8 | 89.0 | 93.0 | ||||||||||||
| Diluted |
90.2 | 94.0 | 90.1 | 95.1 | ||||||||||||
8
Attachment 4
PolyOne Corporation
Condensed Consolidated Balance Sheets
(In millions)
| (Unaudited) | ||||||||
| September 30, | December 31, | |||||||
| 2012 | 2011 | |||||||
| Assets |
||||||||
| Current assets: |
||||||||
| Cash and cash equivalents |
$ | 248.7 | $ | 191.9 | ||||
| Accounts receivable, net |
374.7 | 321.0 | ||||||
| Inventories, net |
256.2 | 243.3 | ||||||
| Other current assets |
51.4 | 84.5 | ||||||
|
|
|
|
|
|||||
| Total current assets |
931.0 | 840.7 | ||||||
| Property, net |
380.7 | 397.6 | ||||||
| Goodwill |
398.0 | 398.1 | ||||||
| Other intangible assets, net |
332.3 | 341.9 | ||||||
| Other non-current assets |
114.1 | 103.2 | ||||||
|
|
|
|
|
|||||
| Total assets |
$ | 2,156.1 | $ | 2,081.5 | ||||
|
|
|
|
|
|||||
| Liabilities and Shareholders’ Equity |
||||||||
| Current liabilities: |
||||||||
| Current portion of long-term debt |
$ | 3.0 | $ | 3.0 | ||||
| Accounts payable |
324.3 | 294.8 | ||||||
| Accrued expenses |
141.0 | 144.6 | ||||||
|
|
|
|
|
|||||
| Total current liabilities |
468.3 | 442.4 | ||||||
| Non-current liabilities: |
||||||||
| Long-term debt |
702.2 | 704.0 | ||||||
| Post-retirement benefits other than pensions |
18.4 | 18.9 | ||||||
| Pension benefits |
186.7 | 203.6 | ||||||
| Other non-current liabilities |
148.8 | 124.3 | ||||||
|
|
|
|
|
|||||
| Total non-current liabilities |
1,056.1 | 1,050.8 | ||||||
| Shareholders’ equity: |
||||||||
| PolyOne shareholders’ equity |
629.3 | 588.3 | ||||||
| Noncontrolling interests |
2.4 | — | ||||||
|
|
|
|
|
|||||
| Total Equity |
631.7 | 588.3 | ||||||
|
|
|
|
|
|||||
| Total liabilities and shareholders’ equity |
$ | 2,156.1 | $ | 2,081.5 | ||||
|
|
|
|
|
|||||
9
Attachment 5
PolyOne Corporation
Consolidated Statements of Cash Flows (Unaudited)
(In millions)
| Nine Months Ended | ||||||||
| September 30, | ||||||||
| 2012 | 2011 | |||||||
| Operating Activities |
||||||||
| Net income |
$ | 68.8 | $ | 160.3 | ||||
| Adjustments to reconcile net income to net cash provided (used) by operating activities: |
||||||||
| Depreciation and amortization |
52.8 | 42.4 | ||||||
| Deferred income tax provision |
15.0 | 35.5 | ||||||
| Provision for doubtful accounts |
0.7 | 1.8 | ||||||
| Stock compensation expense |
7.8 | 4.0 | ||||||
| Income related to previously owned equity affiliates |
(0.4 | ) | (133.9 | ) | ||||
| Change in assets and liabilities: |
||||||||
| Increase in accounts receivable |
(54.3 | ) | (69.6 | ) | ||||
| Increase in inventories |
(13.3 | ) | (21.9 | ) | ||||
| Increase in accounts payable |
29.7 | 59.2 | ||||||
| Decrease in pensions and other post-retirement benefits |
(30.6 | ) | (31.0 | ) | ||||
| Increase (decrease) in accrued expenses and other |
10.7 | (27.6 | ) | |||||
|
|
|
|
|
|||||
| Net cash provided by operating activities |
86.9 | 19.2 | ||||||
| Investing Activities |
||||||||
| Capital expenditures |
(33.0 | ) | (32.1 | ) | ||||
| Business acquisitions, net of cash acquired |
— | (21.8 | ) | |||||
| Proceeds from sale of equity affiliate and other assets |
18.9 | 139.6 | ||||||
|
|
|
|
|
|||||
| Net cash (used) provided by investing activities |
(14.1 | ) | 85.7 | |||||
| Financing Activities |
||||||||
| Repayment of long-term debt |
(2.3 | ) | (20.0 | ) | ||||
| Purchase of common stock for treasury |
(15.9 | ) | (52.6 | ) | ||||
| Exercise of stock options and awards |
11.7 | 6.4 | ||||||
| Cash dividends paid |
(12.5 | ) | (7.5 | ) | ||||
| Proceeds from noncontrolling interests |
2.4 | — | ||||||
|
|
|
|
|
|||||
| Net cash used by financing activities |
(16.6 | ) | (73.7 | ) | ||||
| Effect of exchange rate changes on cash |
0.6 | 0.5 | ||||||
|
|
|
|
|
|||||
| Increase in cash and cash equivalents |
56.8 | 31.7 | ||||||
| Cash and cash equivalents at beginning of period |
191.9 | 378.1 | ||||||
|
|
|
|
|
|||||
| Cash and cash equivalents at end of period |
$ | 248.7 | $ | 409.8 | ||||
|
|
|
|
|
|||||
10
Attachment 6
Business Segment and Platform Operations (Unaudited)
(In millions)
Operating income at the segment level does not include: special items as defined on Attachment 2; corporate general and administration costs that are not allocated to segments; intersegment sales and profit eliminations; share-based compensation costs; and certain other items that are not included in the measure of segment profit and loss that is reported to and reviewed by the chief operating decision maker. These costs are included in Corporate and eliminations.
| Three Months Ended | Nine Months Ended | |||||||||||||||
| September 30, | September 30, | |||||||||||||||
| 2012 | 2011 | 2012 | 2011 | |||||||||||||
| Sales: |
||||||||||||||||
| Global Specialty Engineered Materials |
$ | 136.6 | $ | 147.5 | $ | 417.5 | $ | 446.9 | ||||||||
| Global Color, Additives and Inks |
172.6 | 138.2 | 547.6 | 424.8 | ||||||||||||
|
|
|
|
|
|
|
|
|
|||||||||
| Specialty Platform |
309.2 | 285.7 | 965.1 | 871.7 | ||||||||||||
| Performance Products and Solutions |
207.5 | 226.4 | 653.8 | 676.5 | ||||||||||||
| PolyOne Distribution |
254.4 | 255.0 | 788.0 | 767.5 | ||||||||||||
| Corporate and eliminations |
(30.9 | ) | (31.3 | ) | (93.6 | ) | (92.6 | ) | ||||||||
|
|
|
|
|
|
|
|
|
|||||||||
| Sales |
$ | 740.2 | $ | 735.8 | $ | 2,313.3 | $ | 2,223.1 | ||||||||
|
|
|
|
|
|
|
|
|
|||||||||
| Gross margin: |
||||||||||||||||
| Global Specialty Engineered Materials |
$ | 33.9 | $ | 30.7 | $ | 99.7 | $ | 98.8 | ||||||||
| Global Color, Additives and Inks |
53.9 | 34.7 | 171.5 | 107.6 | ||||||||||||
|
|
|
|
|
|
|
|
|
|||||||||
| Specialty Platform |
87.8 | 65.4 | 271.2 | 206.4 | ||||||||||||
| Performance Products and Solutions |
34.0 | 28.8 | 100.5 | 90.0 | ||||||||||||
| PolyOne Distribution |
27.7 | 25.3 | 85.7 | 79.0 | ||||||||||||
| Corporate and eliminations |
(6.8 | ) | (5.5 | ) | (19.3 | ) | (9.5 | ) | ||||||||
|
|
|
|
|
|
|
|
|
|||||||||
| Gross margin |
$ | 142.7 | $ | 114.0 | $ | 438.1 | $ | 365.9 | ||||||||
|
|
|
|
|
|
|
|
|
|||||||||
| Selling and administrative expense: |
||||||||||||||||
| Global Specialty Engineered Materials |
$ | (20.9 | ) | $ | (19.7 | ) | $ | (62.1 | ) | $ | (61.1 | ) | ||||
| Global Color, Additives and Inks |
(37.3 | ) | (23.8 | ) | (115.5 | ) | (72.9 | ) | ||||||||
|
|
|
|
|
|
|
|
|
|||||||||
| Specialty Platform |
(58.2 | ) | (43.5 | ) | (177.6 | ) | (134.0 | ) | ||||||||
| Performance Products and Solutions |
(13.2 | ) | (12.1 | ) | (39.6 | ) | (37.7 | ) | ||||||||
| PolyOne Distribution |
(11.3 | ) | (11.2 | ) | (35.9 | ) | (34.9 | ) | ||||||||
| Corporate and eliminations |
(9.6 | ) | (4.7 | ) | (37.0 | ) | (20.4 | ) | ||||||||
|
|
|
|
|
|
|
|
|
|||||||||
| Selling and administrative expense |
$ | (92.3 | ) | $ | (71.5 | ) | $ | (290.1 | ) | $ | (227.0 | ) | ||||
|
|
|
|
|
|
|
|
|
|||||||||
| Operating income: |
||||||||||||||||
| Global Specialty Engineered Materials |
$ | 13.1 | $ | 11.0 | $ | 37.6 | $ | 37.7 | ||||||||
| Global Color, Additives and Inks |
16.5 | 10.9 | 56.0 | 34.7 | ||||||||||||
|
|
|
|
|
|
|
|
|
|||||||||
| Specialty Platform |
29.6 | 21.9 | 93.6 | 72.4 | ||||||||||||
| Performance Products and Solutions |
20.8 | 16.7 | 60.9 | 52.3 | ||||||||||||
| PolyOne Distribution |
16.4 | 14.1 | 49.8 | 44.1 | ||||||||||||
| Corporate and eliminations |
(16.4 | ) | (10.2 | ) | (55.9 | ) | 104.0 | |||||||||
|
|
|
|
|
|
|
|
|
|||||||||
| Operating income |
$ | 50.4 | $ | 42.5 | $ | 148.4 | $ | 272.8 | ||||||||
|
|
|
|
|
|
|
|
|
|||||||||
Specialty Platform consists of our two specialty businesses: Global Specialty Engineered Materials; and Global Color, Additives and Inks. We present Specialty Platform sales, gross margin, selling and administration, and operating income because management believes that this is useful information to investors in highlighting our collective progress in advancing our specialization strategy.
11
Attachment 7
Reconciliation of Non-GAAP Financial Measures (Unaudited)
(In millions, except per share data)
Senior management uses gross margin before special items and operating income before special items to assess performance and allocate resources because senior management believes that these measures are useful in understanding current profitability levels and that current levels may serve as a base for future performance. In addition, operating income before the effect of special items is a component of various PolyOne annual and long-term employee incentive plans and is used in debt covenant computations. Below is a reconciliation of non-GAAP financial measures to the most directly comparable measures calculated and presented in accordance with U.S. GAAP. See Attachment 2 for a definition of special items.
Reconciliation to Consolidated Statements of Income
| Three Months Ended September 30, |
Nine Months Ended September 30, |
|||||||||||||||
| 2012 | 2011 | 2012 | 2011 | |||||||||||||
| Sales |
$ | 740.2 | $ | 735.8 | $ | 2,313.3 | $ | 2,223.1 | ||||||||
| Gross margin before special items |
$ | 147.9 | $ | 118.1 | $ | 453.6 | $ | 371.8 | ||||||||
| Special items in gross margin (Attachment 2) |
(5.2 | ) | (4.1 | ) | (15.5 | ) | (5.9 | ) | ||||||||
|
|
|
|
|
|
|
|
|
|||||||||
| Gross margin – GAAP |
$ | 142.7 | $ | 114.0 | $ | 438.1 | $ | 365.9 | ||||||||
|
|
|
|
|
|
|
|
|
|||||||||
| Gross margin before special items as a percent of sales |
20.0 | % | 16.1 | % | 19.6 | % | 16.7 | % | ||||||||
| Operating income adjusted |
$ | 58.7 | $ | 47.4 | $ | 177.0 | $ | 147.5 | ||||||||
| SunBelt equity income |
— | — | — | 5.7 | ||||||||||||
| Special items in operating income (Attachment 2) |
(8.3 | ) | (4.9 | ) | (28.6 | ) | 119.6 | |||||||||
|
|
|
|
|
|
|
|
|
|||||||||
| Operating income – GAAP |
$ | 50.4 | $ | 42.5 | $ | 148.4 | $ | 272.8 | ||||||||
|
|
|
|
|
|
|
|
|
|||||||||
Calculation of adjusted EPS
| 4Q09 | 1Q10 | 2Q10 | 3Q10 | 4Q10 | 1Q11 | |||||||||||||||||||
| Net income |
$ | 50.8 | $ | 21.0 | $ | 48.1 | $ | 3.6 | $ | 89.9 | $ | 110.2 | ||||||||||||
| SunBelt equity income, after tax |
(2.0 | ) | (0.5 | ) | (4.5 | ) | (6.1 | ) | (3.5 | ) | (3.7 | ) | ||||||||||||
| Special items, after tax |
(15.7 | ) | (0.3 | ) | (9.0 | ) | 21.8 | 3.3 | (79.8 | ) | ||||||||||||||
| Tax adjustments |
(22.3 | ) | (3.5 | ) | (13.1 | ) | 3.6 | (75.3 | ) | (1.5 | ) | |||||||||||||
|
|
|
|
|
|
|
|
|
|
|
|
|
|||||||||||||
| Adjusted net income |
$ | 10.8 | $ | 16.7 | $ | 21.5 | $ | 22.9 | $ | 14.4 | $ | 25.2 | ||||||||||||
|
|
|
|
|
|
|
|
|
|
|
|
|
|||||||||||||
| Adjusted EPS |
$ | 0.11 | $ | 0.18 | $ | 0.22 | $ | 0.24 | $ | 0.15 | $ | 0.26 | ||||||||||||
| Diluted shares used to calculate EPS |
94.4 | 95.3 | 96.3 | 96.3 | 97.4 | 96.4 | ||||||||||||||||||
Calculation of adjusted EPS
| 2Q11 | 3Q11 | 4Q11 | 1Q12 | 2Q12 | ||||||||||||||||
| Net income |
$ | 28.5 | $ | 21.6 | $ | 12.3 | $ | 20.2 | $ | 24.6 | ||||||||||
| Special items, after tax |
0.9 | 3.1 | 45.3 | 6.1 | 8.0 | |||||||||||||||
| Tax adjustments |
0.4 | (0.3 | ) | (40.9 | ) | 0.1 | 0.9 | |||||||||||||
|
|
|
|
|
|
|
|
|
|
|
|||||||||||
| Adjusted net income |
$ | 29.8 | $ | 24.4 | $ | 16.7 | $ | 26.4 | $ | 33.5 | ||||||||||
|
|
|
|
|
|
|
|
|
|
|
|||||||||||
| Adjusted EPS |
$ | 0.31 | $ | 0.26 | $ | 0.18 | $ | 0.29 | $ | 0.37 | ||||||||||
| Diluted shares used to calculate EPS |
95.5 | 94.0 | 91.9 | 90.7 | 90.7 | |||||||||||||||
12
Calculation of operating income (loss) adjusted as a percent of sales
| 2006 | 2007 | 2008 | 2009 | 2010 | 2011 | Q3 TTM | 3Q12 | |||||||||||||||||||||||||
| Sales |
$ | 2,622.4 | $ | 2,642.7 | $ | 2,738.7 | $ | 2,060.7 | $ | 2,621.9 | $ | 2863.5 | $ | 2953.6 | $ | 740.2 | ||||||||||||||||
| Operating income (loss) – GAAP |
$ | 233.6 | $ | 80.0 | $ | (291.4 | ) | $ | 137.1 | $ | 174.6 | $ | 233.0 | $ | 108.6 | $ | 50.4 | |||||||||||||||
| SunBelt and OxyVinyls equity income |
(107.0 | ) | (40.8 | ) | (32.5 | ) | (29.7 | ) | (23.1 | ) | (5.7 | ) | — | — | ||||||||||||||||||
| Special items in operating income |
(39.1 | ) | 47.8 | 396.2 | (48.7 | ) | (4.8 | ) | (46.7 | ) | 101.5 | 8.3 | ||||||||||||||||||||
|
|
|
|
|
|
|
|
|
|
|
|
|
|
|
|
|
|||||||||||||||||
| Operating income adjusted |
$ | 87.5 | $ | 87.0 | $ | 72.3 | $ | 58.7 | $ | 146.7 | $ | 180.6 | $ | 210.1 | $ | 58.7 | ||||||||||||||||
|
|
|
|
|
|
|
|
|
|
|
|
|
|
|
|
|
|||||||||||||||||
| Operating income adjusted as a percent of sales |
3.3 | % | 3.3 | % | 2.6 | % | 2.8 | % | 5.6 | % | 6.3 | % | 7.1 | % | 7.9 | % | ||||||||||||||||
Calculation of Q3 TTM sales, operating income, special items in operating income, and operating income adjusted
| 4Q11 | 1Q12 | 2Q12 | 3Q12 | Q3TTM | ||||||||||||||||
| Sales |
$ | 640.4 | $ | 781.0 | $ | 792.0 | $ | 740.2 | $ | 2,953.6 | ||||||||||
| Operating income – GAAP |
$ | (39.8 | ) | $ | 44.9 | $ | 53.1 | $ | 50.4 | $ | 108.6 | |||||||||
| Special items in operating income |
72.9 | 8.5 | 11.8 | 8.3 | 101.5 | |||||||||||||||
|
|
|
|
|
|
|
|
|
|
|
|||||||||||
| Operating income adjusted |
$ | 33.1 | $ | 53.4 | $ | 64.9 | $ | 58.7 | $ | 210.1 | ||||||||||
|
|
|
|
|
|
|
|
|
|
|
|||||||||||
Senior management uses net debt as a measure of our financial position. Below is a reconciliation of this non-GAAP financial measure to the most directly comparable measure calculated and presented in accordance with U.S. GAAP.
Reconciliation to Condensed Consolidated Balance Sheets
| (Unaudited) | ||||||||
| September 30, | December 31, | |||||||
| 2012 | 2011 | |||||||
| Current portion of long-term debt |
$ | 3.0 | $ | 3.0 | ||||
| Long-term debt |
702.2 | 704.0 | ||||||
| Less cash and cash equivalents |
(248.7 | ) | (191.9 | ) | ||||
|
|
|
|
|
|||||
| Net debt |
$ | 456.5 | $ | 515.1 | ||||
|
|
|
|
|
|||||
13