Attached files
| file | filename |
|---|---|
| 8-K - 8-K - MOLEX INC | d427438d8k.htm |
| EX-99.1 - EX-99.1 - MOLEX INC | d427438dex991.htm |
Exhibit 99.2
FY13 Q1 Conference Call October 23, 2012
Exhibit 99.2

Forward-Looking Statement Page 1 Statements in this release that are not historical are forward-looking and are subject to various risks and uncertainties that could cause actual results to vary materially from those stated. Words such as “expect,” “anticipate,” “outlook,” “forecast,” “could,” “project,” “intend,” “plan,” “continue,” “believe,” “seek,” “estimate,” “should,” “may,” “assume,” “potential,” variations of such words and similar expressions are used to identify these forward-looking statements. Forward-looking statements are based on currently available information and include, among others, the discussion under “Outlook.” These statements are not guarantees of future performance and involve certain risks, uncertainties and assumptions that are difficult to predict. Respective risks, uncertainties, and assumptions that could affect the outcome or results of operations are described in Part 1, Item 1A of our Annual Report on Form 10-K for the year ended June 30, 2012, which is incorporated by reference and in other reports that Molex files or furnishes with the Securities and Exchange Commission. We have based our forward-looking statements on our management’s beliefs and assumptions based on information available to management at the time the statements are made. We caution you that actual outcomes and results may differ materially from what is expressed, implied, or forecast by our forward-looking statements. Reference is made in particular to forward-looking statements regarding growth strategies, industry trends, global economic conditions, success of customers, cost of raw materials, value of inventory, availability of credit, foreign currency exchange rates, labor costs, protection of intellectual property, cost reduction initiatives, acquisition synergies, manufacturing strategies, product development introduction and sales, regulatory changes, competitive strengths, income tax fluctuations, natural disasters, unauthorized access to data, government investigations and outcomes of legal proceedings. Except as required under the federal securities laws, we do not have any intention or obligation to update publicly any forward-looking statements after the distribution of this report, whether as a result of new information, future events, changes in assumptions, or otherwise.
Non-GAAP Financial Measures
In Molex Incorporated’s (“Molex” or the “Company”) conference call on October 23, 2012 regarding the Company’s financial results for the first fiscal quarter ended September 30, 2012 and the following slides, Molex may refer to non- GAAP financial measures to describe earnings for such periods excluding the items referenced in the relevant slides used during this conference call. This is in addition to disclosing the most directly comparable measure for such periods determined in accordance with generally accepted accounting principles, or GAAP. Molex believes that these non-GAAP financial measures provide useful information to investors because they provide information about the estimated financial performance of Molex’s ongoing business and provide for greater transparency of supplemental information used by management in its financial and operational decision-making. These non-GAAP financial measures may be different from non-GAAP financial measures used by other companies. Non-GAAP financial measures should not be considered as a substitute for, or superior to, measures of financial performance prepared in accordance with GAAP. Investors are encouraged to review the relevant slides reconciling the non-GAAP financial measures intended to be used in the conference call to the most comparable GAAP measure. Page 2
FY13 Q1 Summary
New Product Introductions
Record Orders
Uncertain Macro Outlook
Affinity Medical
Customer Awards
Page 3
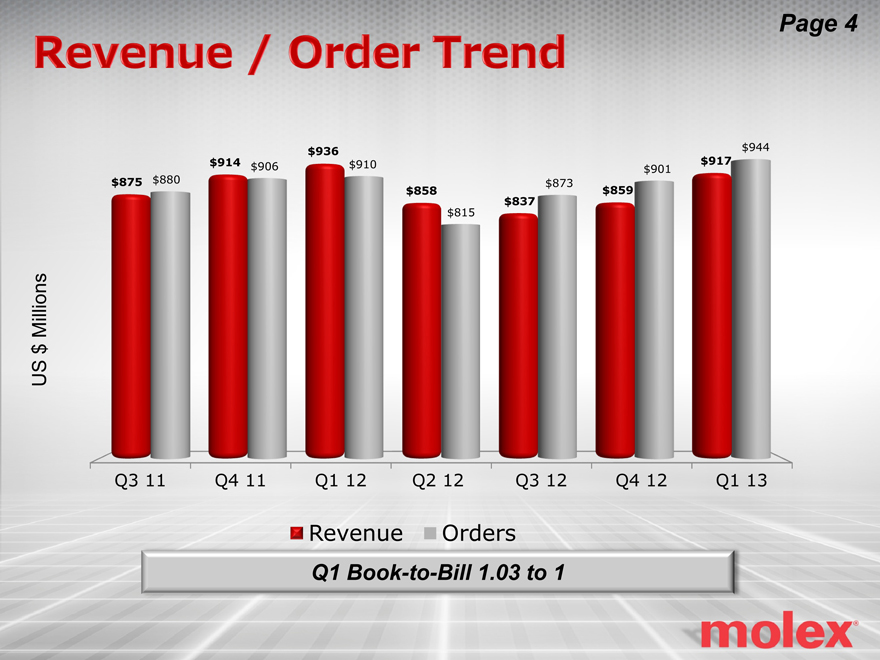
Revenue / Order Trend
US $ Millions
Q1 Book-to-Bill 1.03 to 1
Page 4
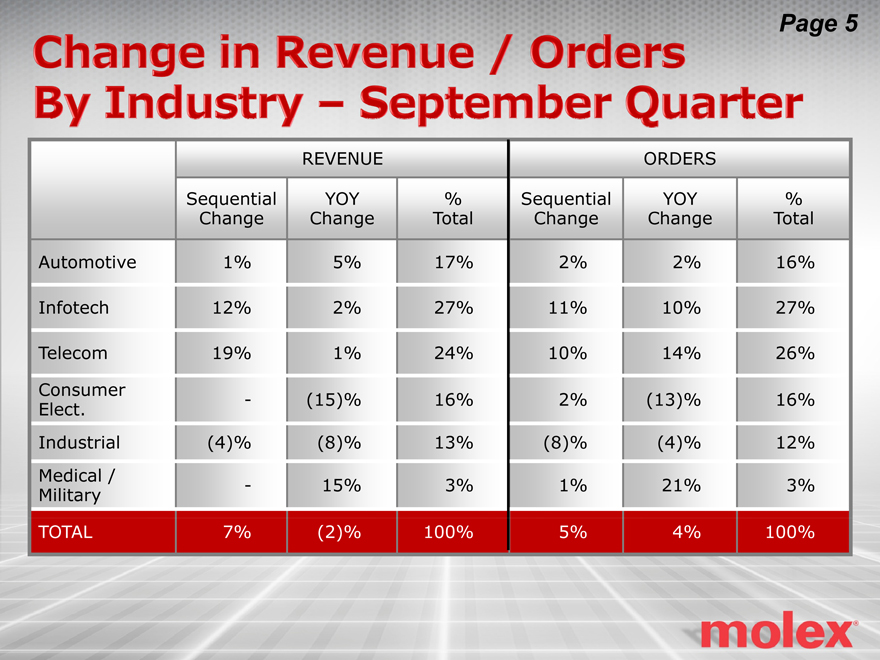
Change in Revenue / Orders By Industry – September Quarter
REVENUE REVENUE REVENUE ORDERS ORDERS ORDERS SequentialChange YOYChange % Total SequentialChange YOYChange %Total Automotive 1% 5% 17% 2% 2% 16% Infotech 12% 2% 27% 11% 10% 27% Telecom 19% 1% 24% 10% 14% 26% Consumer Elect.—(15)% 16% 2% (13)% 16% Industrial (4)% (8)% 13% (8)% (4)% 12% Medical / Military—15% 3% 1% 21% 3% TOTAL 7% (2)% 100% 5% 4% 100%
Page 5
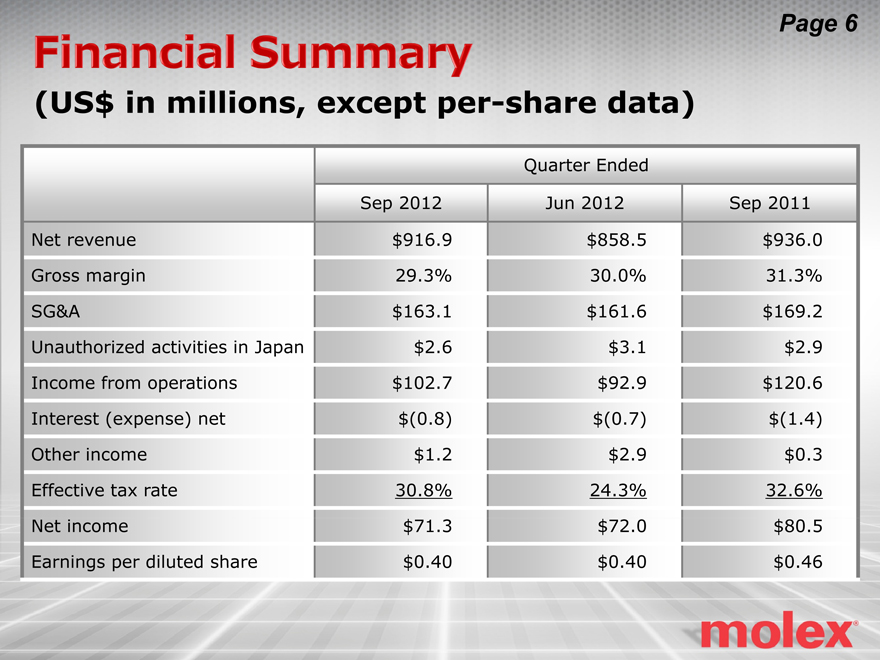
Financial Summary (US$ in millions, except per-share data)
Quarter Ended Quarter Ended Quarter Ended Sep 2012 Jun 2012 Sep 2011 Net revenue $916.9 $858.5 $936.0 Gross margin 29.3% 30.0% 31.3% SG&A $163.1 $161.6 $169.2 Unauthorized activities in Japan $2.6 $3.1 $2.9 Income from operations $102.7 $92.9 $120.6 Interest (expense) net $(0.8) $(0.7) $(1.4) Other income $1.2 $2.9 $0.3 Effective tax rate 30.8% 24.3% 32.6% Net income $71.3 $72.0 $80.5 Earnings per diluted share $0.40 $0.40 $0.46
Page 6
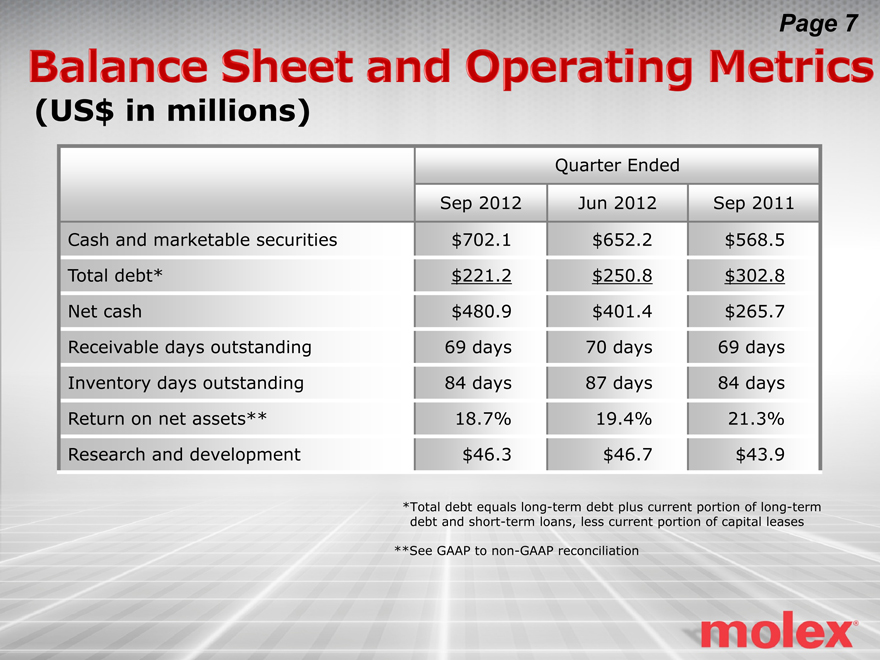
Balance Sheet and Operating Metrics (US$ in millions)
Quarter Ended Quarter Ended Quarter Ended Sep 2012 Jun 2012 Sep 2011 Cash and marketable securities $702.1 $652.2 $568.5 Total debt* $221.2 $250.8 $302.8 Net cash $480.9 $401.4 $265.7 Receivable days outstanding 69 days 70 days 69 days Inventory days outstanding 84 days 87 days 84 days Return on net assets** 18.7% 19.4% 21.3% Research and development $46.3 $46.7 $43.9 *Total debt equals long-term debt plus current portion of long-term debt and short-term loans, less current portion of capital leases **See GAAP to non-GAAP reconciliation
Page 7
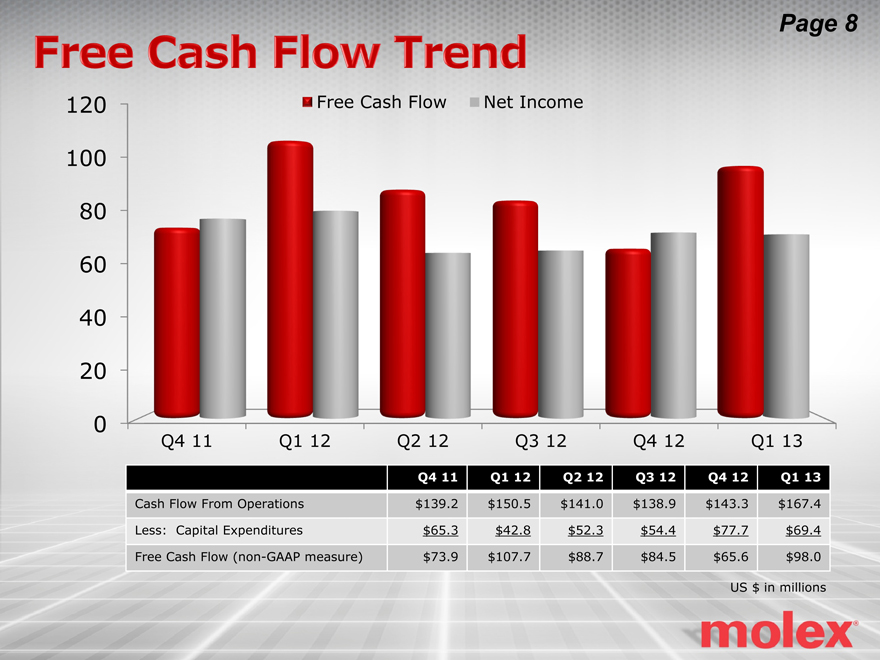
Free Cash Flow Trend
Q4 11 Q1 12 Q2 12 Q3 12 Q4 12 Q1 13 Cash Flow From Operations $139.2 $150.5 $141.0 $138.9 $143.3 $167.4 Less: Capital Expenditures $65.3 $42.8 $52.3 $54.4 $77.7 $69.4 Free Cash Flow (non-GAAP measure) $73.9 $107.7 $88.7 $84.5 $65.6 $98.0 US $ in millions
Page 8
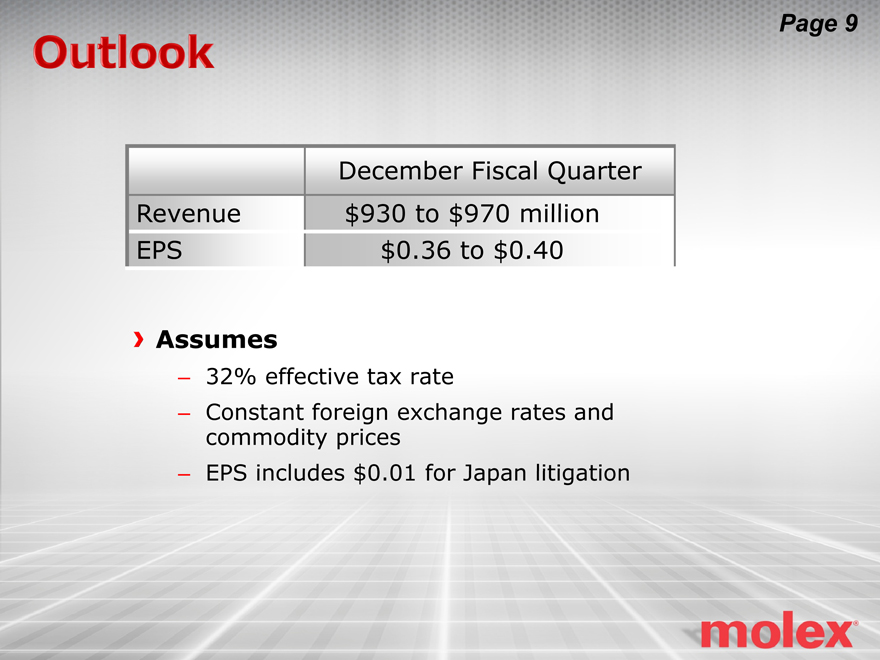
Outlook
December Fiscal Quarter Revenue $930 to $970 million EPS $0.36 to $0.40 Assumes 32% effective tax rate Constant foreign exchange rates and commodity prices EPS includes $0.01 for Japan litigation
Page 9

Molex one company a world of innovation
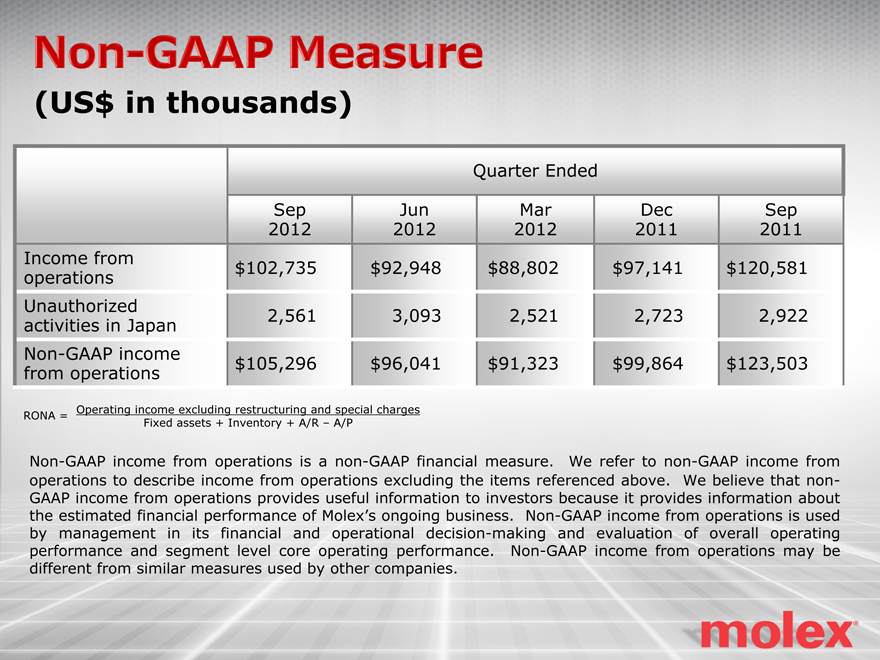
Non-GAAP Measure (US$ in thousands)
Quarter Ended Quarter Ended Quarter Ended Quarter Ended Quarter Ended Sep2012 Jun2012 Mar2012 Dec2011 Sep2011 Income from operations $102,735 $92,948 $88,802 $97,141 $120,581 Unauthorized activities in Japan 2,561 3,093 2,521 2,723 2,922 Non-GAAP income from operations $105,296 $96,041 $91,323 $99,864 $123,503 Non-GAAP income from operations is a non-GAAP financial measure. We refer to non-GAAP income from operations to describe income from operations excluding the items referenced above. We believe that non- GAAP income from operations provides useful information to investors because it provides information about the estimated financial performance of Molex’s ongoing business. Non-GAAP income from operations is used by management in its financial and operational decision-making and evaluation of overall operating performance and segment level core operating performance. Non-GAAP income from operations may be different from similar measures used by other companies. Operating income excluding restructuring and special charges Fixed assets + Inventory + A/R – A/P RONA =