Attached files
Exhibit 99.2
October 23, 2012 Third Quarter 2012 Conference Call
* Forward-Looking Statements This presentation contains forward-looking statements within the meaning of Section 27A of the Securities Act of 1933 and Section 21E of the Securities Exchange Act of 1934. All such statements, other than statements of historical fact, are “forward-looking statements” within the meaning of the Private Securities Litigation Reform Act of 1995, including, without limitation, any projections of financial items; the timing of the closing of our pipelay vessel sales; projections of contracting services activity; future production volumes, results of exploration, exploitation, development, acquisition and operations expenditures, and prospective reserve levels of properties or wells; projections of utilization; any statements of the plans, strategies and objectives of management for future operations; any statements concerning developments; any statements regarding future economic conditions or performance; any statements of expectation or belief; and any statements of assumptions underlying any of the foregoing. These statements involve certain assumptions we made based on our experience and perception of historical trends, current conditions, expected future developments and other factors we believe are reasonable and appropriate under the circumstances. The forward-looking statements are subject to a number of known and unknown risks, uncertainties and other factors that could cause our actual results to differ materially. The risks, uncertainties and assumptions referred to above include the performance of contracts by suppliers, customers and partners; delays, costs and difficulties related to the pipelay vessel sale; actions by governmental and regulatory authorities; operating hazards and delays; employee management issues; local, national and worldwide economic conditions; uncertainties inherent in the exploration for and development of oil and gas and in estimating reserves; complexities of global political and economic developments; geologic risks, volatility of oil and gas prices and other risks described from time to time in our reports filed with the Securities and Exchange Commission (“SEC”), including the Company’s most recently filed Annual Report on Form 10-K and in the Company’s other filings with the SEC. Free copies of the reports can be found at the SEC’s website, www.SEC.gov. You should not place undue reliance on these forward-looking statements which speak only as of the date of this presentation and the associated press release. We assume no obligation or duty and do not intend to update these forward-looking statements except as required by the securities laws. References to quantities of oil or gas include amounts we believe will ultimately be produced, and may include “proved reserves” and quantities of oil or gas that are not yet classified as “proved reserves” under SEC definitions. Statements of oil and gas reserves are estimates based on assumptions and may be imprecise. Investors are urged to consider closely the disclosure regarding reserves in our most recently filed Annual Report on Form 10-K and any subsequent Quarterly Reports on Form 10-Q.
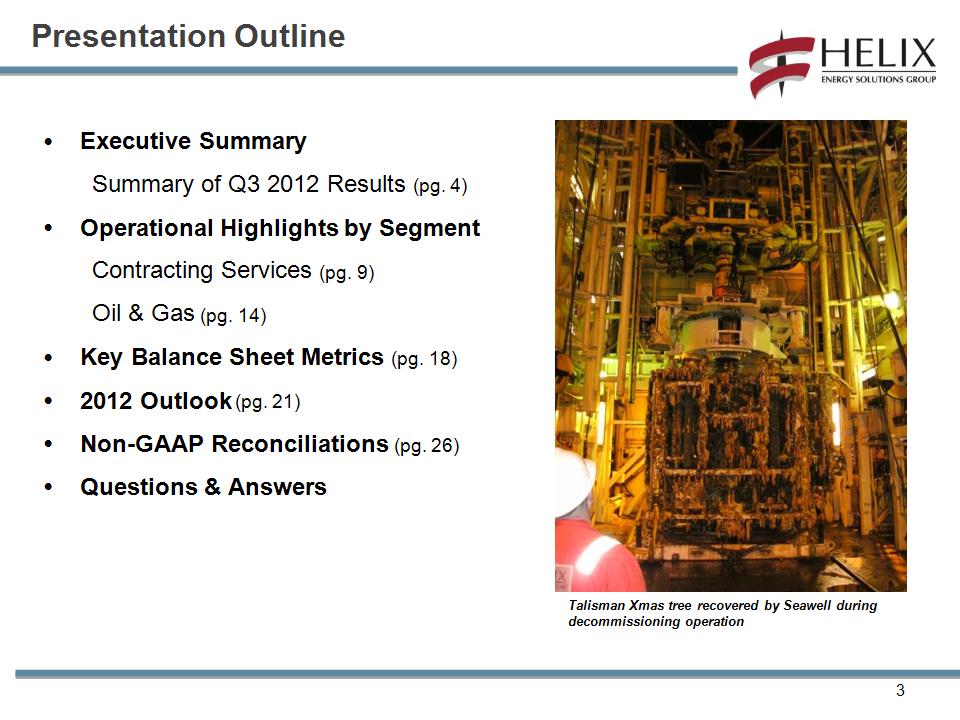
* Presentation Outline Executive Summary Summary of Q3 2012 Results (pg. 4) Operational Highlights by Segment Contracting Services (pg. 9) Oil & Gas (pg. 14) Key Balance Sheet Metrics (pg. 18) 2012 Outlook (pg. 21) Non-GAAP Reconciliations (pg. 26) Questions & Answers Talisman Xmas tree recovered by Seawell during decommissioning operation
Executive Summary *
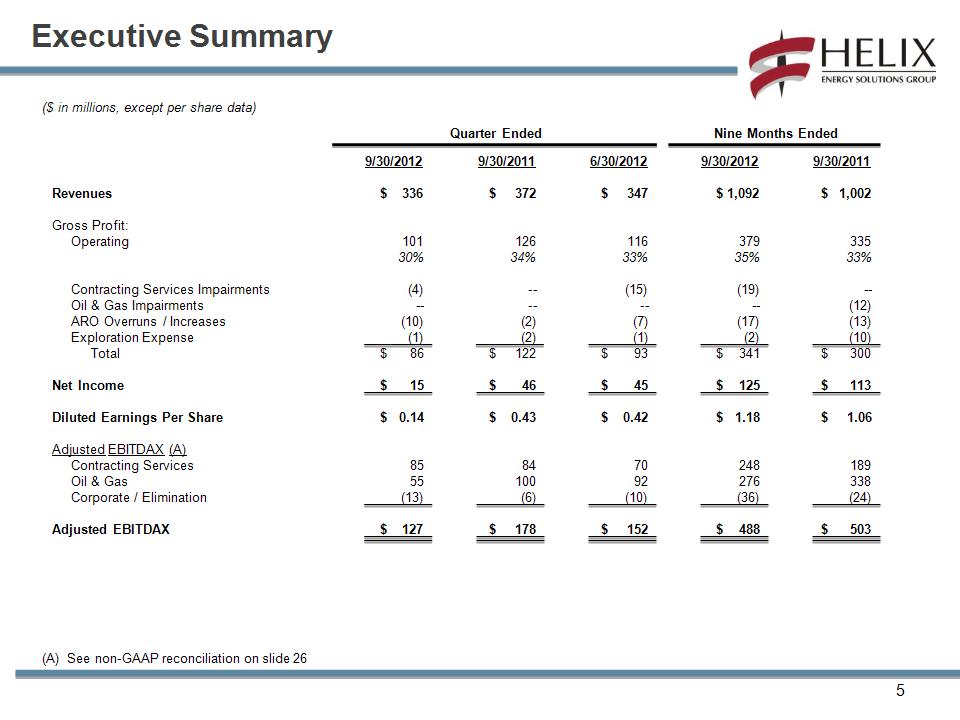
Executive Summary * ($ in millions, except per share data) (A) See non-GAAP reconciliation on slide 26 Revenues Gross Profit: Operating Contracting Services Impairments Oil & Gas Impairments ARO Overruns / Increases Exploration Expense Total Net Income Diluted Earnings Per Share Adjusted EBITDAX (A) Contracting Services Oil & Gas Corporate / Elimination Adjusted EBITDAX 9/30/2012 $ 336 101 30% (4) -- (10) (1) $ 86 $ 15 $ 0.14 85 55 (13) $ 127 9/30/2011 $ 372 126 34% -- -- (2) (2) $ 122 $ 46 $ 0.43 84 100 (6) $ 178 6/30/2012 $ 347 116 33% (15) -- (7) (1) $ 93 $ 45 $ 0.42 70 92 (10) $ 152 Quarter Ended 9/30/2012 $ 1,092 379 35% (19) -- (17) (2) $ 341 $ 125 $ 1.18 248 276 (36) $ 488 9/30/2011 $ 1,002 335 33% -- (12) (13) (10) $ 300 $ 113 $ 1.06 189 338 (24) $ 503 Nine Months Ended
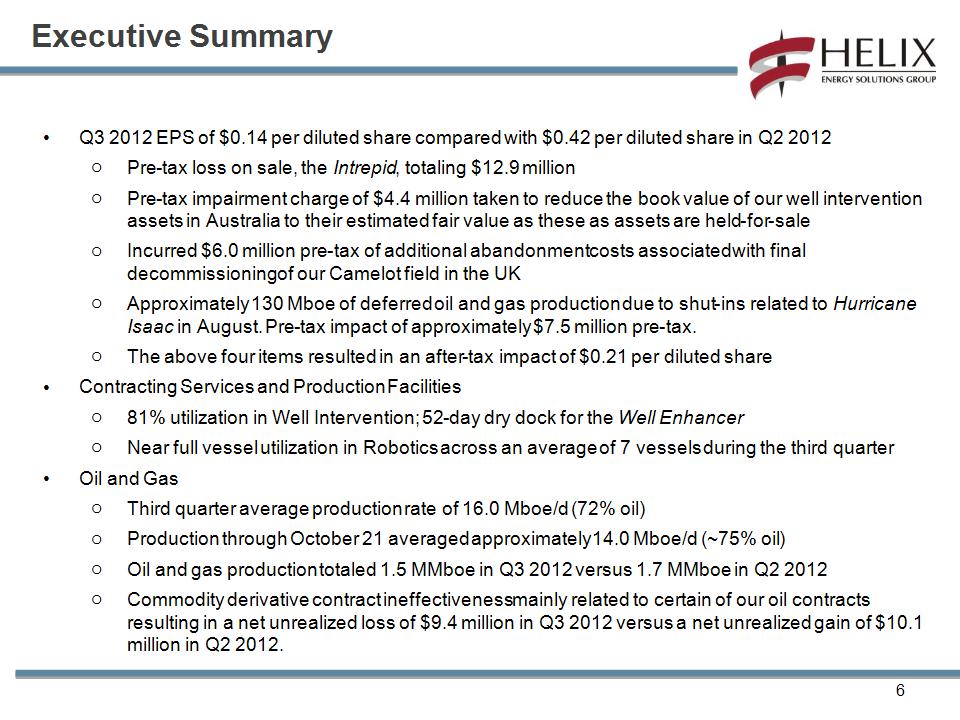
* Executive Summary Q3 2012 EPS of $0.14 per diluted share compared with $0.42 per diluted share in Q2 2012 Pre-tax loss on sale, the Intrepid, totaling $12.9 million Pre-tax impairment charge of $4.4 million taken to reduce the book value of our well intervention assets in Australia to their estimated fair value as these as assets are held-for-sale Incurred $6.0 million pre-tax of additional abandonment costs associated with final decommissioning of our Camelot field in the UK Approximately 130 Mboe of deferred oil and gas production due to shut-ins related to Hurricane Isaac in August. Pre-tax impact of approximately $7.5 million pre-tax. The above four items resulted in an after-tax impact of $0.21 per diluted share Contracting Services and Production Facilities 81% utilization in Well Intervention; 52-day dry dock for the Well Enhancer Near full vessel utilization in Robotics across an average of 7 vessels during the third quarter Oil and Gas Third quarter average production rate of 16.0 Mboe/d (72% oil) Production through October 21 averaged approximately 14.0 Mboe/d (~75% oil) Oil and gas production totaled 1.5 MMboe in Q3 2012 versus 1.7 MMboe in Q2 2012 Commodity derivative contract ineffectiveness mainly related to certain of our oil contracts resulting in a net unrealized loss of $9.4 million in Q3 2012 versus a net unrealized gain of $10.1 million in Q2 2012.
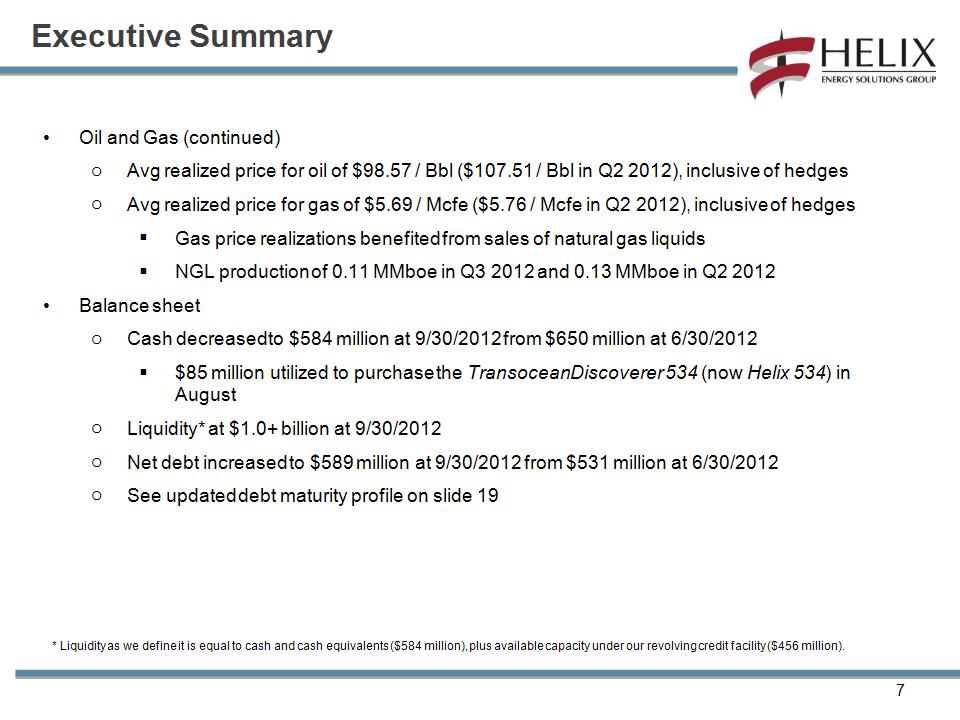
* Executive Summary Oil and Gas (continued) Avg realized price for oil of $98.57 / Bbl ($107.51 / Bbl in Q2 2012), inclusive of hedges Avg realized price for gas of $5.69 / Mcfe ($5.76 / Mcfe in Q2 2012), inclusive of hedges Gas price realizations benefited from sales of natural gas liquids NGL production of 0.11 MMboe in Q3 2012 and 0.13 MMboe in Q2 2012 Balance sheet Cash decreased to $584 million at 9/30/2012 from $650 million at 6/30/2012 $85 million utilized to purchase the Transocean Discoverer 534 (now Helix 534) in August Liquidity* at $1.0+ billion at 9/30/2012 Net debt increased to $589 million at 9/30/2012 from $531 million at 6/30/2012 See updated debt maturity profile on slide 19 * Liquidity as we define it is equal to cash and cash equivalents ($584 million), plus available capacity under our revolving credit facility ($456 million).
* Operational Highlights
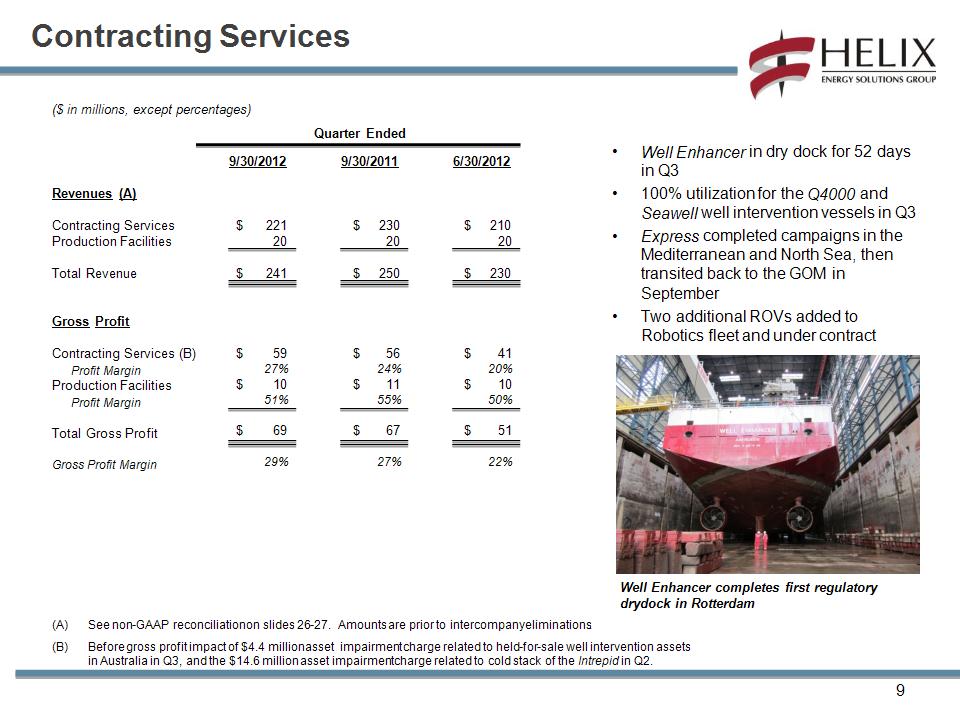
* ($ in millions, except percentages) See non-GAAP reconciliation on slides 26-27. Amounts are prior to intercompany eliminations. Before gross profit impact of $4.4 million asset impairment charge related to held-for-sale well intervention assets in Australia in Q3, and the $14.6 million asset impairment charge related to cold stack of the Intrepid in Q2. Contracting Services Well Enhancer in dry dock for 52 days in Q3 100% utilization for the Q4000 and Seawell well intervention vessels in Q3 Express completed campaigns in the Mediterranean and North Sea, then transited back to the GOM in September Two additional ROVs added to Robotics fleet and under contract Revenues (A) Contracting Services Production Facilities Total Revenue Gross Profit Contracting Services (B) Profit Margin Production Facilities Profit Margin Total Gross Profit Gross Profit Margin 9/30/2012 $ 221 20 $ 241 $ 59 27% $ 10 51% $ 69 29% 9/30/2011 $ 230 20 $ 250 $ 56 24% $ 11 55% $ 67 27% 6/30/2012 $ 210 20 $ 230 $ 41 20% $ 10 50% $ 51 22% Quarter Ended Well Enhancer completes first regulatory drydock in Rotterdam
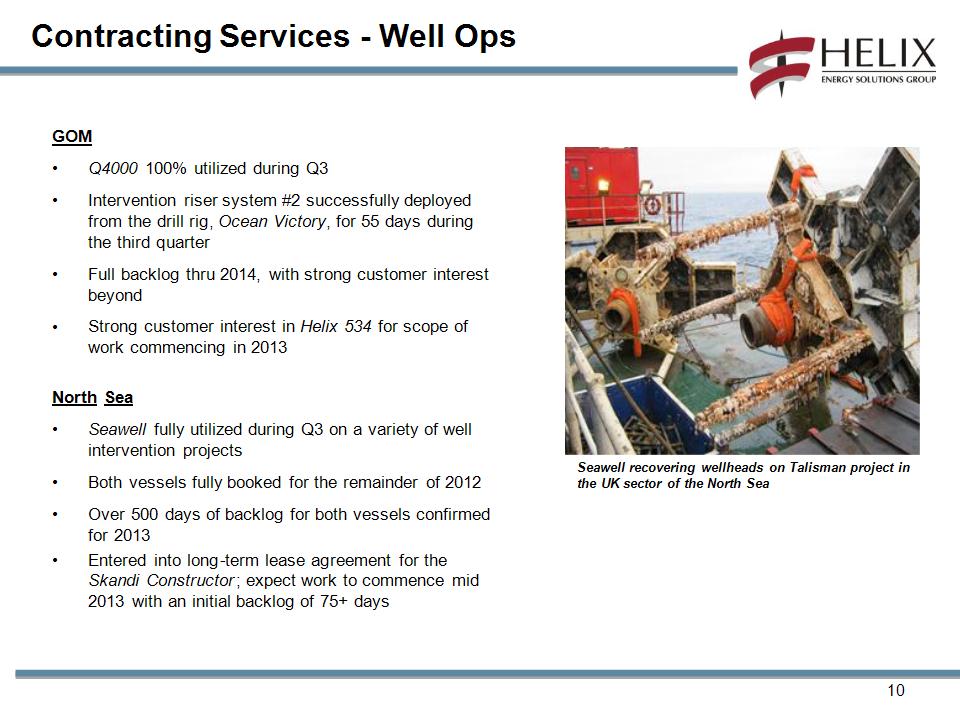
* Contracting Services – Well Ops GOM Q4000 100% utilized during Q3 Intervention riser system #2 successfully deployed from the drill rig, Ocean Victory, for 55 days during the third quarter Full backlog thru 2014, with strong customer interest beyond Strong customer interest in Helix 534 for scope of work commencing in 2013 North Sea Seawell fully utilized during Q3 on a variety of well intervention projects Both vessels fully booked for the remainder of 2012 Over 500 days of backlog for both vessels confirmed for 2013 Entered into long-term lease agreement for the Skandi Constructor; expect work to commence mid 2013 with an initial backlog of 75+ days Seawell recovering wellheads on Talisman project in the UK sector of the North Sea
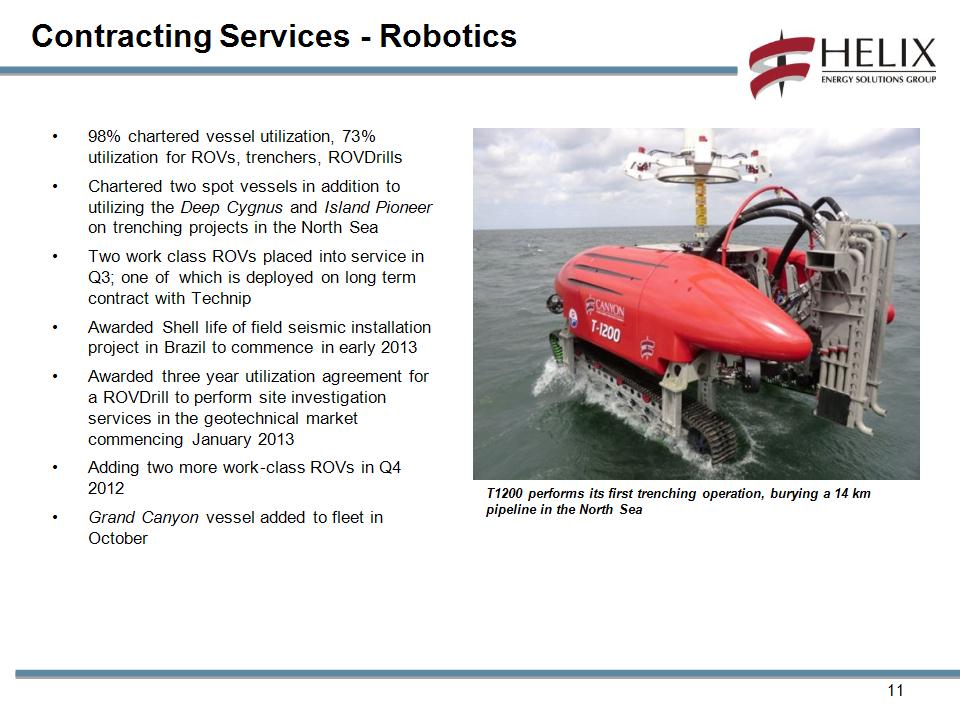
* Contracting Services – Robotics 98% chartered vessel utilization, 73% utilization for ROVs, trenchers, ROVDrills Chartered two spot vessels in addition to utilizing the Deep Cygnus and Island Pioneer on trenching projects in the North Sea Two work class ROVs placed into service in Q3; one of which is deployed on long term contract with Technip Awarded Shell life of field seismic installation project in Brazil to commence in early 2013 Awarded three year utilization agreement for a ROVDrill to perform site investigation services in the geotechnical market commencing January 2013 Adding two more work-class ROVs in Q4 2012 Grand Canyon vessel added to fleet in October T1200 performs its first trenching operation, burying a 14 km pipeline in the North Sea
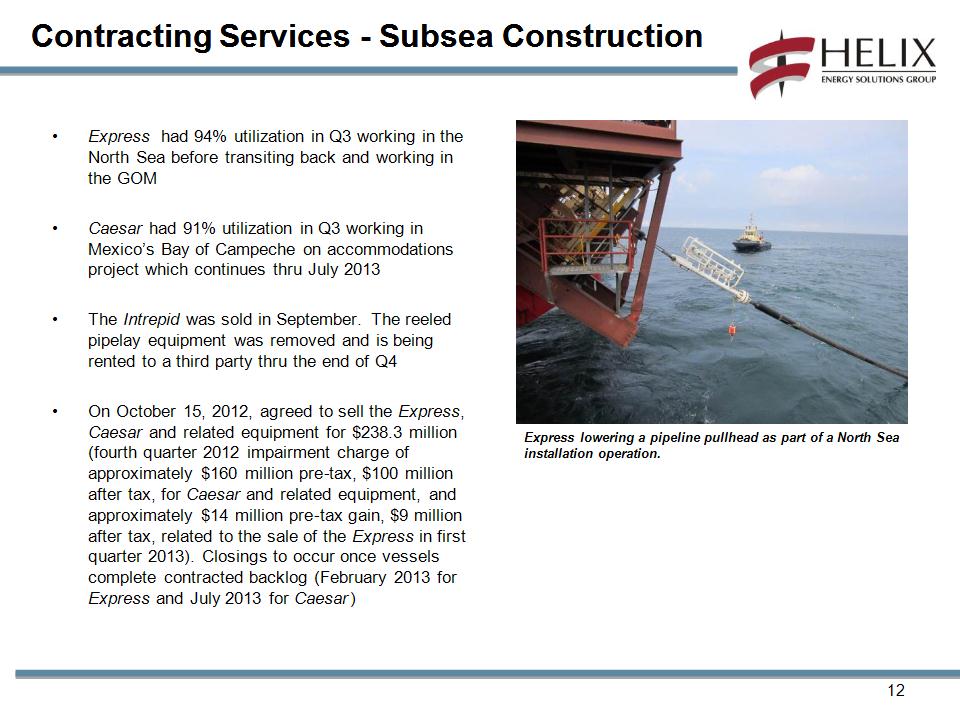
* Contracting Services – Subsea Construction Contracting Services – Subsea Construction Express had 94% utilization in Q3 working in the North Sea before transiting back and working in the GOM Caesar had 91% utilization in Q3 working in Mexico’s Bay of Campeche on accommodations project which continues thru July 2013 The Intrepid was sold in September. The reeled pipelay equipment was removed and is being rented to a third party thru the end of Q4 On October 15, 2012, agreed to sell the Express, Caesar and related equipment for $238.3 million (fourth quarter 2012 impairment charge of approximately $160 million pre-tax, $100 million after tax, for Caesar and related equipment, and approximately $14 million pre-tax gain, $9 million after tax, related to the sale of the Express in first quarter 2013). Closings to occur once vessels complete contracted backlog (February 2013 for Express and July 2013 for Caesar) Express lowering a pipeline pullhead as part of a North Sea installation operation.
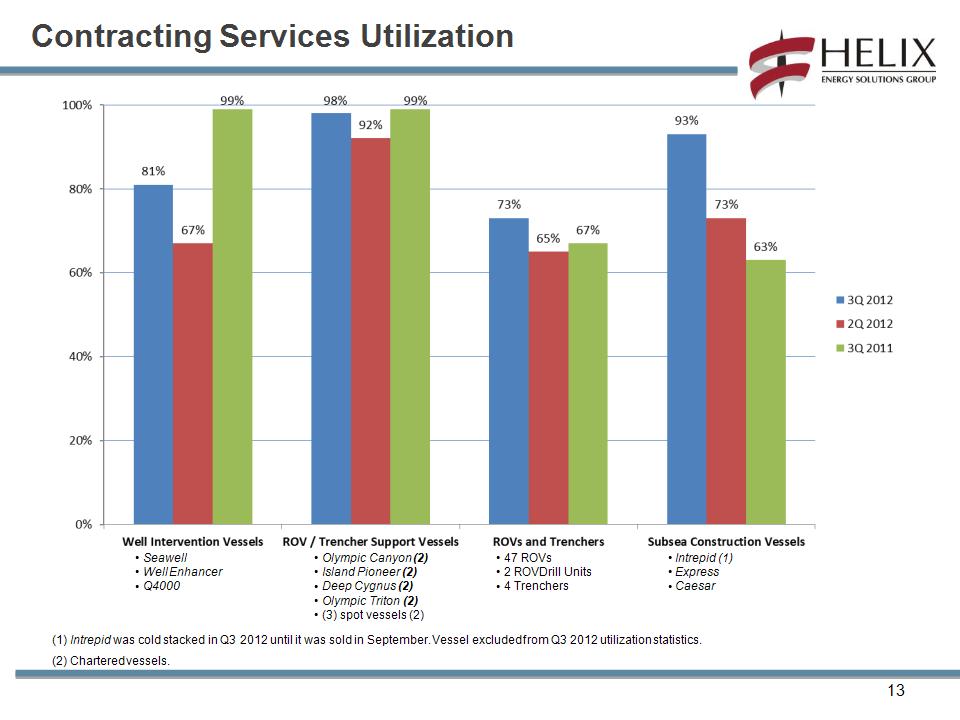
* Intrepid (1) Express Caesar Olympic Canyon (2) Island Pioneer (2) Deep Cygnus (2) Olympic Triton (2) (3) spot vessels (2) Seawell Well Enhancer Q4000 47 ROVs 2 ROVDrill Units 4 Trenchers (1) Intrepid was cold stacked in Q3 2012 until it was sold in September. Vessel excluded from Q3 2012 utilization statistics. (2) Chartered vessels. Contracting Services Utilization
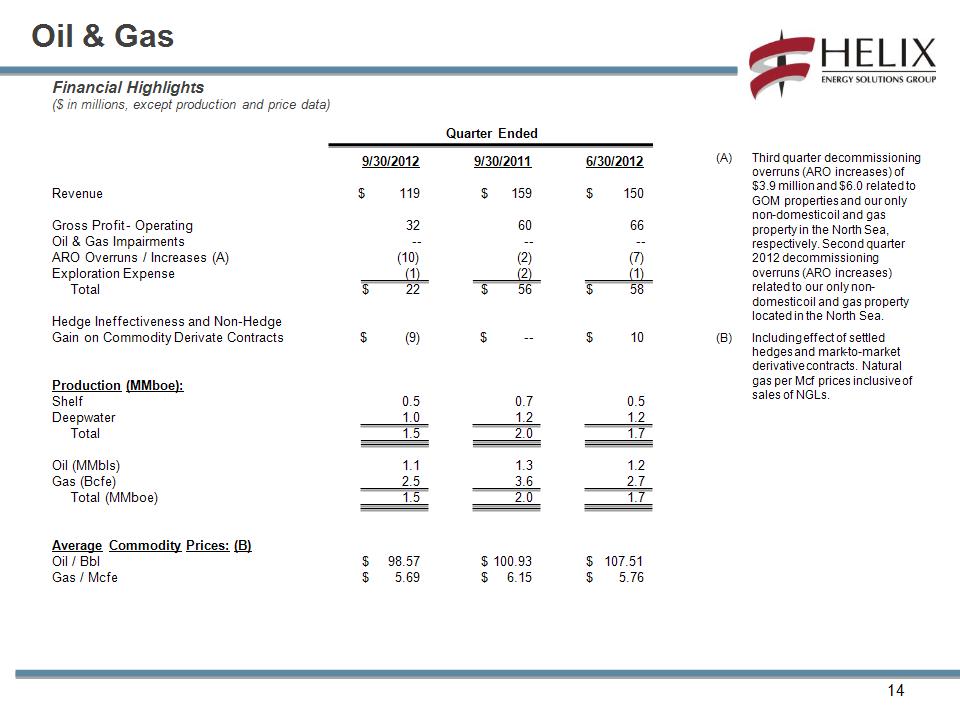
* Financial Highlights ($ in millions, except production and price data) Third quarter decommissioning overruns (ARO increases) of $3.9 million and $6.0 related to GOM properties and our only non-domestic oil and gas property in the North Sea, respectively. Second quarter 2012 decommissioning overruns (ARO increases) related to our only non-domestic oil and gas property located in the North Sea. Including effect of settled hedges and mark-to-market derivative contracts. Natural gas per Mcf prices inclusive of sales of NGLs. Oil & Gas Revenue Gross Profit - Operating Oil & Gas Impairments ARO Overruns / Increases (A) Exploration Expense Total Hedge Ineffectiveness and Non-Hedge Gain on Commodity Derivate Contracts Production (MMboe): Shelf Deepwater Total Oil (MMbls) Gas (Bcfe) Total (MMboe) Average Commodity Prices: (B) Oil / Bbl Gas / Mcfe 9/30/2012 $ 119 32 -- (10) (1) $ 22 $ (9) 0.5 1.0 1.5 1.1 2.5 1.5 $ 98.57 $ 5.69 9/30/2011 $ 159 60 -- (2) (2) $ 56 $ -- 0.7 1.2 2.0 1.3 3.6 2.0 $ 100.93 $ 6.15 6/30/2012 $ 150 66 -- (7) (1) $ 58 $ 10 0.5 1.2 1.7 1.2 2.7 1.7 $ 107.51 $ 5.76 Quarter Ended
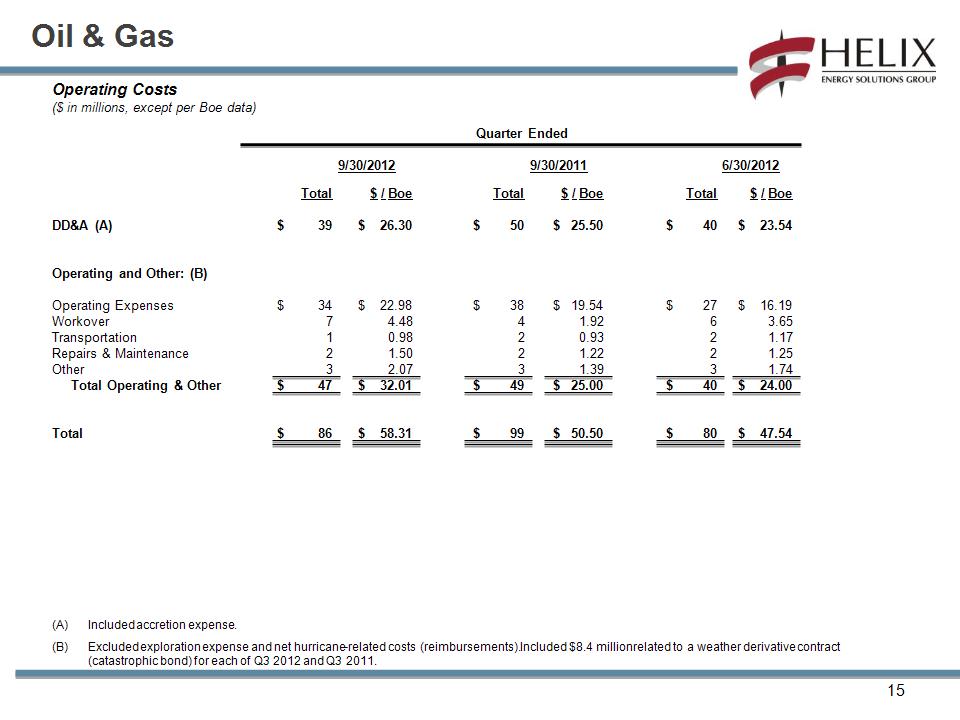
* Oil & Gas Included accretion expense. Excluded exploration expense and net hurricane-related costs (reimbursements). Included $8.4 million related to a weather derivative contract (catastrophic bond) for each of Q3 2012 and Q3 2011. Operating Costs ($ in millions, except per Boe data) DD&A (A) Operating and Other: (B) Operating Expenses Workover Transportation Repairs & Maintenance Other Total Operating & Other Total Total $ 39 $ 34 7 1 2 3 $ 47 $ 86 $ / Boe $ 26.30 $ 22.98 4.48 0.98 1.50 2.07 $ 32.01 $ 58.31 Total $ 50 $ 38 4 2 2 3 $ 49 $ 99 Quarter Ended 9/30/2012 9/30/2011 6/30/2012 $ / Boe $ 25.50 $ 19.54 1.92 0.93 1.22 1.39 $ 25.00 $ 50.50 Total $ 40 $ 27 6 2 2 3 $ 40 $ 80 $ / Boe $ 23.54 $ 16.19 3.65 1.17 1.25 1.74 $ 24.00 $ 47.54
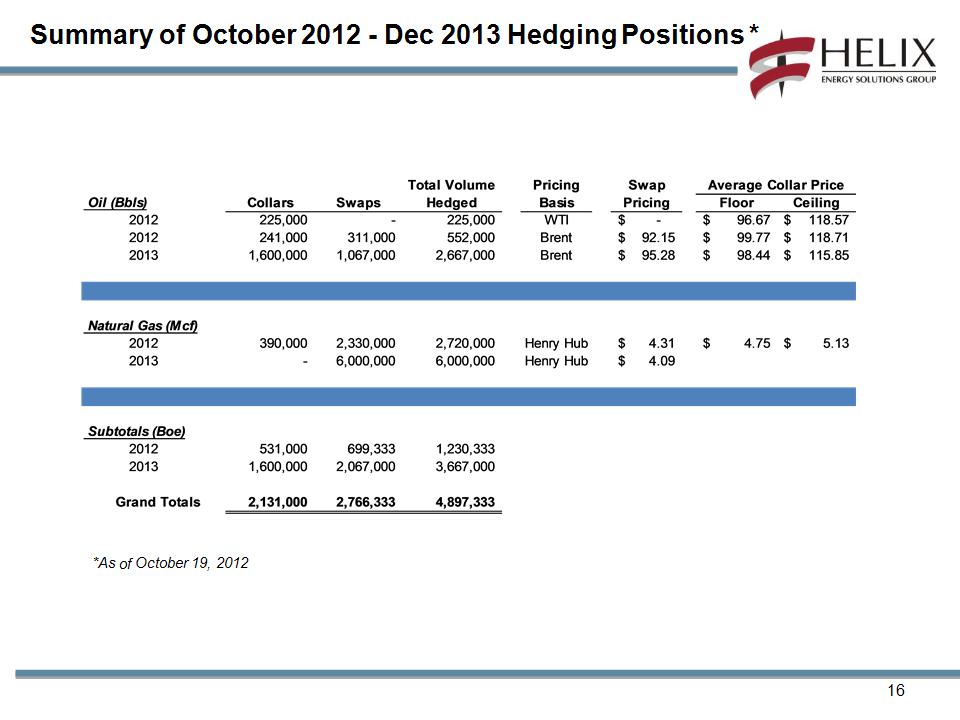
* Summary of October 2012 – Dec 2013 Hedging Positions * *As of October 19, 2012
* Key Balance Sheet Metrics
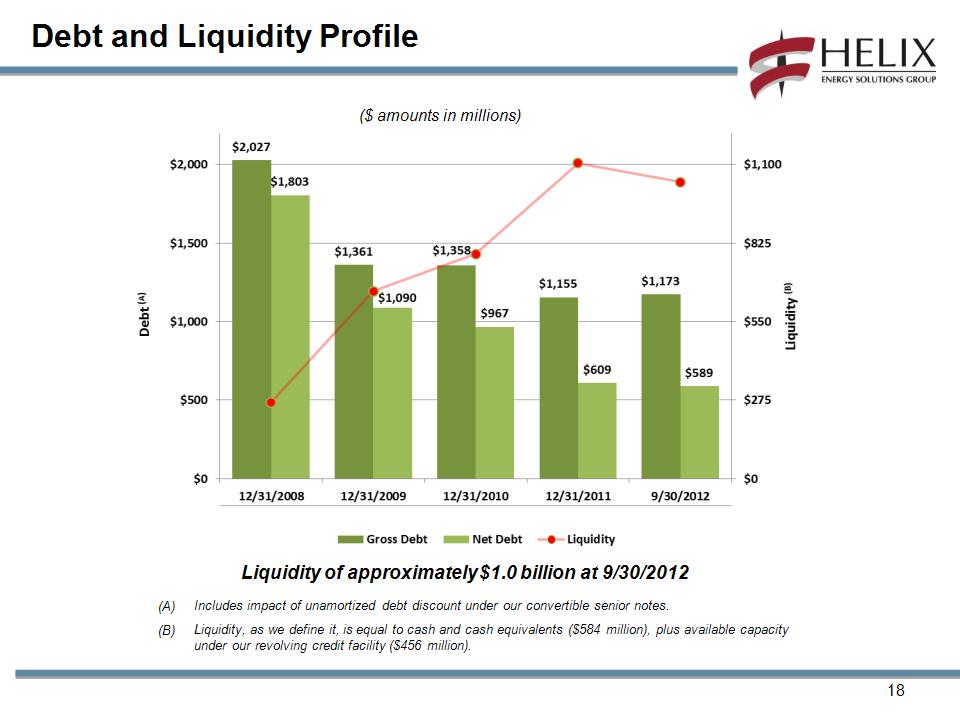
* Debt and Liquidity Profile Liquidity of approximately $1.0 billion at 9/30/2012 ($ amounts in millions) Includes impact of unamortized debt discount under our convertible senior notes. Liquidity, as we define it, is equal to cash and cash equivalents ($584 million), plus available capacity under our revolving credit facility ($456 million).
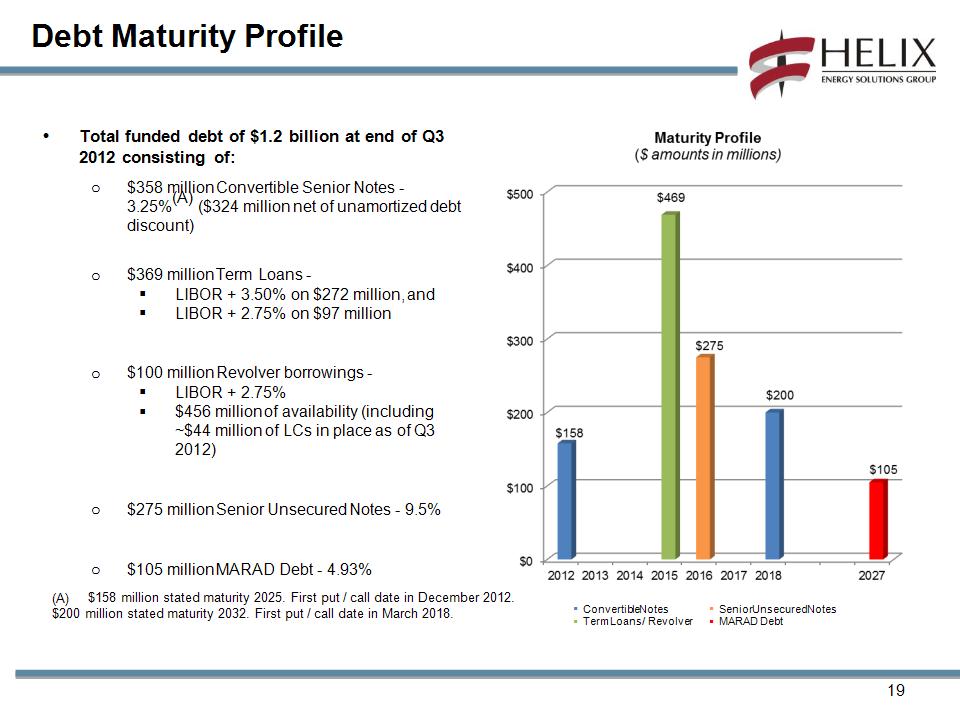
Debt Maturity Profile * Total funded debt of $1.2 billion at end of Q3 2012 consisting of: $358 million Convertible Senior Notes – 3.25%(A) ($324 million net of unamortized debt discount) $369 million Term Loans - LIBOR + 3.50% on $272 million, and LIBOR + 2.75% on $97 million $100 million Revolver borrowings – LIBOR + 2.75% $456 million of availability (including ~$44 million of LCs in place as of Q3 2012) $275 million Senior Unsecured Notes – 9.5% $105 million MARAD Debt – 4.93% Convertible Notes Term Loans / Revolver Senior Unsecured Notes MARAD Debt $158 million stated maturity 2025. First put / call date in December 2012. $200 million stated maturity 2032. First put / call date in March 2018.
* 2012 Outlook
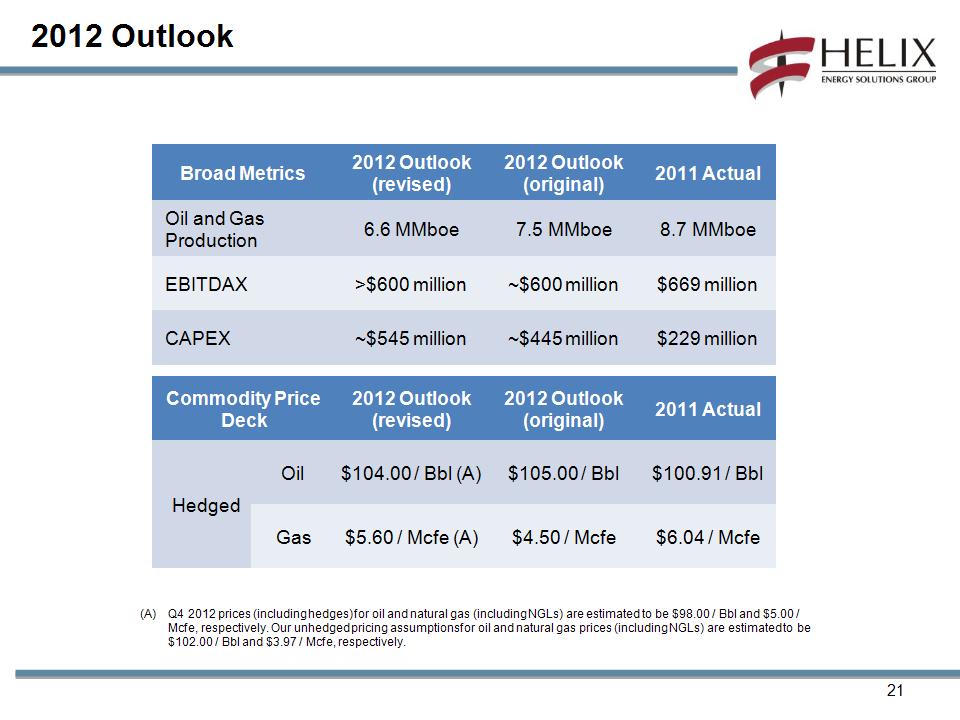
* 2012 Outlook Broad Metrics 2012 Outlook (revised) 2012 Outlook (original) 2011 Actual Oil and Gas Production 6.6 MMboe 7.5 MMboe 8.7 MMboe EBITDAX >$600 million ~$600 million $669 million CAPEX ~$545 million ~$445 million $229 million Commodity Price Deck Commodity Price Deck 2012 Outlook (revised) 2012 Outlook (original) 2011 Actual Hedged Oil $104.00 / Bbl (A) $105.00 / Bbl $100.91 / Bbl Hedged Gas $5.60 / Mcfe (A) $4.50 / Mcfe $6.04 / Mcfe Q4 2012 prices (including hedges) for oil and natural gas (including NGLs) are estimated to be $98.00 / Bbl and $5.00 / Mcfe, respectively. Our unhedged pricing assumptions for oil and natural gas prices (including NGLs) are estimated to be $102.00 / Bbl and $3.97 / Mcfe, respectively.
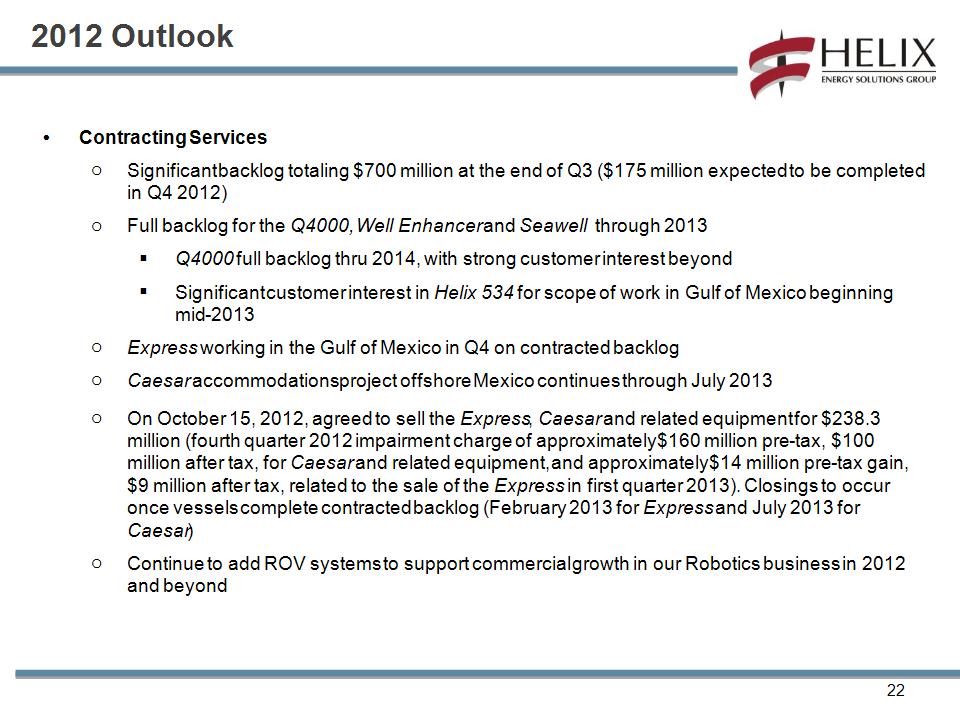
* 2012 Outlook Contracting Services Significant backlog totaling $700 million at the end of Q3 ($175 million expected to be completed in Q4 2012) Full backlog for the Q4000, Well Enhancer and Seawell through 2013 Q4000 full backlog thru 2014, with strong customer interest beyond Significant customer interest in Helix 534 for scope of work in Gulf of Mexico beginning mid-2013 Express working in the Gulf of Mexico in Q4 on contracted backlog Caesar accommodations project offshore Mexico continues through July 2013 On October 15, 2012, agreed to sell the Express, Caesar and related equipment for $238.3 million (fourth quarter 2012 impairment charge of approximately $160 million pre-tax, $100 million after tax, for Caesar and related equipment, and approximately $14 million pre-tax gain, $9 million after tax, related to the sale of the Express in first quarter 2013). Closings to occur once vessels complete contracted backlog (February 2013 for Express and July 2013 for Caesar) Continue to add ROV systems to support commercial growth in our Robotics business in 2012 and beyond
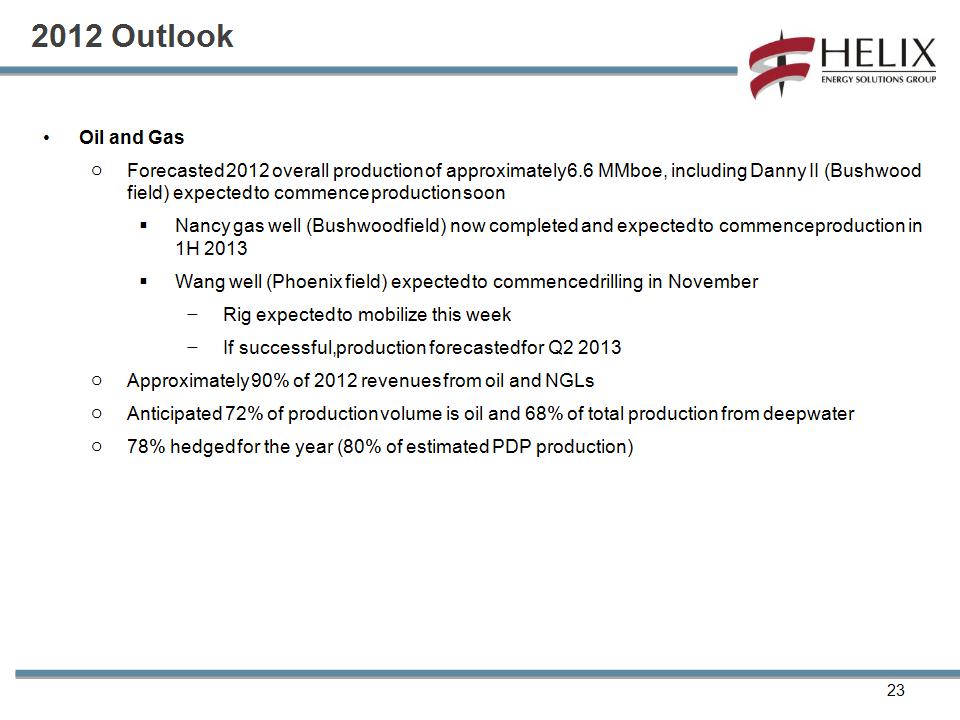
* 2012 Outlook Oil and Gas Forecasted 2012 overall production of approximately 6.6 MMboe, including Danny II (Bushwood field) expected to commence production soon Nancy gas well (Bushwood field) now completed and expected to commence production in 1H 2013 Wang well (Phoenix field) expected to commence drilling in November Rig expected to mobilize this week If successful, production forecasted for Q2 2013 Approximately 90% of 2012 revenues from oil and NGLs Anticipated 72% of production volume is oil and 68% of total production from deepwater 78% hedged for the year (80% of estimated PDP production)
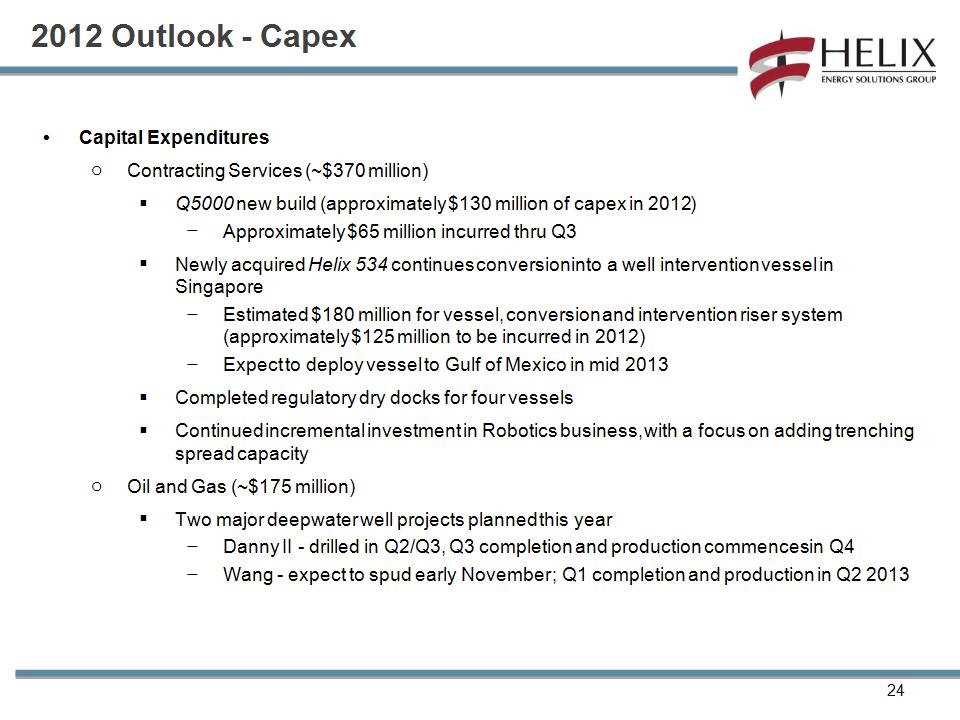
* 2012 Outlook - Capex Capital Expenditures Contracting Services (~$370 million) Q5000 new build (approximately $130 million of capex in 2012) Approximately $65 million incurred thru Q3 Newly acquired Helix 534 continues conversion into a well intervention vessel in Singapore Estimated $180 million for vessel, conversion and intervention riser system (approximately $125 million to be incurred in 2012) Expect to deploy vessel to Gulf of Mexico in mid 2013 Completed regulatory dry docks for four vessels Continued incremental investment in Robotics business, with a focus on adding trenching spread capacity Oil and Gas (~$175 million) Two major deepwater well projects planned this year Danny II – drilled in Q2/Q3, Q3 completion and production commences in Q4 Wang – expect to spud early November ; Q1 completion and production in Q2 2013
* Non-GAAP Reconciliations
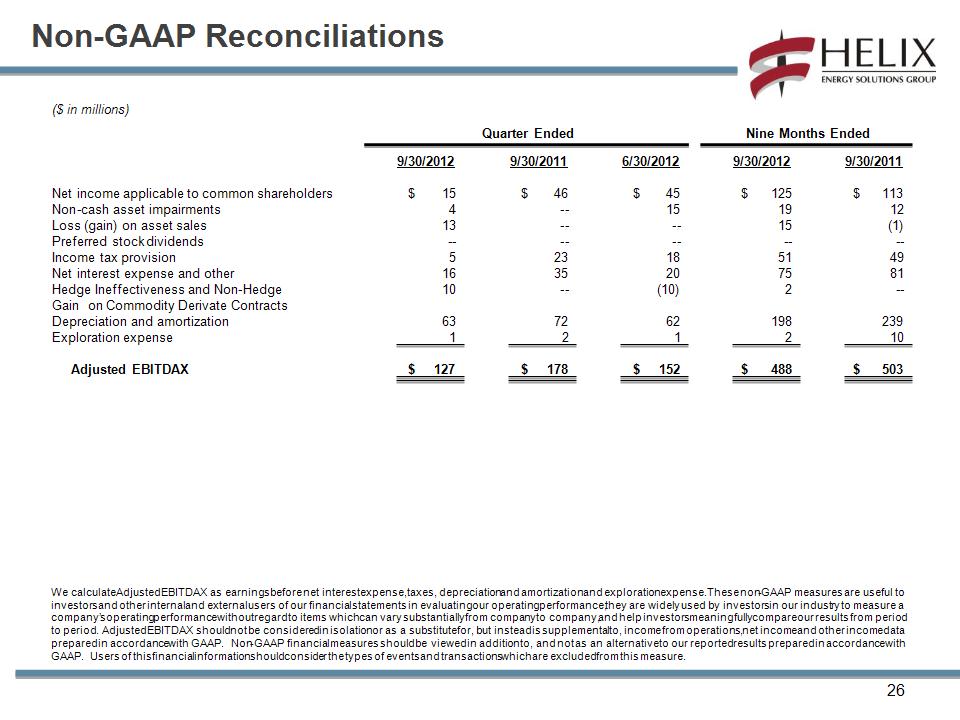
* Non-GAAP Reconciliations We calculate Adjusted EBITDAX as earnings before net interest expense, taxes, depreciation and amortization and exploration expense. These non-GAAP measures are useful to investors and other internal and external users of our financial statements in evaluating our operating performance; they are widely used by investors in our industry to measure a company’s operating performance without regard to items which can vary substantially from company to company, and help investors meaningfully compare our results from period to period. Adjusted EBITDAX should not be considered in isolation or as a substitute for, but instead is supplemental to, income from operations, net income and other income data prepared in accordance with GAAP. Non-GAAP financial measures should be viewed in addition to, and not as an alternative to our reported results prepared in accordance with GAAP. Users of this financial information should consider the types of events and transactions which are excluded from this measure. ($ in millions) Net income applicable to common shareholders Non-cash asset impairments Loss (gain) on asset sales Preferred stock dividends Income tax provision Net interest expense and other Hedge Ineffectiveness and Non-Hedge Gain on Commodity Derivate Contracts Depreciation and amortization Exploration expense Adjusted EBITDAX 9/30/2012 $ 15 4 13 -- 5 16 10 63 1 $ 127 9/30/2011 $ 46 -- -- -- 23 35 -- 72 2 $ 178 6/30/2012 $ 45 15 -- -- 18 20 (10) 62 1 $ 152 Quarter Ended 9/30/2012 $ 125 19 15 -- 51 75 2 198 2 $ 488 9/30/2011 $ 113 12 (1) -- 49 81 -- 239 10 $ 503 Nine Months Ended
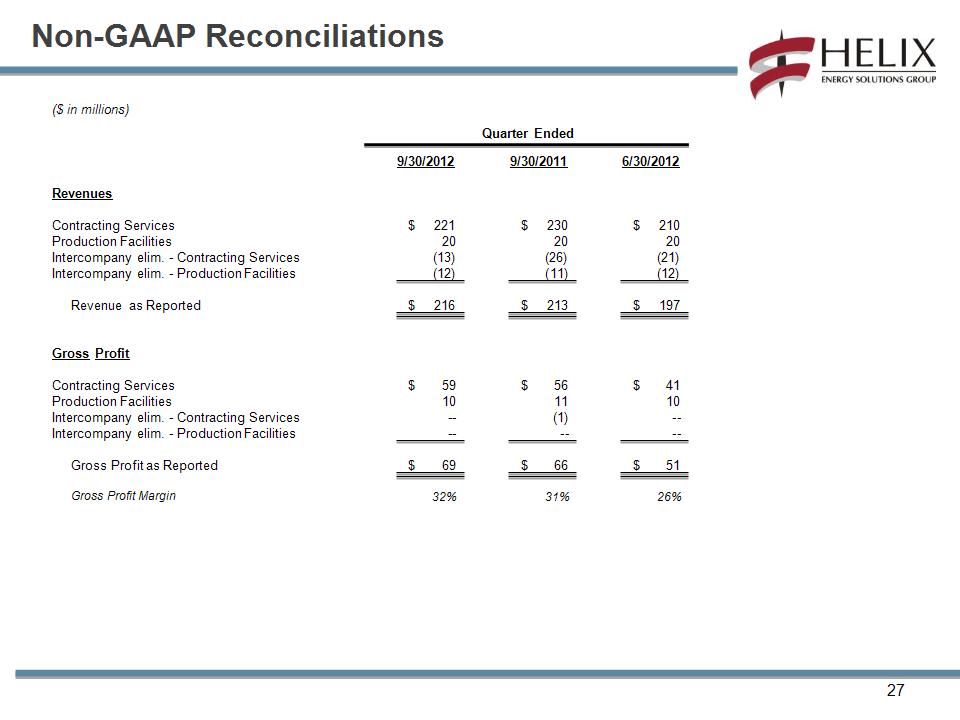
* Non-GAAP Reconciliations ($ in millions) Revenues Contracting Services Production Facilities Intercompany elim. – Contracting Services Intercompany elim. – Production Facilities Revenue as Reported Gross Profit Contracting Services Production Facilities Intercompany elim. – Contracting Services Intercompany elim. – Production Facilities Gross Profit as Reported Gross Profit Margin 9/30/2012 $ 221 20 (13) (12) $ 216 $ 59 10 -- -- $ 69 32% 9/30/2011 $ 230 20 (26) (11) $ 213 $ 56 11 (1) -- $ 66 31% 6/30/2012 $ 210 20 (21) (12) $ 197 $ 41 10 -- -- $ 51 26% Quarter Ended
* Follow Helix ESG on Twitter: www.twitter.com/Helix_ESG Join the discussion on LinkedIn: www.linkedin.com/company/helix