Attached files
| file | filename |
|---|---|
| 8-K - 8-K - EP Energy LLC | a12-24669_28k.htm |
Exhibit 99.1
Additional Disclosure to Lenders
|
|
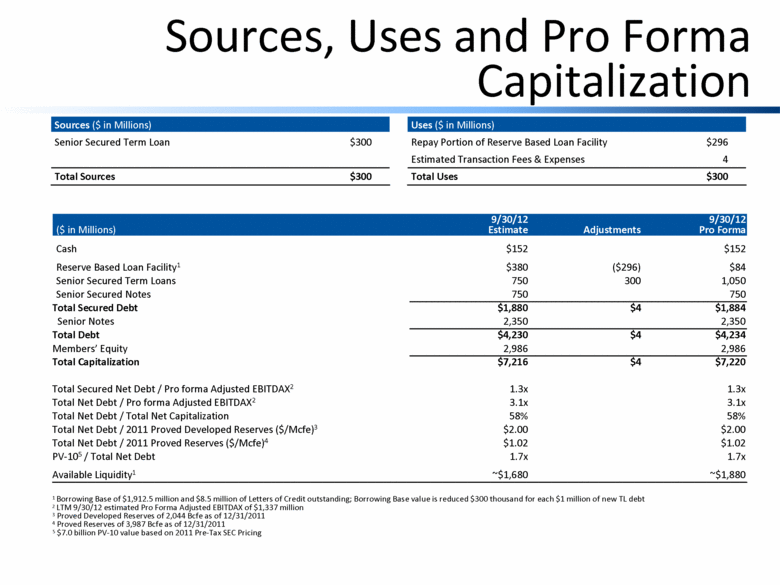
Sources, Uses and Pro Forma Capitalization Sources ($ in Millions) Senior Secured Term Loan $300 Total Sources $300 Uses ($ in Millions) Repay Portion of Reserve Based Loan Facility $296 Estimated Transaction Fees & Expenses 4 Total Uses $300 ($ in Millions) 9/30/12 Estimate Adjustments 9/30/12 Pro Forma Cash $152 $152 Reserve Based Loan Facility1 $380 ($296) $84 Senior Secured Term Loans 750 300 1,050 Senior Secured Notes 750 750 Total Secured Debt $1,880 $4 $1,884 Senior Notes 2,350 2,350 Total Debt $4,230 $4 $4,234 Members’ Equity 2,986 2,986 Total Capitalization $7,216 $4 $7,220 Total Secured Net Debt / Pro forma Adjusted EBITDAX2 1.3x 1.3x Total Net Debt / Pro forma Adjusted EBITDAX2 3.1x 3.1x Total Net Debt / Total Net Capitalization 58% 58% Total Net Debt / 2011 Proved Developed Reserves ($/Mcfe)3 $2.00 $2.00 Total Net Debt / 2011 Proved Reserves ($/Mcfe)4 $1.02 $1.02 PV-105 / Total Net Debt 1.7x 1.7x Available Liquidity1 ~$1,680 ~$1,880 1 Borrowing Base of $1,912.5 million and $8.5 million of Letters of Credit outstanding; Borrowing Base value is reduced $300 thousand for each $1 million of new TL debt 2 LTM 9/30/12 estimated Pro Forma Adjusted EBITDAX of $1,337 million 3 Proved Developed Reserves of 2,044 Bcfe as of 12/31/2011 4 Proved Reserves of 3,987 Bcfe as of 12/31/2011 5 $7.0 billion PV-10 value based on 2011 Pre-Tax SEC Pricing |
|
|
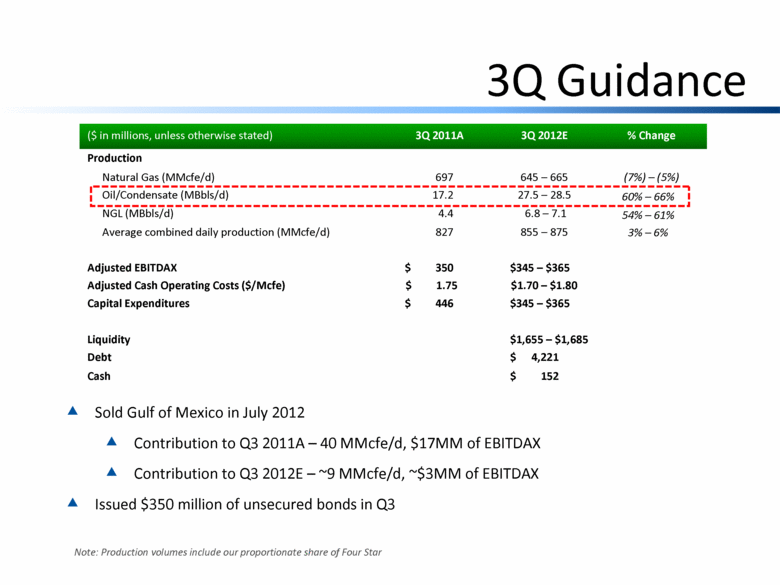
3Q Guidance Note: Production volumes include our proportionate share of Four Star ($ in millions, unless otherwise stated) 3Q 2011A 3Q 2012E % Change Production Natural Gas (MMcfe/d) 697 645 – 665 (7%) – (5%) Oil/Condensate (MBbls/d) 17.2 27.5 – 28.5 60% – 66% NGL (MBbls/d) 4.4 6.8 – 7.1 54% – 61% Average combined daily production (MMcfe/d) 827 855 – 875 3% – 6% Adjusted EBITDAX $ 350 $ 345 – $365 Adjusted Cash Operating Costs ($/Mcfe) $ 1.75 $ 1.70 – $1.80 Capital Expenditures $ 446 $ 345 – $365 Liquidity $ 1,655 – $1,685 Debt $ 4,221 Cash $ 152 Sold Gulf of Mexico in July 2012 Contribution to Q3 2011A – 40 MMcfe/d, $17MM of EBITDAX Contribution to Q3 2012E – ~9 MMcfe/d, ~$3MM of EBITDAX Issued $350 million of unsecured bonds in Q3 |
|
|
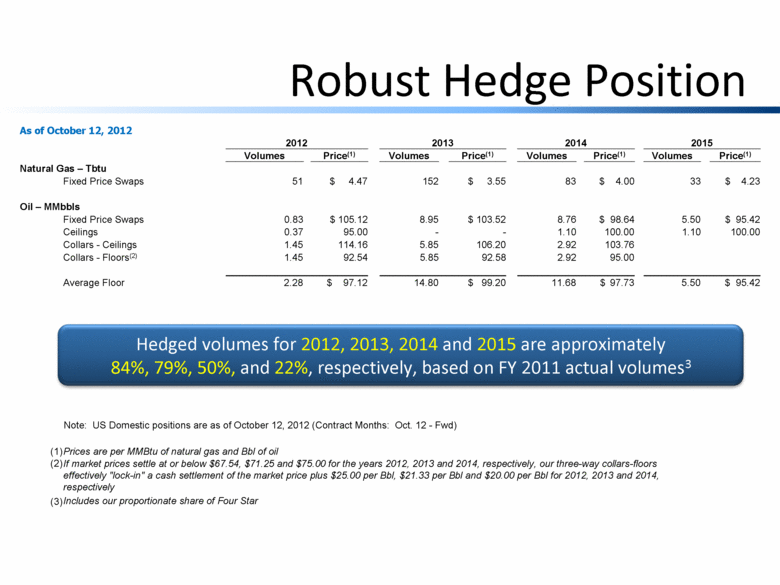
Robust Hedge Position As of October 12, 2012 2012 2013 2014 2015 Volumes Price(1) Volumes Price(1) Volumes Price(1) Volumes Price(1) Natural Gas – Tbtu Fixed Price Swaps 51 $ 4.47 152 $ 3.55 83 $ 4.00 33 $ 4.23 Oil – MMbbls Fixed Price Swaps 0.83 $ 105.12 8.95 $ 103.52 8.76 $ 98.64 5.50 $ 95.42 Ceilings 0.37 95.00 - - 1.10 100.00 1.10 100.00 Collars - Ceilings 1.45 114.16 5.85 106.20 2.92 103.76 Collars - Floors(2) 1.45 92.54 5.85 92.58 2.92 95.00 Average Floor 2.28 $ 97.12 14.80 $ 99.20 11.68 $ 97.73 5.50 $ 95.42 Note: US Domestic positions are as of October 12, 2012 (Contract Months: Oct. 12 - Fwd) (1) Prices are per MMBtu of natural gas and Bbl of oil (2) If market prices settle at or below $67.54, $71.25 and $75.00 for the years 2012, 2013 and 2014, respectively, our three-way collars-floors effectively "lock-in" a cash settlement of the market price plus $25.00 per Bbl, $21.33 per Bbl and $20.00 per Bbl for 2012, 2013 and 2014, respectively (3) Includes our proportionate share of Four Star Hedged volumes for 2012, 2013, 2014 and 2015 are approximately 84%, 79%, 50%, and 22%, respectively, based on FY 2011 actual volumes3 |
|
|
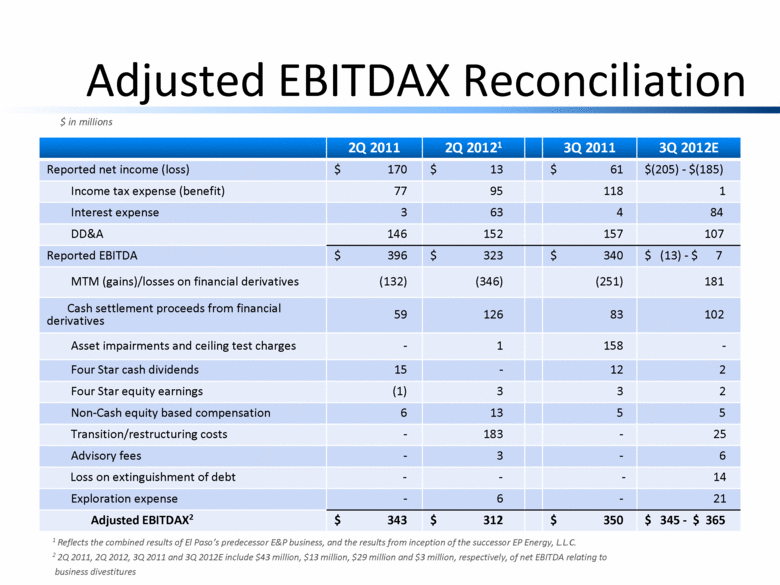
Adjusted EBITDAX Reconciliation $ in millions 1 Reflects the combined results of El Paso’s predecessor E&P business, and the results from inception of the successor EP Energy, L.L.C. 2 2Q 2011, 2Q 2012, 3Q 2011 and 3Q 2012E include $43 million, $13 million, $29 million and $3 million, respectively, of net EBITDA relating to business divestitures 2Q 2011 2Q 20121 3Q 2011 3Q 2012E Reported net income (loss) $ 170 $ 13 $ 61 $(205) - $(185) Income tax expense (benefit) 77 95 118 1 Interest expense 3 63 4 84 DD&A 146 152 157 107 Reported EBITDA $ 396 $ 323 $ 340 $ (13) - $ 7 MTM (gains)/losses on financial derivatives (132) (346) (251) 181 Cash settlement proceeds from financial derivatives 59 126 83 102 Asset impairments and ceiling test charges - 1 158 - Four Star cash dividends 15 - 12 2 Four Star equity earnings (1) 3 3 2 Non-Cash equity based compensation 6 13 5 5 Transition/restructuring costs - 183 - 25 Advisory fees - 3 - 6 Loss on extinguishment of debt - - - 14 Exploration expense - 6 - 21 Adjusted EBITDAX2 $ 343 $ 312 $ 350 $ 345 - $ 365 |
|
|
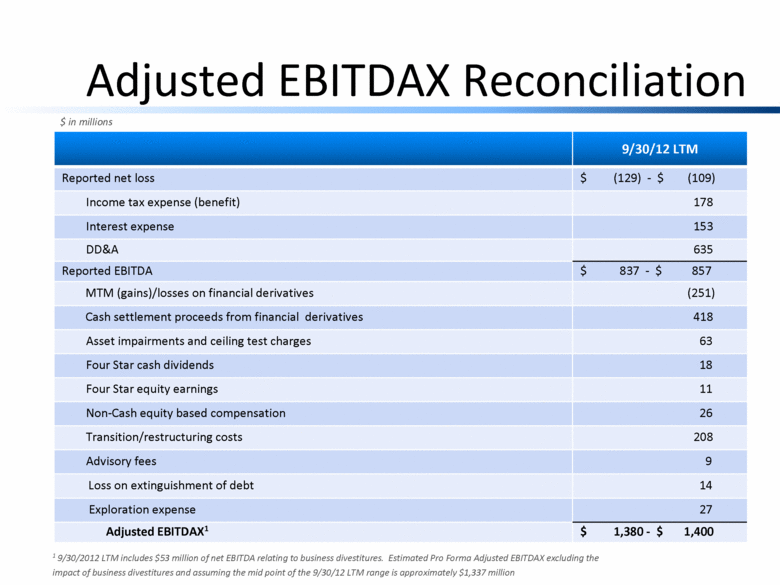
Adjusted EBITDAX Reconciliation $ in millions 1 9/30/2012 LTM includes $53 million of net EBITDA relating to business divestitures. Estimated Pro Forma Adjusted EBITDAX excluding the impact of business divestitures and assuming the mid point of the 9/30/12 LTM range is approximately $1,337 million 9/30/12 LTM Reported net loss $ (129) - $ (109) Income tax expense (benefit) 178 Interest expense 153 DD&A 635 Reported EBITDA $ 837 - $ 857 MTM (gains)/losses on financial derivatives (251) Cash settlement proceeds from financial derivatives 418 Asset impairments and ceiling test charges 63 Four Star cash dividends 18 Four Star equity earnings 11 Non-Cash equity based compensation 26 Transition/restructuring costs 208 Advisory fees 9 Loss on extinguishment of debt 14 Exploration expense 27 Adjusted EBITDAX1 $ 1,380 - $ 1,400 |
|
|
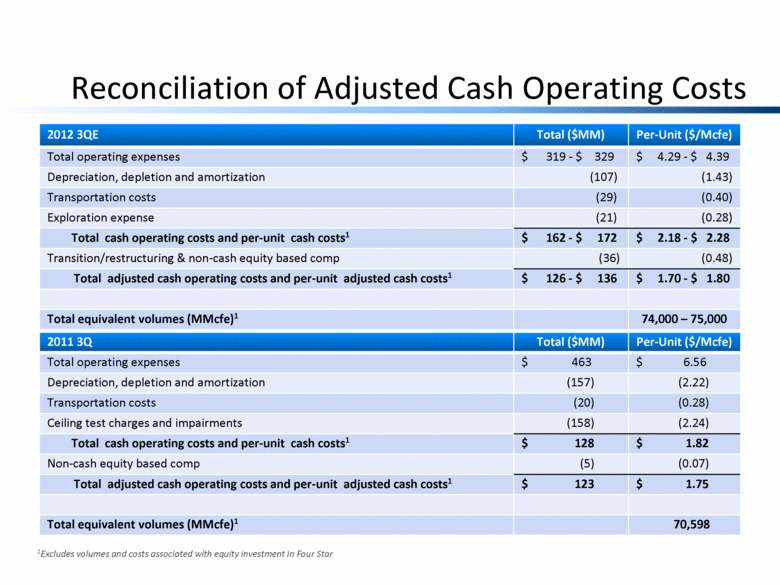
Reconciliation of Adjusted Cash Operating Costs 2011 3Q Total ($MM) Per-Unit ($/Mcfe) Total operating expenses $ 463 $ 6.56 Depreciation, depletion and amortization (157) (2.22) Transportation costs (20) (0.28) Ceiling test charges and impairments (158) (2.24) Total cash operating costs and per-unit cash costs1 $ 128 $ 1.82 Non-cash equity based comp (5) (0.07) Total adjusted cash operating costs and per-unit adjusted cash costs1 $ 123 $ 1.75 Total equivalent volumes (MMcfe)1 70,598 1Excludes volumes and costs associated with equity investment in Four Star 2012 3QE Total ($MM) Per-Unit ($/Mcfe) Total operating expenses $ 319 - $ 329 $ 4.29 - $ 4.39 Depreciation, depletion and amortization (107) (1.43) Transportation costs (29) (0.40) Exploration expense (21) (0.28) Total cash operating costs and per-unit cash costs1 $ 162 - $ 172 $ 2.18 - $ 2.28 Transition/restructuring & non-cash equity based comp (36) (0.48) Total adjusted cash operating costs and per-unit adjusted cash costs1 $ 126 - $ 136 $ 1.70 - $ 1.80 Total equivalent volumes (MMcfe)1 74,000 – 75,000 |
|
|
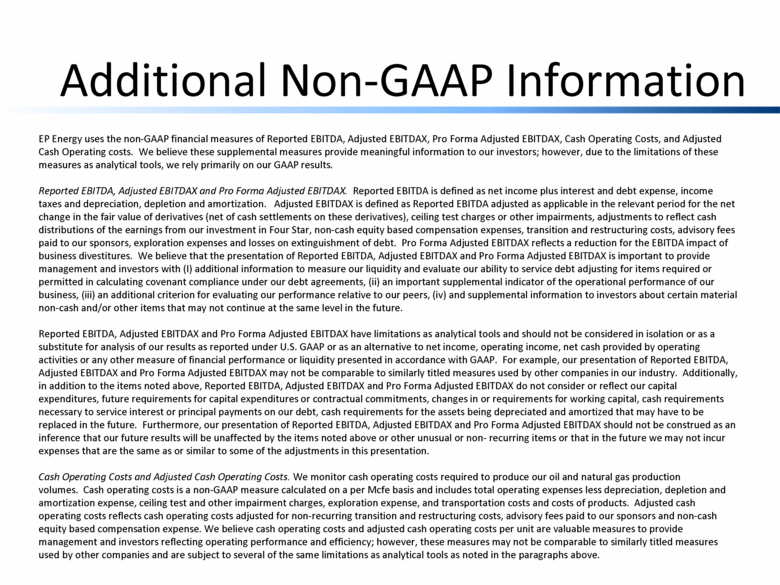
Additional Non-GAAP Information EP Energy uses the non-GAAP financial measures of Reported EBITDA, Adjusted EBITDAX, Pro Forma Adjusted EBITDAX, Cash Operating Costs, and Adjusted Cash Operating costs. We believe these supplemental measures provide meaningful information to our investors; however, due to the limitations of these measures as analytical tools, we rely primarily on our GAAP results. Reported EBITDA, Adjusted EBITDAX and Pro Forma Adjusted EBITDAX. Reported EBITDA is defined as net income plus interest and debt expense, income taxes and depreciation, depletion and amortization. Adjusted EBITDAX is defined as Reported EBITDA adjusted as applicable in the relevant period for the net change in the fair value of derivatives (net of cash settlements on these derivatives), ceiling test charges or other impairments, adjustments to reflect cash distributions of the earnings from our investment in Four Star, non-cash equity based compensation expenses, transition and restructuring costs, advisory fees paid to our sponsors, exploration expenses and losses on extinguishment of debt. Pro Forma Adjusted EBITDAX reflects a reduction for the EBITDA impact of business divestitures. We believe that the presentation of Reported EBITDA, Adjusted EBITDAX and Pro Forma Adjusted EBITDAX is important to provide management and investors with (I) additional information to measure our liquidity and evaluate our ability to service debt adjusting for items required or permitted in calculating covenant compliance under our debt agreements, (ii) an important supplemental indicator of the operational performance of our business, (iii) an additional criterion for evaluating our performance relative to our peers, (iv) and supplemental information to investors about certain material non-cash and/or other items that may not continue at the same level in the future. Reported EBITDA, Adjusted EBITDAX and Pro Forma Adjusted EBITDAX have limitations as analytical tools and should not be considered in isolation or as a substitute for analysis of our results as reported under U.S. GAAP or as an alternative to net income, operating income, net cash provided by operating activities or any other measure of financial performance or liquidity presented in accordance with GAAP. For example, our presentation of Reported EBITDA, Adjusted EBITDAX and Pro Forma Adjusted EBITDAX may not be comparable to similarly titled measures used by other companies in our industry. Additionally, in addition to the items noted above, Reported EBITDA, Adjusted EBITDAX and Pro Forma Adjusted EBITDAX do not consider or reflect our capital expenditures, future requirements for capital expenditures or contractual commitments, changes in or requirements for working capital, cash requirements necessary to service interest or principal payments on our debt, cash requirements for the assets being depreciated and amortized that may have to be replaced in the future. Furthermore, our presentation of Reported EBITDA, Adjusted EBITDAX and Pro Forma Adjusted EBITDAX should not be construed as an inference that our future results will be unaffected by the items noted above or other unusual or non- recurring items or that in the future we may not incur expenses that are the same as or similar to some of the adjustments in this presentation. Cash Operating Costs and Adjusted Cash Operating Costs. We monitor cash operating costs required to produce our oil and natural gas production volumes. Cash operating costs is a non-GAAP measure calculated on a per Mcfe basis and includes total operating expenses less depreciation, depletion and amortization expense, ceiling test and other impairment charges, exploration expense, and transportation costs and costs of products. Adjusted cash operating costs reflects cash operating costs adjusted for non-recurring transition and restructuring costs, advisory fees paid to our sponsors and non-cash equity based compensation expense. We believe cash operating costs and adjusted cash operating costs per unit are valuable measures to provide management and investors reflecting operating performance and efficiency; however, these measures may not be comparable to similarly titled measures used by other companies and are subject to several of the same limitations as analytical tools as noted in the paragraphs above. |
* * *
This filing includes certain forward-looking statements and projections of EP Energy LLC (“EP Energy”). EP Energy has made every reasonable effort to ensure that the information and assumptions on which these statements and projections are based are current, reasonable, and complete. However, a variety of factors could cause actual results to differ materially from the projections, anticipated results or other expectations expressed, including, without limitation, EP Energy’s ability to meet production volume targets; the uncertainty of estimating proved reserves and unproved resources; the future level of service and capital costs; the availability and cost of financing to fund future exploration and production operations; the success of drilling programs with regard to proved undeveloped reserves and unproved resources; EP Energy’s ability to comply with the covenants in various financing documents; EP Energy’s ability to obtain necessary governmental approvals for proposed E&P projects and to successfully construct and operate such projects; actions by the credit rating agencies; credit and performance risk of EP Energy’s lenders, trading counterparties, customers, vendors and suppliers; changes in commodity prices and basis differentials for oil and natural gas; general economic and weather conditions in geographic regions or markets served by EP Energy, or where operations of EP Energy are located, including the risk of a global recession and negative impact on natural gas demand; the uncertainties associated with governmental regulation; political and currency risks associated with international operations of EP Energy; competition; and other factors described in EP Energy’s Securities and Exchange Commission filings. While EP Energy makes these statements and projections in good faith, neither EP Energy nor its management can guarantee that anticipated future results will be achieved. Reference must be made to those filings for additional important factors that may affect actual results. EP Energy assumes no obligation to publicly update or revise any forward-looking statements made herein or any other forward-looking statements made by EP Energy, whether as a result of new information, future events, or otherwise.
This filing includes “forward-looking statements” intended to qualify for the safe harbor from liability established by the Private Securities Litigation Reform Act of 1995. You can identify these statements by the fact that they do not relate strictly to historical or current facts. These statements contain words such as “may,” “will,” “project,” “might,” “expect,” “believe,” “anticipate,” “intend,” “could,” “would,” “estimate,” “continue” or “pursue,” or the negative or other variations thereof or comparable terminology. In particular, they include statements relating to, among other things, future actions, new projects, strategies, future performance, the outcomes of contingencies and future financial results of EP Energy. These forward-looking statements are based on current expectations and projections about future events.
Investors are cautioned that forward-looking statements are not guarantees of future performance or results and involve risks and uncertainties that cannot be predicted or quantified and, consequently, the actual performance of EP Energy may differ materially from those expressed or implied by such forward-looking statements. Such risks and uncertainties include, but are not limited to, factors described from time to time in the Company’s reports filed with the Securities and Exchange Commission (including the sections entitled “Risk Factors” and “Management’s Discussion and Analysis of Financial Condition and Results of Operations” contained therein).
Any forward-looking statements are made pursuant to the Private Securities Litigation Reform Act of 1995 and, as such, speak only as of the date made. EP Energy disclaims any obligation to update the forward-looking statements. You are cautioned not to place undue reliance on these forward-looking statements, which speak only as of the date stated, or if no date is stated, as of the date of this filing.

