Attached files
| file | filename |
|---|---|
| EX-99.1 - EX-99.1 - FNB CORP/PA/ | d427352dex991.htm |
| 8-K - 8-K - FNB CORP/PA/ | d427352d8k.htm |
 F.N.B. Corporation
Announces Agreement to Acquire
Annapolis Bancorp, Inc.
October 22, 2012
Exhibit 99.2 |
 Cautionary Statement Regarding Forward-Looking Information
and Non-GAAP Financial Information
2
F.N.B.
Corporation
and
Annapolis
Bancorp,
Inc.
will
file
a
proxy
statement/prospectus
and
other
relevant
documents
with
the
SEC
in
connection
with
the
merger.
SHAREHOLDERS OF ANNAPOLIS BANCORP, INC. ARE ADVISED TO READ THE PROXY STATEMENT/PROSPECTUS
WHEN IT BECOMES AVAILABLE AND ANY OTHER RELEVANT DOCUMENTS FILED WITH THE SEC, AS WELL
AS ANY AMENDMENTS OR SUPPLEMENTS TO THOSE DOCUMENTS, BECAUSE THEY WILL CONTAIN
IMPORTANT INFORMATION. The proxy statement/prospectus and other relevant materials
(when they become available), and any other documents F.N.B. Corporation has filed with
the
SEC,
may
be
obtained
free
of
charge
at
the
SEC's
website
at
www.sec.gov.
In
addition,
investors
and
security
holders
may
obtain
free
copies
of
the documents F.N.B. Corporation has filed with the SEC by contacting James Orie, Chief Legal
Officer, F.N.B. Corporation, One F.N.B. Boulevard, Hermitage, PA 16148,
telephone: (724) 983-3317; and free copies of the documents Annapolis Bancorp, Inc. has filed with the SEC by contacting Edward
Schneider, Treasurer and CFO, Annapolis Bancorp, Inc., 1000 Bestgate Road, Suite 400,
Annapolis, MD 21401, telephone: (410) 224-4455. F.N.B.
Corporation
and
Annapolis
Bancorp,
Inc.
and
certain
of
their
directors
and
executive
officers
may
be
deemed
to
be
participants
in the solicitation of proxies from its shareholders in connection with the proposed merger.
Information concerning such participants' ownership of Annapolis
Bancorp,
Inc.
common
stock
will
be
set
forth
in
the
proxy
statement/prospectus
relating
to
the
merger
when
it
becomes
available.
This
communication
does
not
constitute
an
offer
of
any
securities
for
sale.
This presentation contains "forward-looking statements" within the meaning of the
Private Securities Litigation Reform Act, relating to present or future trends or
factors affecting the banking industry and, specifically, the financial operations, markets and products of F.N.B. Corporation. Forward-looking
statements are typically identified by words such as “believe”, “plan”,
“expect”, “anticipate”, “intend”, “outlook”, “estimate”, “forecast”, “will”, “should”,
“project”, “goal”, and other similar words and expressions. These
forward-looking statements involve certain risks and uncertainties. In addition to factors
previously disclosed in F.N.B. Corporation’s reports filed with the SEC and those
identified elsewhere in this presentation, the following factors among others, could
cause actual results to differ materially from forward-looking statements or historical performance: ability to obtain regulatory approvals and meet
other closing conditions to the Merger, including approval by Annapolis Bancorp, Inc.
shareholders, on the expected terms and schedule; delay in closing the Merger;
difficulties experienced by F.N.B. Corporation in expanding into a new market area, including retention of customers and key personnel of Annapolis
Bancorp, Inc. and its subsidiary BankAnnapolis; difficulties and delays in integrating the
F.N.B. Corporation and Annapolis Bancorp, Inc. businesses or fully realizing cost
savings and other benefits; business disruption following the Merger; changes in asset quality and credit risk; the inability to sustain revenue
and earnings growth; changes in interest rates and capital markets; inflation; customer
acceptance of F.N.B. Corporation’s products and services; customer borrowing,
repayment, investment and deposit practices; customer disintermediation; the introduction, withdrawal, success and timing of business
initiatives; competitive conditions; the inability to realize cost savings or revenues or to
implement integration plans and other consequences associated with mergers,
acquisitions and divestitures; economic conditions; and the impact, extent and timing of technological changes, capital management
activities, and other actions of the Federal Reserve Board and legislative and regulatory
actions and reforms. F.N.B. Corporation undertakes no obligation to revise
these forward-looking statements or to reflect events or circumstances after the date of this presentation.
ADDITIONAL
INFORMATION
ABOUT
THE
MERGER |
 Natural
progression Consistent with stated expansion strategy
Market opportunity
Attractive demographics
Significant commercial banking opportunities
Excellent retail and wealth opportunities
Access to greater Baltimore and Washington
D.C. markets
Execute FNB’s scalable, proven business
model and strong sales management culture
Establishes a 5
th
FNB region (refer to page 5)
Attractive partner
ANNB is a relationship-focused bank with
strong community ties and presence
Opportunity Overview
3
Source:
Deposit
and
demographic
data
per
SNL
Financial;
deposits
as
of
June
30,
2012
(1) Includes branch opened October, 2012 in Waugh Chapel
County
Branches
Deposits in
Market ($000)
HH Income
($ -
2011)
Anne Arundel, MD
(1)
7
298,251
79,692
Queen Anne’s, MD
1
45,107
72,774
FNB Current Wtd Avg. by County
42,332
Attractive Market Entry Opportunity
Markets conducive to FNB’s model
Annapolis Bancorp (ANNB) (8 branches)
(1)
F.N.B. (FNB) (266 branches) |
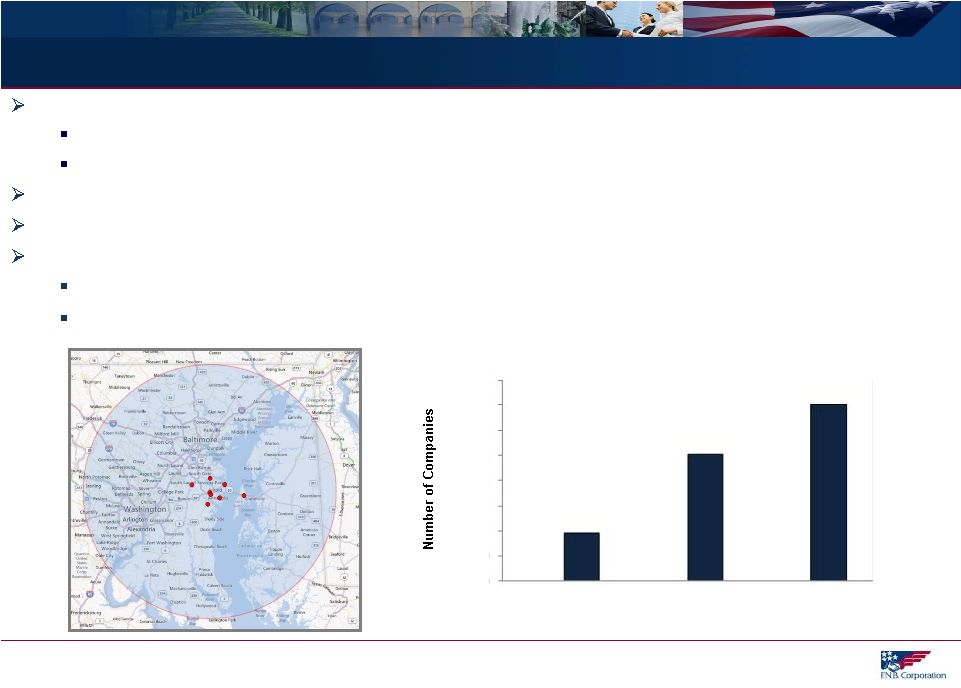 Market Opportunity
4
9,693
25,379
35,072
10,000
15,000
20,000
25,000
30,000
35,000
40,000
>$5 million
$1
$5 million
Total
Revenue
0
5,000
-
Number
of
Commercial
Companies
Within
50-Mile
Radius
of
ANNB
(2)
Leverage FNB’s core competencies and proven business model in a high growth market
Execute FNB’s scalable, cross-functional sales management process
Regional model with local decision making, market leaders, credit authority and functional
support Competitive environment : Similar to FNB’s larger markets
Future
opportunity
for
expansion:
25
identified
banks
in
close
proximity
(1)
Attractive markets present commercial and retail opportunities
Strong demographics present retail, wealth management, private banking and insurance
opportunities Strong commercial opportunities with access to more than 35,000 companies
within 50-mile radius (1)
Source: SNL Financial; Includes banks with assets between $200 million and $5 billion with
NPA’s/assets<4%; Excludes MHC’s, merger targets and banks with 5 or fewer
branches (2)
Source: Hoover’s; Includes companies within a 50-mile radius of ANNB headquarters
with revenue >$5 million, between $1 and $5 million and total companies with
revenue >$1 million |
 5
FNB’s Regional Model
The ANNB transaction will
create a 5
th
FNB region
Benefits of a regional model
Local established
management team with
strong ties to region
Local decision making
Leverage newly created
regional hub to integrate
future acquisitions
Regional Model
Northwest Region
Pittsburgh Region
Central Region
Capital Region
Newly Created
Maryland Region
FNB Regions |
 (1)
Based on FNB stock price as of Friday, October 19, 2012
(2)
Subject to incremental cash pay-out for potential credit-related adjustment
(3)
Dependent upon credit related adjustment
(4)
Excluding one-time costs
Transaction Overview
6
Consideration
$12.09
(1)
per Annapolis Bancorp share
Fixed 1.143x exchange ratio
100% stock
(2)
Credit Related
Adjustment
Maximum additional cash consideration of up to $0.36 per share in cash based
on Annapolis Bancorp’s ability to resolve an agreed upon credit
matter Gross Credit Mark
5% -
6% of loans
(3)
Detailed Due Diligence
Completed
Required Approvals
Customary regulatory and Annapolis Bancorp shareholders
Expected Closing
April 2013
TARP Repayment
Annapolis Bancorp intends to redeem its $4 million of remaining TARP prior to
closing, subject to Treasury approval
Financial Impact
Neutral to tangible book value per share
Highly accretive on a marginal basis to earnings per share
Slightly
accretive
to
total FNB earnings
per
share
in
the
first
full
year
(4) |
 7
Appendix |
 8
Annapolis Bancorp (8 branches)
$297 Million Loan Portfolio
$343 Million of Deposits
Source: SNL Financial and public filings as of June 30, 2012.
Annapolis Bancorp, Inc. Financial Overview
Consumer
3%
C&D
13%
CRE
41%
C&I
16%
Home Equity
12%
1-4 Family
16%
5.66%
Yield:
Savings
38%
Time
Deposits
21%
NOW
10%
Money
Market
15%
Noninterest
Bearing
16%
0.47%
Cost: |
  Annapolis Bancorp, Inc. Financial Highlights
9
Source: SNL Financial and public filings.
($ in millions, except EPS)
Year Ended December 31
Quarter Ended
2008
2009
2010
2011
03/31/12
06/30/12
Balance Sheet
Total Assets
$395
$444
$432
$442
$441
$437
Gross Loans
268
282
280
290
301
297
Total Deposits
301
350
341
350
347
343
Loans / Deposits
89%
80%
82%
83%
87%
87%
Capital
TARP
$0
$8
$8
$8
$8
$4
Common Equity
27
25
27
29
30
31
TCE / TA
6.8%
5.5%
6.2%
6.6%
6.8%
7.0%
Tier 1 Ratio
11.4
12.5
12.8
12.8
12.7
11.8
Total Capital Ratio
12.6
13.7
14.1
14.0
14.0
13.1
Leverage Ratio
8.4
8.6
9.1
9.4
9.6
8.8
Income Statement
Net Income
$1.4
($1.7)
$1.6
$2.2
$0.8
$0.9
ROAA
0.38%
(0.38%)
0.37%
0.50%
0.75%
0.83%
ROAE
5.4
(5.2)
4.7
6.1
8.7
10.4
Net Interest Margin
3.6
3.3
3.7
3.9
3.8
3.9
Efficiency Ratio
70
76
72
69
67
65
Fee Income / Revenue
12
12
11
10
10
10
EPS
$0.35
($0.56)
$0.29
$0.39
$0.18
$0.21
Asset Quality
Reserves / Loans
1.54%
2.81%
2.45%
2.47%
2.25%
2.32%
NPAs / Assets
1.64
4.35
2.35
1.88
1.94
1.97
NCOs / Avg. Loans
0.21
1.00
1.16
0.64
0.79
(0.04) |