Attached files
| file | filename |
|---|---|
| EX-99.2 - TRUIST FINANCIAL CORP | exhibit992.htm |
| EX-99.1 - TRUIST FINANCIAL CORP | exhibit991.htm |
| 8-K - TRUIST FINANCIAL CORP | earn8k3q2012.htm |
Exhibit 99.3

2 Non - GAAP Information This presentation contains financial information and performance measures determined by methods other than in accordance with accounting principles generally accepted in the United States of America (“GAAP”) . BB&T’s management uses these “non - GAAP” measures in their analysis of the corporation’s performance and the efficiency of its operations . Management believes that these non - GAAP measures provide a greater understanding of ongoing operations and enhance comparability of results with prior periods as well as demonstrating the effects of significant gains and charges in the current period . The company believes that a meaningful analysis of its financial performance requires an understanding of the factors underlying that performance . BB&T’s management believes that investors may use these non - GAAP financial measures to analyze financial performance without the impact of unusual items that may obscure trends in the company’s underlying performance . These disclosures should not be viewed as a substitute for financial measures determined in accordance with GAAP, nor are they necessarily comparable to non - GAAP performance measures that may be presented by other companies . In this presentation, these measures are generally marked as “non - GAAP” and are accompanied with disclosure regarding why BB&T’s management believes such measures are useful to investors . Below is a listing of the types of non - GAAP measures used in this presentation : □ Tangible common equity and Tier 1 common equity ratios are non - GAAP measures. BB&T uses the Tier 1 common equity definition used in the SCAP assessment to calculate these ratios. The Basel III Tier I common equity ratio is also a non - GAAP measure and reflects management’s best estim ate of the proposed regulatory requirements, which are subject to change. BB&T’s management uses these measures to assess the quality of capital and believ es that investors may find them useful in their analysis of the corporation. □ Asset quality ratios have been adjusted to remove the impact of acquired loans and foreclosed property covered by FDIC loss s har ing agreements as management believes their inclusion results in distortion of those ratios and may not be comparable to other periods presented or to other portfo lio s that were not impacted by purchase accounting. □ Fee income and efficiency ratios are non - GAAP in that they exclude securities gains (losses), foreclosed property expense, amort ization of intangible assets, merger - related and restructuring charges, the impact of FDIC loss share accounting and other selected items. □ Return on average tangible common shareholders’ equity is a non - GAAP measure that calculates the return on average common shareh olders’ equity without the impact of intangible assets and their related amortization. A reconciliation of these non - GAAP measures to the most directly comparable GAAP measure is included on the Investor Relations s ection of BB&T’s website and as an appendix to this presentation. Forward - Looking Information This presentation contains forward - looking statements with respect to the financial condition, results of operations and businesses of BB&T . Statements that are not historical or current facts or statements about beliefs and expectations are forward - looking statements . Words such as “anticipates,” “believes,” “estimates,” “expects,” “forecasts,” “intends,” “plans,” “projects,” “may,” “will,” “should,” and other similar expressions are intended to identify these forward - looking statements . Forward - looking statements involve certain risks and uncertainties and are based on the beliefs and assumptions of the management of BB&T, and the information available to management at the time that this presentation was prepared . Factors that may cause actual results to differ materially from those contemplated by such forward - looking statements include, among others, the following : ( 1 ) general economic or business conditions, either nationally or regionally, may be less favorable than expected, resulting in, among other things, a deterioration in credit quality and / or a reduced demand for credit or other services ; ( 2 ) disruptions to the credit and financial markets, either nationally or globally, including the impact of a downgrade of U . S . government obligations by one of the credit rating agencies and the adverse effects of the ongoing sovereign debt crisis in Europe ; ( 3 ) changes in the interest rate environment may reduce net interest margins and / or the volumes and values of loans made or held as well as the value of other financial assets held ; ( 4 ) competitive pressures among depository and other financial institutions may increase significantly ; ( 5 ) legislative, regulatory, or accounting changes, including changes resulting from the adoption and implementation of the Dodd - Frank Wall Street Reform and Consumer Protection Act of 2010 , and changes in accounting standards, may adversely affect the businesses in which BB&T is engaged ; ( 6 ) local, state or federal taxing authorities may take tax positions that are adverse to BB&T ; ( 7 ) reduction in BB&T’s credit ratings ; ( 8 ) adverse changes may occur in the securities markets ; ( 9 ) competitors of BB&T may have greater financial resources and develop products that enable them to compete more successfully than BB&T and may be subject to different regulatory standards than BB&T ; ( 10 ) costs or difficulties related to the integration of the businesses of BB&T and its merger partners may be greater than expected ; ( 11 ) unpredictable natural or other disasters could have an adverse effect on BB&T in that such events could materially disrupt BB&T’s operations or the ability or willingness of BB&T’s customers to access the financial services BB&T offers ; ( 12 ) expected cost savings associated with completed mergers and acquisitions may not be fully realized or realized within the expected time frames ; and ( 13 ) deposit attrition, customer loss and/or revenue loss following completed mergers and acquisitions, may be greater than expected . These and other risk factors are more fully described in BB&T’s Annual Report on Form 10 - K for the year ended December 31 , 2011 under the section entitled Item 1 A . “Risk Factors” and from time to time, in other filings with the Securities and Exchange Commission . You are cautioned not to place undue reliance on these forward - looking statements, which speak only as of the date of this presentation . Actual results may differ materially from those expressed in or implied by any forward - looking statements . Except to the extent required by applicable law or regulation, BB&T undertakes no obligation to revise or update publicly any forward - looking statements for any reason .

3 2012 Third Quarter Performance Highlights 1 1 Linked quarter growth rates are annualized, except for credit metrics. 2 Available to common shareholders. 3 Fully taxable equivalent. Includes acquisitions and excludes securities gains or losses, offsets to provisions for covered as set s and other selected items noted on the Quarterly Performance Summary. 4 Excludes covered assets. 5 Fully taxable equivalent. » Net income 2 totaled $469 million, up 28.1% vs. 3Q11 » Diluted EPS totaled $0.66, up 26.9% vs. 3Q11; reduced by $0.04 merger - related charges » Broad - based strong performance » Average loan growth was 12.6% vs. 2Q12 » Loan growth was led by Other Lending Subsidiaries, Mortgage, C&I, Direct Retail and Revolving Credit » Excluding BankAtlantic, average loans increased 8.4% » Average total deposits increased $3.3 billion, or 10.6% vs. 2Q12 » Significant improvement in deposit mix and cost » Excluding BankAtlantic, noninterest - bearing deposits increased 25.0% » NPAs decreased $179 million, or 9.4% 4 vs. 2Q12 » Foreclosed real estate balances decreased $82 million, or 37.1% 4 » Foreclosed property expense decreased $18 million from 2Q12, or 25.0% » Total revenues 3 were $2.5 billion, up 4.4% vs. 2Q12 despite insurance seasonality » YTD total revenues 3 were $7.3 billion, up 12.5% vs. 3Q11 » Net interest income 5 totaled $1.5 billion, up 5.3% vs. 2Q12 » Excluding BankAtlantic and selected items, noninterest expenses increased less than 1% vs. 2Q12

Unusual Items Affecting Earnings $ in millions, except per share impact 4 Pretax After Tax EPS Impact Merger - related and restructuring charges 1 $ 43 $ 27 $ 0.04 Loan processing expenses 2 28 17 0.02 1 Related primarily to BankAtlantic acquisition. No material impact expected in 4Q12. 2 Related to better identification of unrecoverable costs associated with investor - owned loans .

5 Broad - based Loan Growth $103.9 $105.8 $107.5 $109.2 $112.7 $100 $105 $110 $115 3Q11 4Q11 1Q12 2Q12 3Q12 Average Loans Held for Investment ($ in billions) » Experienced strong growth in C&I, mortgage, revolving credit, direct retail, sales finance and other lending subsidiaries (e.g. insurance premium finance and consumer finance) » Loan growth momentum slowed somewhat vs. average balances during the quarter, with EOP loans HFI up $3.1 billion, an annualized rate of 11.0% 1 Excludes loans held for sale. 2 Other lending subsidiaries consist of AFCO/CAFO/Prime Rate, Lendmark, BB&T Equipment Finance, Grandbridge Real Estate Capital , S heffield Financial and Regional Acceptance. C&I $ 37,516 $ 1,223 13.4 % 12.4 % Other CRE 10,823 245 9.2 (0.8) Sales Finance 7,789 99 5.1 5.1 Revolving Credit 2,234 56 10.2 9.5 Residential Mortgage 23,481 1,367 24.6 15.7 Other Lending Subsidiaries 2 9,998 628 26.7 26.7 Direct Retail 15,520 449 11.9 3.5 Subtotal $ 107,361 $ 4,067 15.7 % 11.2 % ADC 1,534 (210) (47.9) (47.9) Covered loans 3,826 (385) (36.4) (36.4) Total $ 112,721 $ 3,472 12.6 % 8.4 % 3Q12 vs. 2Q12 Annualized % Increase (Decrease) Average Loan Growth Highlights 1 ($ in millions) 3Q12 vs. 2Q12 $ Increase (Decrease) 3Q12 Average Balance Excluding BankAtlantic Annualized % Increase (Decrease) » Average total loan growth is expected to be in the 5% to 7% range annualized for 4Q12 including BankAtlantic, contingent on the economy □ Other lending subsidiaries’ growth is expected to be slower due to seasonality □ Mortgage slowing due to 2Q12 decision not to portfolio 10 and 15 year mortgages □ Expecting solid C&I growth in 4Q12

6 Improved Deposit Mix and Cost » Strong organic growth in noninterest - bearing deposits, up 25.0% » Effectively reduced average deposit cost from 0.65% in 3Q11 to 0.42% in 3Q12 » Average CD maturity is 12 months » Management currently expects more modest deposit growth in 4Q12 with continued improvement in mix and lower deposit costs » Achieved YTD growth in net new retail deposit accounts of 49,000 Noninterest - bearing deposits $ 29,990 $ 2,347 33.8 % 25.0 % Interest checking 20,157 246 4.9 (9.8) Money market & savings 47,500 943 8.1 1.5 Subtotal $ 97,647 $3,536 14.9 % 6.0 % Certificates and other time deposits 30,727 (478) (6.1) (8.4) Foreign office deposits – Interest - bearing 321 289 NM NM Total deposits $ 128,695 $ 3,347 10.6 % 3.3 % Average Deposit Growth Highlights ($ in millions) 3Q12 vs.2Q12 Annualized % Increase (Decrease) 3Q12 vs.2Q12 $ Increase (Decrease) 3Q12 Average Balance $115.1 $121.9 $124.6 $125.3 $128.7 0.65% 0.56% 0.49% 0.44% 0.42% 0.20% 0.30% 0.40% 0.50% 0.60% 0.70% $90.0 $100.0 $110.0 $120.0 $130.0 $140.0 3Q11 4Q11 1Q12 2Q12 3Q12 Average Deposits ($ in billions) Total Interest - Bearing Deposit Cost Excluding BankAtlantic Annualized % Increase (Decrease) » Ranked 9 th largest U.S. bank in total deposits at June 30, 2012

Diverse Sources of Revenue » Expanding through additional commercial branches in newer markets » Expanding corporate banking initiative in key national markets; adding new vertical lending team » Executing wealth acceleration plans » Adding capacity in small business, wealth and the broker / dealers » Executing significant Crump opportunities 1 Based on segment revenues, excluding other, treasury and corporate for 3Q12. Community Banking 48% Residential Mortgage Banking 11% Dealer Financial Services 7% Specialized Lending 8% Financial Services 12% Insurance Services 14% Revenue Mix 1 7

8 Broad - based Credit Improvement 1 $2,969 $2,450 $2,256 $1,897 $1,718 $1,500 $2,000 $2,500 $3,000 3Q11 4Q11 1Q12 2Q12 3Q12 Nonperforming Assets ($ in millions) » 9.4% reduction in NPAs vs. 2Q12 □ Commercial NPLs down 8.8% □ Foreclosed real estate down 37.1% » Lowest NPAs in 4 years » Management expects NPAs to improve at a modest pace in 4Q12 assuming: □ No significant economic deterioration □ Excludes impact from loans discharged in bankruptcy that have not been reaffirmed 1 Excludes covered assets. Down 42.1% vs. 3Q11 1.83% 1.45% 1.33% 1.09% 0.97% 0.50% 1.00% 1.50% 2.00% 3Q11 4Q11 1Q12 2Q12 3Q12 Total Nonperforming Assets as a Percentage of Total Assets

9 Foreclosed Real Estate and Losses Decrease 1 $950 $536 $378 $221 $139 $168 $346 $92 $72 $54 - $100 $0 $100 $200 $300 $400 $0 $200 $400 $600 $800 $1,000 3Q11 4Q11 1Q12 2Q12 3Q12 Foreclosed Real Estate ($ in millions) Foreclosed Real Estate Foreclosed Property Expense » Significant reduction in foreclosed real estate, down 37.1% vs. 2Q12 » Foreclosed property expense decreased $18 million or 25.0% compared with 2Q12 1 Excludes covered assets and the related allowance for covered loans and covered charge - offs Foreclosed Real Estate down 85.4% vs. 3Q11 1.44% 1.46% 1.28% 1.22% 1.08% 1.00% 1.10% 1.20% 1.30% 1.40% 1.50% 3Q11 4Q11 1Q12 2Q12 3Q12 Net Charge - offs / Average Loans » 3Q12 net charge - offs were $303 million, down 17.2% vs. 3Q11 » Lowest charge - offs in 4 years » Expect total charge - offs to be in a similar range in 4Q12 and to trend lower thereafter, excluding any impact from loans discharged in bankruptcy that have not been reaffirmed

4.09% 4.02% 3.93% 3.95% 3.94% 3.41% 3.44% 3.41% 3.45% 3.51% 3.00% 3.50% 4.00% 4.50% 3Q11 4Q11 1Q12 2Q12 3Q12 Net Interest Margin Reported NIM Core NIM 1 10 Margin Remains Strong » Management expects the margin to be in the mid 3.70s% range in 4Q12 driven by: □ Lower rates on new earning assets □ Higher long - term debt cost □ Runoff of covered assets » Offset by: □ Improving asset mix from specialized lending over time □ Slowing CRE runoff □ Lower deposit cost » Declining benefit to margin through 2015 from loss share assets » Margin impact will be greater than net income impact due to declining fee income offset » Excluding the impact of covered asset purchase accounting, the net interest margin has been stable since 4Q10 » This disclosure reflects the accounting impact - actual performance of the Colonial acquisition has been tremendously positive for revenues, loans and deposits 1 Excludes Colonial assets. 2 Amounts are estimated and are subject to change each quarter as cash flows are reassessed. $900 $600 $250 $150 ($300) ($200) ($100) ($70) ($500) $0 $500 $1,000 2012 2013 2014 2015 ($ in millions) Estimated Net Revenue from Covered Assets 2 Accretable Yield Fee Income Offset
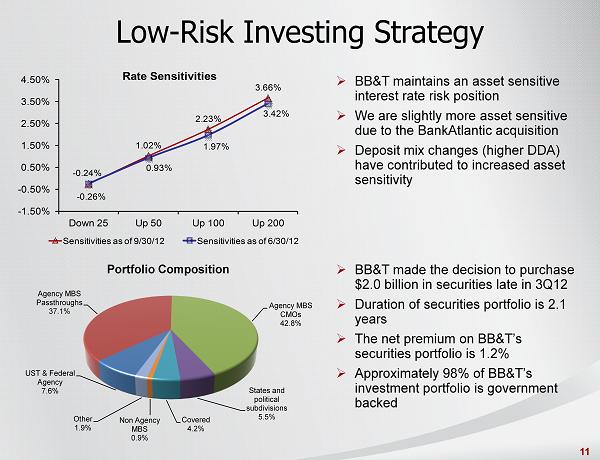
11 Low - Risk Investing Strategy UST & Federal Agency 7.6% Agency MBS Passthroughs 37.1% Agency MBS CMOs 42.8% States and political subdivisions 5.5% Covered 4.2% Non Agency MBS 0.9% Other 1.9% Portfolio Composition » BB&T maintains an asset sensitive interest rate risk position » We are slightly more asset sensitive due to the BankAtlantic acquisition » Deposit mix changes (higher DDA) have contributed to increased asset sensitivity » BB&T made the decision to purchase $2.0 billion in securities late in 3Q12 » Duration of securities portfolio is 2.1 years » The net premium on BB&T’s securities portfolio is 1.2% » Approximately 98% of BB&T’s investment portfolio is government backed - 0.26% 1.02% 2.23% 3.66% - 0.24% 0.93% 1.97% 3.42% - 1.50% - 0.50% 0.50% 1.50% 2.50% 3.50% 4.50% Down 25 Up 50 Up 100 Up 200 Rate Sensitivities Sensitivities as of 9/30/12 Sensitivities as of 6/30/12

12 Fee Income Growth 39.3% 38.4% 41.0% 42.4% 42.4% 32.0% 36.0% 40.0% 44.0% 48.0% 3Q11 4Q11 1Q12 2Q12 3Q12 Fee Income Ratio 1 1 Excludes securities gains (losses), the impact of FDIC loss share accounting and other selected items. See non - GAAP Reconciliat ions included in the attached Appendix. 2 Linked quarter percentages are annualized. 3Q12 3Q12 v. 2Q12 2 Increase (Decrease) 3Q12 v. 3Q11 Increase (Decrease) Insurance income $ 333 (60.7) % 38.2 % Service charges on deposits 142 11.5 0.7 Mortgage banking income 211 63.4 71.5 Investment banking and brokerage fees and commissions 90 9.0 11.1 Checkcard fees 48 26.5 (38.5) Bankcard fees and merchant discounts 62 20.2 21.6 Trust and investment advisory revenues 46 - 7.0 Income from bank - owned life insurance 30 44.2 (9.1) FDIC loss share income, net (90) 86.0 (13.5) Securities gains (losses), net (1) (198.9) (97.4) Other income 92 174.0 119.0 Total noninterest income $ 963 (1.2) % 39.6 % » Insurance income decreased $60 million compared to 2Q12, primarily due to seasonal factors » Mortgage banking income increased $29 million compared to the prior quarter due to $36 million from higher mortgage production and margins » FDIC loss share income was worse $16 million compared to 2Q12 primarily as a result of a lower offset to the provision for covered loans » Other income increased $28 million vs. 2Q12 primarily due to a $17 million increase in income related to post employment benefits and an $8 million increase in income related to private equity and other similar investments » BankAtlantic added $12 million to noninterest income Noninterest Income ($ in millions) » Insurance revenue is expected to be seasonally stronger in 4Q12 » Mortgage revenues are expected to remain strong in 4Q12
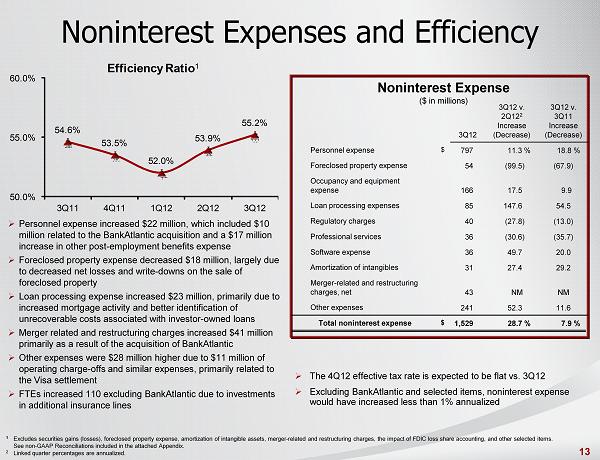
13 Noninterest Expenses and Efficiency 3Q12 3Q12 v. 2Q12 2 Increase (Decrease) 3Q12 v. 3Q11 Increase (Decrease) Personnel expense $ 797 11.3 % 18.8 % Foreclosed property expense 54 (99.5) (67.9) Occupancy and equipment expense 166 17.5 9.9 Loan processing expenses 85 147.6 54.5 Regulatory charges 40 (27.8) (13.0) Professional services 36 (30.6) (35.7) Software expense 36 49.7 20.0 Amortization of intangibles 31 27.4 29.2 Merger - related and restructuring charges, net 43 NM NM Other expenses 241 52.3 11.6 Total noninterest expense $ 1,529 28.7 % 7.9 % » The 4Q12 effective tax rate is expected to be flat vs. 3Q12 » Excluding BankAtlantic and selected items, noninterest expense would have increased less than 1% annualized 1 Excludes securities gains (losses), foreclosed property expense, amortization of intangible assets, merger - related and restructu ring charges, the impact of FDIC loss share accounting, and other selected items. See non - GAAP Reconciliations included in the attached Appendix. 2 Linked quarter percentages are annualized. 54.6% 53.5% 52.0% 53.9% 55.2% 50.0% 55.0% 60.0% 3Q11 4Q11 1Q12 2Q12 3Q12 Efficiency Ratio 1 Noninterest Expense ($ in millions) » Personnel expense increased $22 million, which included $10 million related to the BankAtlantic acquisition and a $17 million increase in other post - employment benefits expense » Foreclosed property expense decreased $18 million, largely due to decreased net losses and write - downs on the sale of foreclosed property » Loan processing expense increased $23 million, primarily due to increased mortgage activity and better identification of unrecoverable costs associated with investor - owned loans » Merger related and restructuring charges increased $41 million primarily as a result of the acquisition of BankAtlantic » Other expenses were $28 million higher due to $11 million of operating charge - offs and similar expenses, primarily related to the Visa settlement » FTEs increased 110 excluding BankAtlantic due to investments in additional insurance lines

14 Capital Strength 1 9.8% 9.7% 10.0% 9.7% 9.5% 8.0% 9.0% 10.0% 11.0% 3Q11 4Q11 1Q12 2Q12 3Q12 Basel I Tier 1 Common Ratio 1 Current quarter regulatory capital information is preliminary. Risk - weighted assets are determined based on regulatory capital r equirements. Under the regulatory framework for determining risk - weighted assets each asset class is assigned a risk - weighting of 0%, 20%, 50% or 100% based on the underlying risk of the specific asset class. In addition, off balance sheet exposures are first converted to a balance sheet equivalent amount and subsequently assigned to one of the four risk - weightings. Tier 1 common equity ratio is a no n - GAAP measure. BB&T uses the Tier 1 common equity definition used in the SCAP assessment to calculate these ratios. BB&T's management uses these measures to assess the quality of capital and be lie ves that investors may find them useful in their analysis of the Corporation. These capital measures are not necessarily comparable to similar capital measures that may be presented by othe r c ompanies. 2 The Basel III Tier I common equity ratio is also a non - GAAP measure and reflects management’s best estimate of the proposed regu latory requirements, which are subject to change. » Tier 1 common remains strong following the acquisitions of Crump and BankAtlantic » BB&T currently estimates Tier 1 common under Basel III 2 to be: □ 8.0% under the U.S. proposed rules (NPR) □ 9.2% under international rules (potentially to be used in the 2013 CCAR process) □ Basel III estimate does not include any mitigating actions which will result in higher capital ratios » BB&T has financial flexibility to take advantage of opportunities as they arise » BB&T successfully issued two perpetual preferred transactions and has filled 115 bps of the 150 bps of Tier 1 capacity under the proposed U.S. rules
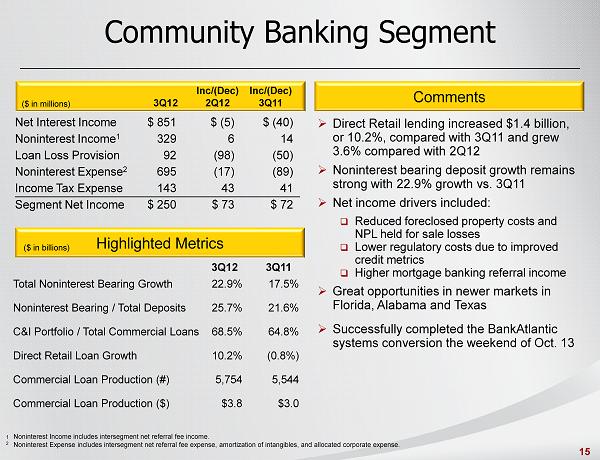
15 Community Banking Segment Net Interest Income Noninterest Income 1 Loan Loss Provision Noninterest Expense 2 Income Tax Expense Segment Net Income $ 851 329 92 695 143 $ 250 $ (5) 6 (98) (17) 43 $ 73 $ (40) 14 (50) (89) 41 $ 72 Total Noninterest Bearing Growth Noninterest Bearing / Total Deposits C&I Portfolio / Total Commercial Loans Direct Retail Loan Growth Commercial Loan Production (#) Commercial Loan Production ($) Comments Highlighted Metrics 3Q12 3Q11 ($ in millions) Inc/(Dec) 2Q12 Inc/(Dec) 3Q11 3Q12 ($ in billions) 1 Noninterest Income includes intersegment net referral fee income. 2 Noninterest Expense includes intersegment net referral fee expense, amortization of intangibles, and allocated corporate expe ns e. » Direct Retail lending increased $1.4 billion, or 10.2%, compared with 3Q11 and grew 3.6% compared with 2Q12 » Noninterest bearing deposit growth remains strong with 22.9% growth vs. 3Q11 » Net income drivers included: □ Reduced foreclosed property costs and NPL held for sale losses □ Lower regulatory costs due to improved credit metrics □ Higher mortgage banking referral income » Great opportunities in newer markets in Florida, Alabama and Texas » Successfully completed the BankAtlantic systems conversion the weekend of Oct. 13 22.9% 25.7% 68.5% 10.2% 5,754 $3.8 17.5% 21.6% 64.8% (0.8%) 5,544 $3.0
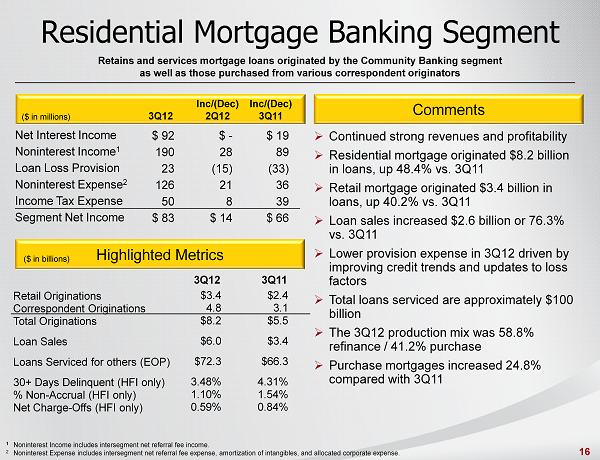
16 Net Interest Income Noninterest Income 1 Loan Loss Provision Noninterest Expense 2 Income Tax Expense Segment Net Income Retail Originations Correspondent Originations Total Originations Loan Sales Loans Serviced for others (EOP) 30+ Days Delinquent (HFI only) % Non - Accrual (HFI only) Net Charge - Offs (HFI only) Residential Mortgage Banking Segment Retains and services mortgage loans originated by the Community Banking segment as well as those purchased from various correspondent originators Comments Highlighted Metrics ($ in millions) Inc/(Dec) 2Q12 Inc/(Dec) 3Q11 3Q12 3Q12 3Q11 1 Noninterest Income includes intersegment net referral fee income. 2 Noninterest Expense includes intersegment net referral fee expense, amortization of intangibles, and allocated corporate expe ns e. $ 92 190 23 126 50 $ 83 $ - 28 (15) 21 8 $ 14 $ 19 89 (33) 36 39 $ 66 ($ in billions) $3.4 4.8 $8.2 $6.0 $72.3 3.48% 1.10% 0.59% $2.4 3.1 $5.5 $3.4 $66.3 4.31% 1.54% 0.84% » Continued strong revenues and profitability » Residential mortgage originated $8.2 billion in loans, up 48.4% vs. 3Q11 » Retail mortgage originated $3.4 billion in loans, up 40.2% vs. 3Q11 » Loan sales increased $2.6 billion or 76.3% vs. 3Q11 » Lower provision expense in 3Q12 driven by improving credit trends and updates to loss factors » Total loans serviced are approximately $100 billion » The 3Q12 production mix was 58.8% refinance / 41.2% purchase » Purchase mortgages increased 24.8% compared with 3Q11

17 Net Interest Income Noninterest Income 1 Loan Loss Provision Noninterest Expense 2 Income Tax Expense Segment Net Income Primarily originates indirect to consumers on a prime and nonprime basis for the purchase of automobiles and other vehicles through approved dealers both in BB&T’s market and nationally (through Regional Acceptance Corporation) Dealer Financial Services Segment Comments Highlighted Metrics ($ in millions) Inc/(Dec) 2Q12 Inc/(Dec) 3Q11 3Q12 3Q12 3Q11 1 Noninterest Income includes intersegment net referral fee income. 2 Noninterest Expense includes intersegment net referral fee expense, amortization of intangibles, and allocated corporate expe ns e. $ 160 1 43 33 32 $ 53 $ 4 (1) 16 (2) (4) $ (7) $ 10 - 19 2 (4) $ (7) ($ in billions) » YTD loan production is up 9.1% » Regional Acceptance continued to drive higher net interest income due to loan portfolio growth and increased margins vs. 3Q11 » Growing in new markets – Texas and Alabama » Increased focus on financing inventory for auto dealers through floor plan lending » Excluding the provision expense increase, the operating margin was 64.6% for the current quarter » Net charge - offs increased due to seasonal factors at Regional Acceptance vs. 2Q12 Loan Originations Loan Yield Operating Margin Net Charge - offs $1.2 8.4% 52.8% 1.2% $1.2 9.1% 63.6% 1.1%

18 Specialized Lending Segment Provides specialty lending including: commercial finance, mortgage warehouse lending, tax - exempt governmental finance, equipment leasing, commercial mortgage banking, insurance premium finance, dealer - based equipment financing, and direct consumer finance Net Interest Income Noninterest Income 1 Loan Loss Provision Noninterest Expense 2 Income Tax Expense Segment Net Income Loan Originations Loan Yield Operating Margin Net Charge - offs Comments Highlighted Metrics ($ in millions) Inc/(Dec) 2Q12 Inc/(Dec) 3Q11 3Q12 3Q12 3Q11 $ 143 58 65 87 6 $ 43 $ 8 6 41 8 (13) $ (22) $ 24 5 39 7 (6) $ (11) 1 Noninterest Income includes intersegment net referral fee income. 2 Noninterest Expense includes intersegment net referral fee expense, amortization of intangibles, and allocated corporate expe ns e. ($ in billions) $4.8 5.1% 24.4% 0.8% $5.0 5.5% 38.4% 0.7% » Loan growth was strong in 3Q12, with average loans up 16.2% vs. 3Q11 » YTD loan production increased 15.1% » Higher net interest income was driven by: □ Small ticket consumer financing, with average loans up 48% vs. 3Q11 □ Mortgage Warehouse Lending, with average loans up 108% vs. 3Q11 » Generated $607 million in closed commercial mortgage loan referrals, with $6.7 million in fees compared to $367 million and $4.5 million, respectively, in 3Q11 » BB&T Equipment Finance is expanding it’s Large Corporate segment outside of BB&T’s traditional banking footprint » Excluding the provision expense increase, the operating margin was 43.8% for the current quarter

19 1 Noninterest Income includes intersegment net referral fee income. 2 Noninterest Expense includes intersegment net referral fee expense, amortization of intangibles, and allocated corporate expe nse . 3 Nine months of current year over nine months of prior year. Insurance Segment Comments Highlighted Metrics Net Interest Income Noninterest Income 1 Loan Loss Provision Noninterest Expense 2 Income Tax Expense Segment Net Income $ 2 (59) - 14 (21) $ (50) $ - 95 - 85 4 $ 6 YTD Same Store Sales Growth 3 YTD Noninterest Income Growth 3 Number of Stores Operating Margin Provides property and casualty, life, and health insurance to business and individual clients. It also provides workers compensation and professional liability, as well as surety coverage and title insurance ($ in millions) Inc/(Dec) 2Q12 Inc/(Dec) 3Q11 3Q12 3Q12 3Q11 $ 2 334 - 310 10 $ 16 » YTD noninterest income was up 27.0% driven by organic and strategic growth through acquisitions » Operating margin increase resulted from improved insurance market conditions » Insurance pricing continues to firm, demonstrated by the improved premium pricing trends realized over the past several quarters » Focusing on successful execution of synergies presented by Crump Group acquisition » BB&T Insurance continues to experience strong retail retention rates above 90% 3.9% 27.0% 212 7.7% 1.6% 0.2% 160 6.6%

20 Financial Services Segment Comments Highlighted Metrics Net Interest Income Noninterest Income 1 Loan Loss Provision Noninterest Expense 2 Income Tax Expense Segment Net Income $ 2 15 20 (18) 7 $ 8 $ 16 12 11 15 1 $ 1 Average Loan Balances Average Deposits Total Assets Invested Operating Margin Provides trust services, wealth management, investment counseling, asset management, estate planning, employee benefits, corporate banking, and capital market services to individuals, corporations, governments, and other organizations 3Q12 3Q11 ($ in millions) Inc/(Dec) 2Q12 Inc/(Dec) 3Q11 3Q12 1 Noninterest Income includes intersegment net referral fee income. 2 Noninterest Expense includes intersegment net referral fee expense, amortization of intangibles, and allocated corporate expe nse . $ 114 190 12 178 43 $ 71 ($ in billions) $7.3 $31.5 $94.7 37.5% $5.0 $22.4 $86.5 40.6% » Higher net interest income driven by: □ Corporate Banking which generated 49.6% growth in loans vs. 3Q11 □ BB&T Wealth which generated 32.7% loan growth and 34.7% transaction deposit growth vs. 3Q11 » Total loan commitments for Corporate Banking are $17.4 billion , up $1.1 billion from the end of 2Q12 » Corporate loan commitments currently average $33.3 million » Total assets invested increased 9.5% vs. 3Q11 to $94.7 billion » Investment Banking and Brokerage fees increased 8.8% vs. 2Q12 and 9.9% vs. 3Q11

21

22

23 Non - GAAP Capital Measures (Dollars in millions, except per share data) As of / Quarter Ended Sept 30 2012 June 30 2012 March 31 2012 Dec 31 2011 Sept 30 2011 Selected Capital Information 1 Risk - based capital Tier 1 $ 13,590 $ 12,383 $ 15,207 $ 14,913 $ 14,696 Total 17,533 16,433 19,342 18,802 18,837 Risk - weighted assets 2 125,164 121,922 119,042 119,725 117,020 Average quarterly tangible assets 172,074 170,042 167,771 165,349 159,268 Risk - based capital ratios Tier 1 10.9 % 10.2 % 12.8 % 12.5 % 12.6 % Total 14.0 13.5 16.2 15.7 16.1 Leverage capital ratio 7.9 7.3 9.1 9.0 9.2 Equity as a percentage of total assets 11.3 10.6 10.2 10.0 10.5 Book value per common share $ 26.88 $ 26.19 $ 25.51 $ 24.98 $ 25.07 Selected non - GAAP Capital Information 3 Tangible common equity as a percentage of tangible assets 6.8 % 6.9 % 7.1 % 6.9 % 7.1 % Tier 1 common equity as a percentage of risk - weighted assets 9.5 9.7 10.0 9.7 9.8 Tangible book value per common share $ 17.02 $ 16.92 $ 17.12 $ 16.73 $16.42 1 Current quarter regulatory capital information is preliminary. 2 Risk - weighted assets are determined based on regulatory capital requirements. Under the regulatory framework for determining ri sk - weighted assets each asset class is assigned a risk - weighting of 0%, 20%, 50% or 100% based on the underlying risk of the specific asset class. In addition, off balance sheet e xpo sures are first converted to a balance sheet equivalent amount and subsequently assigned to one of the four risk - weightings. 3 Tangible common equity and Tier 1 common equity ratios are non - GAAP measures. BB&T uses the Tier 1 common equity definition use d in the SCAP assessment to calculate these ratios. BB&T's management uses these measures to assess the quality of capital and believes that investors may find them useful in th eir analysis of the Corporation. These capital measures are not necessarily comparable to similar capital measures that may be presented by other companies.

24 Non - GAAP Capital Measures (Dollars in millions, except per share data) As of / Quarter Ended Sept 30 2012 June 30 2012 March 31 2012 Dec 31 2011 Sept 30 2011 Calculations of Tier 1 common equity and tangible assets and related measures: Tier 1 equity $ 13,590 $ 12,383 $ 15,207 $ 14,913 $ 14,696 Less: Preferred Stock 1,679 559 - - - Qualifying restricted core capital elements 5 - 3,250 3,250 3,249 Tier 1 common equity 11,906 11,824 11,957 11,663 11,447 Total assets $ 182,021 $ 178,529 $ 174,752 $ 174,579 $ 167,677 Less: Intangible assets, net of deferred taxes 7,239 6,950 6,402 6,406 6,330 Plus: Regulatory adjustments, net of deferred taxes 81 239 327 421 99 Tangible assets 174,863 171,818 168,677 168,594 161,446 Total risk - weighted assets 1 $125,164 $ 121,922 $ 119,042 $ 119,725 $ 117,020 Tangible common equity as a percentage of tangible assets 6.8 % 6.9% 7.1 % 6.9 % 7.1 % Tier 1 common equity as a percentage of risk - weighted assets 9.5 9.7 10.0 9.7 9.8 Tier 1 common equity $ 11,906 $ 11,824 $ 11,957 $ 11,663 $ 11,447 Outstanding shares at end of period (in thousands) 699,541 698,795 698,454 697,143 697,101 Tangible book value per common share $ 17.02 $ 16.92 $ 17.12 $ 16.73 $ 16.42 1 Risk - weighted assets are determined based on regulatory capital requirements. Under the regulatory framework for determining ri sk - weighted assets each asset class is assigned a risk - weighting of 0%, 20%, 50% or 100% based on the underlying risk of the specific asset class. In addition, off balance sheet e xpo sures are first converted to a balance sheet equivalent amount and subsequently assigned to one of the four risk - weightings.

Non - GAAP Capital Measures 1 1 The Basel III calculations are non - GAAP measures and reflect adjustments for the related elements as proposed by regulatory auth orities, which are subject to change. BB&T management uses these measures to assess the quality of capital and believes that investors may find them useful in their analysis of the Corporation. These c api tal measures are not necessarily comparable to similar capital measures that may be presented by other companies. Basel III Estimates Based on Proposed U.S. Rules (Dollars in millions) Sept 30 2012 June 30 2012 Tier 1 common equity under Basel 1 definition $ 11,906 $ 11,824 Adjustments: Other comprehensive income related to AFS securities, defined benefit pension and other postretirement employee benefit plans (226) (365) Other adjustments (54) (12) Estimated Tier 1 common equity under Basel III definition $ 11,626 $ 11,447 Estimated risk - weighted assets under Basel III definition $ 145,848 $ 139,307 Estimated Tier 1 common equity as a percentage of risk - weighted assets under Basel III definition 8.0 % 8.2 % 25 Basel III Estimates Based on Proposed International Rules (Dollars in millions) Sept 30 2012 June 30 2012 Tier 1 common equity under Basel 1 definition $ 11,906 $ 11,824 Adjustments: Other comprehensive income related to AFS securities, defined benefit pension and other postretirement employee benefit plans (226) (365) Other adjustments (54) (12) Estimated Tier 1 common equity under Basel III definition (International) $ 11,626 $ 11,447 Estimated risk - weighted assets under Basel III definition( International) $ 126,572 $ 123,888 Estimated Tier 1 common equity as a percentage of risk - weighted assets under Basel III definition 9.2 % 9.2 %

26 Non - GAAP Reconciliations Applicable ratios are annualized. 1 Excludes mortgage loans guaranteed by GNMA that BB&T does not have the obligation to repurchase. 2 Excludes mortgage loans guaranteed by the government. As of / Quarter Ended Sept 30 2012 June 30 2012 March 31 2012 Dec 31 2011 Sept 30 2011 Asset Quality Ratios (including amounts related to covered loans and covered foreclosed property) Loans 30 - 89 days past due and still accruing as a percentage of total loans and leases 1,2 1.02 % 0.97 % 1.02 % 1.22 % 1.18 % Loans 90 days or more past due and still accruing as a percentage of total loans and leases 1,2 0.53 0.67 0.75 0.84 0.99 Nonperforming loans and leases as a percentage of total loans and leases 1.31 1.45 1.67 1.68 1.85 Nonperforming assets as a percentage of: Total assets 1.10 1.24 1.50 1.62 1.98 Loans and leases plus foreclosed property 1.70 1.93 2.35 2.52 3.05 Net charge - offs as a percentage of average loans and leases 1.05 1.21 1.28 1.44 1.57 Allowance for loan and lease losses as a percentage of loans and leases held for investment 1.80 1.91 2.02 2.10 2.25 Ratio of allowance for loan and lease losses to: Net charge - offs 1.69 X 1.57 X 1.54 X 1.45 X 1.42 X Nonperforming loans and leases held for investment 1.33 1.29 1.18 1.21 1.20
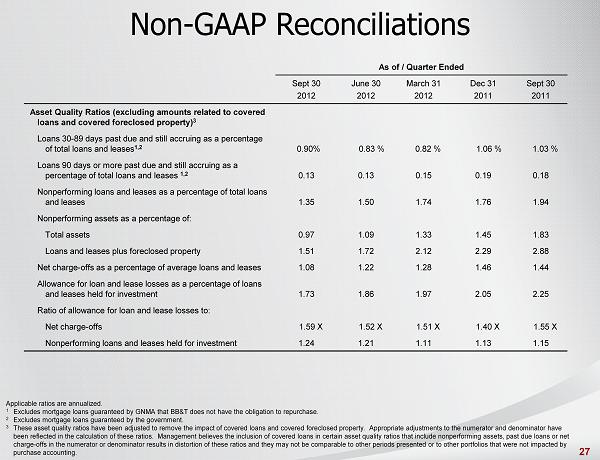
27 Non - GAAP Reconciliations Applicable ratios are annualized. 1 Excludes mortgage loans guaranteed by GNMA that BB&T does not have the obligation to repurchase. 2 Excludes mortgage loans guaranteed by the government. 3 These asset quality ratios have been adjusted to remove the impact of covered loans and covered foreclosed property. Appropr ia te adjustments to the numerator and denominator have been reflected in the calculation of these ratios. Management believes the inclusion of covered loans in certain asset quali ty ratios that include nonperforming assets, past due loans or net charge - offs in the numerator or denominator results in distortion of these ratios and they may not be comparable to other period s presented or to other portfolios that were not impacted by purchase accounting. As of / Quarter Ended Sept 30 2012 June 30 2012 March 31 2012 Dec 31 2011 Sept 30 2011 Asset Quality Ratios (excluding amounts related to covered loans and covered foreclosed property) 3 Loans 30 - 89 days past due and still accruing as a percentage of total loans and leases 1,2 0.90% 0.83 % 0.82 % 1.06 % 1.03 % Loans 90 days or more past due and still accruing as a percentage of total loans and leases 1,2 0.13 0.13 0.15 0.19 0.18 Nonperforming loans and leases as a percentage of total loans and leases 1.35 1.50 1.74 1.76 1.94 Nonperforming assets as a percentage of: Total assets 0.97 1.09 1.33 1.45 1.83 Loans and leases plus foreclosed property 1.51 1.72 2.12 2.29 2.88 Net charge - offs as a percentage of average loans and leases 1.08 1.22 1.28 1.46 1.44 Allowance for loan and lease losses as a percentage of loans and leases held for investment 1.73 1.86 1.97 2.05 2.25 Ratio of allowance for loan and lease losses to: Net charge - offs 1.59 X 1.52 X 1.51 X 1.40 X 1.55 X Nonperforming loans and leases held for investment 1.24 1.21 1.11 1.13 1.15
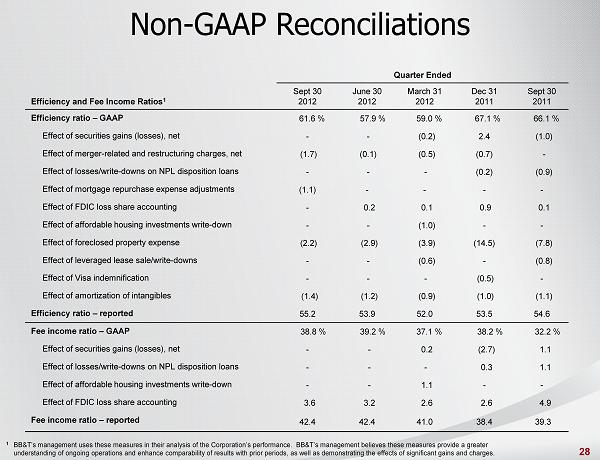
28 Non - GAAP Reconciliations Quarter Ended Efficiency and Fee Income Ratios 1 Sept 30 2012 June 30 2012 March 31 2012 Dec 31 2011 Sept 30 2011 Efficiency ratio – GAAP 61.6 % 57.9 % 59.0 % 67.1 % 66.1 % Effect of securities gains (losses), net - - (0.2) 2.4 (1.0) Effect of merger - related and restructuring charges, net (1.7) (0.1) (0.5) (0.7) - Effect of losses/write - downs on NPL disposition loans - - - (0.2) (0.9) Effect of mortgage repurchase expense adjustments (1.1) - - - - Effect of FDIC loss share accounting - 0.2 0.1 0.9 0.1 Effect of affordable housing investments write - down - - (1.0) - - Effect of foreclosed property expense (2.2) (2.9) (3.9) (14.5) (7.8) Effect of leveraged lease sale/write - downs - - (0.6) - (0.8) Effect of Visa indemnification - - - (0.5) - Effect of amortization of intangibles (1.4) (1.2) (0.9) (1.0) (1.1) Efficiency ratio – reported 55.2 53.9 52.0 53.5 54.6 Fee income ratio – GAAP 38.8 % 39.2 % 37.1 % 38.2 % 32.2 % Effect of securities gains (losses), net - - 0.2 (2.7) 1.1 Effect of losses/write - downs on NPL disposition loans - - - 0.3 1.1 Effect of affordable housing investments write - down - - 1.1 - - Effect of FDIC loss share accounting 3.6 3.2 2.6 2.6 4.9 Fee income ratio – reported 42.4 42.4 41.0 38.4 39.3 1 BB&T’s management uses these measures in their analysis of the Corporation’s performance. BB&T’s management believes these m eas ures provide a greater understanding of ongoing operations and enhance comparability of results with prior periods, as well as demonstrating the eff ect s of significant gains and charges.
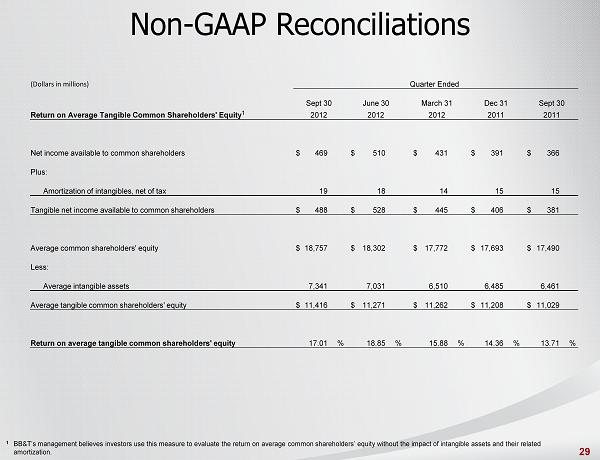
29 Non - GAAP Reconciliations 1 BB&T’s management believes investors use this measure to evaluate the return on average common shareholders’ equity without t he impact of intangible assets and their related amortization. (Dollars in millions) Quarter Ended Sept 30 June 30 March 31 Dec 31 Sept 30 Return on Average Tangible Common Shareholders' Equity 1 2012 2012 2012 2011 2011 Net income available to common shareholders $ 469 $ 510 $ 431 $ 391 $ 366 Plus: Amortization of intangibles, net of tax 19 18 14 15 15 Tangible net income available to common shareholders $ 488 $ 528 $ 445 $ 406 $ 381 Average common shareholders' equity $ 18,757 $ 18,302 $ 17,772 $ 17,693 $ 17,490 Less: Average intangible assets 7,341 7,031 6,510 6,485 6,461 Average tangible common shareholders' equity $ 11,416 $ 11,271 $ 11,262 $ 11,208 $ 11,029 Return on average tangible common shareholders' equity 17.01 % 18.85 % 15.88 % 14.36 % 13.71 %
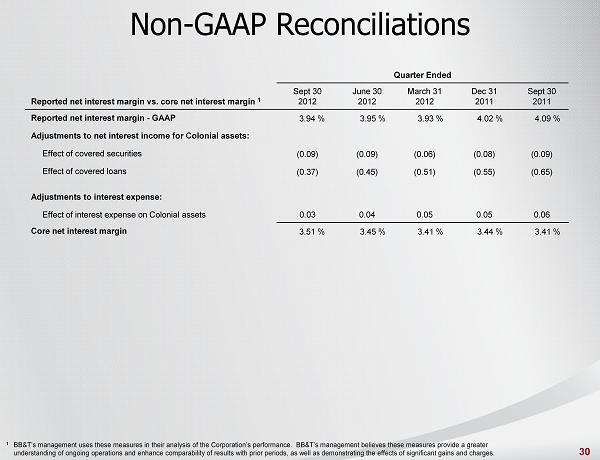
30 Non - GAAP Reconciliations Quarter Ended Reported net interest margin vs. core net interest margin 1 Sept 30 2012 June 30 2012 March 31 2012 Dec 31 2011 Sept 30 2011 Reported net interest margin - GAAP 3.94 % 3.95 % 3.93 % 4.02 % 4.09 % Adjustments to net interest income for Colonial assets: Effect of covered securities (0.09) (0.09) (0.06) (0.08) (0.09) Effect of covered loans (0.37) (0.45) (0.51) (0.55) (0.65) Adjustments to interest expense: Effect of interest expense on Colonial assets 0.03 0.04 0.05 0.05 0.06 Core net interest margin 3.51 % 3.45 % 3.41 % 3.44 % 3.41 % 1 BB&T’s management uses these measures in their analysis of the Corporation’s performance. BB&T’s management believes these m eas ures provide a greater understanding of ongoing operations and enhance comparability of results with prior periods, as well as demonstrating the eff ect s of significant gains and charges.

31