Attached files
| file | filename |
|---|---|
| 8-K - 8-K - Thompson Creek Metals Co Inc. | a12-24293_18k.htm |
Exhibit 99.1
|
|
A Growing, Diversified North American Mining Company October 2012 |
|
|
Cautionary Statements This document contains “forward-looking statements” within the meaning of the United States Private Securities Litigation Reform Act of 1995, Section 27A of the Securities Act of 1933, as amended, Section 21E of the Securities Act of 1934, as amended and applicable Canadian securities legislation, which are intended to be covered by the safe harbor created by those sections and other applicable laws. These forward-looking statements generally are identified by the words "believe," "project," "expect," "anticipate," "estimate," "intend," "future," "opportunity," "plan," "may," "should," "will," "would," "will be," "will continue," "will likely result," and similar expressions. Our forward-looking statements include statements with respect to: the future financial or operating performance of the Company or its subsidiaries and its projects; access to existing or future financing arrangements, future inventory, production, sales, cash costs, capital expenditures and exploration expenditures; future earnings and operating results; expected concentrate and recovery grades; statements as to the projected development of Mt. Milligan and other projects, including expected production commencement dates; Mt. Milligan development costs; future operating plans and goals; and future molybdenum prices. Where we express an expectation or belief as to future events or results, such expectation or belief is expressed in good faith and believed to have a reasonable basis. However, our forward-looking statements are based on current expectations and assumptions that are subject to risks and uncertainties which may cause actual results to differ materially from future results expressed, projected or implied by those forward-looking statements. Important factors that could cause actual results and events to differ from those described in such forward-looking statements can be found in the section entitled ‘‘Risk Factors’’ in Thompson Creek’s Annual Report on Form 10-K for the year ended December 31, 2011, Quarterly Reports on Form 10-Q and other documents filed on EDGAR at www.sec.gov and on SEDAR at www.sedar.com. Although we have attempted to identify those factors that could cause actual results or events to differ from those described in such forward-looking statements, there may be other factors that cause results or events to differ from those anticipated, estimated or intended. Many of these factors are beyond our ability to control or predict. Given these uncertainties, the reader is cautioned not to place undue reliance on our forward-looking statements. We undertake no obligation to update or revise publicly any forward-looking statements, whether as a result of new information, future events, or otherwise, and investors should not assume that any lack of update to a previously issued forward-looking statement constitutes a reaffirmation of that statement. Cautionary Note to our United States and Other Investors Concerning Estimates of Measured, Indicated and Inferred Mineral Resources: This presentation uses the terms “Measured”, “Indicated” and “Inferred” Resources. United States investors are advised that while such terms are recognized by Canadian regulations, the United States Securities and Exchange Commission (the “SEC”) only permits United States mining companies, in their filings with the SEC, to disclose those mineral deposits that a company can economically and legally extract or produce in accordance with SEC Industry Guide 7. Our United States and other investors are cautioned not to assume that all or any part of Measured or Indicated Mineral Resources will ever be converted into Mineral Reserves or that all or any part of an Inferred Mineral Resource exists, or is economically or legally mineable. Compliance with NI 43-101 Unless otherwise indicated, we have prepared the technical information in this presentation (“Technical Information”) based on information contained in the technical reports available under our company profile on SEDAR at www.sedar.com. Each technical report was prepared by or under the supervision of a qualified person (a “Qualified Person”) as defined in National Instrument 43-101 – Standards of Disclosure for Mineral Projects of the Canadian Securities Administrators (“NI 43-101”). For readers to fully understand the information in this presentation, they should read the technical reports (available on www.sedar.com) in their entirety, including all qualifications, assumptions and exclusions that relate to the information set out in this presentation which qualifies the Technical Information. Readers are advised that mineral resources that are not mineral reserves do not have demonstrated economic viability. The technical reports are each intended to be read as a whole, and sections should not be read or relied upon out of context. The Technical Information is subject to the assumptions and qualifications contained in the technical reports. This presentation summarizes some of the information contained in the following technical reports: "Technical Report Thompson Creek Molybdenum Mine" dated February 9, 2011 and filed on SEDAR on February 24, 2011; "Technical Report Endako Molybdenum Mine" dated and filed on SEDAR on September 12, 2011; "Technical Report—Feasibility Update Mt. Milligan Property—Northern BC" dated October 13, 2009 and filed on our SEDAR profile on October 13, 2011; and "2009 Mineral Resource Estimate on the Berg Copper Molybdenum Silver Property, Tahtsa Range, British Columbia" dated June 26, 2009 and filed on our SEDAR profile on October 13, 2011. The stated Mineral Reserves estimates have been prepared in accordance with NI 43-101 and are classified in accordance with the Canadian Institute of Mining, Metallurgy and Petroleum's "CIM Definition Standards—For Mineral Resources and Mineral Reserves." Mineral Reserves are equivalent to Proven and Probable Reserves as defined by the SEC Industry Guide 7. Mineral Reserve estimates reflect our reasonable expectation that all necessary permits and approvals will be obtained and maintained. Mining dilution and mining recovery vary by deposit and have been applied in estimating the Mineral Reserves. As Mineral Reserves are reported under both NI 43-101 and SEC Industry Guide 7 standards, it is possible for Mineral Reserve figures to vary between the two standards due to the differences in reporting requirements under each standard. For example, NI 43-101 has a minimum requirement that Mineral Reserves be supported by a pre-feasibility study, whereas SEC Industry Guide 7 requires support from a detailed feasibility study that demonstrates that economic extraction is justified. For the Mineral Reserves at December 31, 2011, there is no difference between the Mineral Reserves as disclosed under NI 43-101 and those disclosed under SEC Industry Guide 7, and therefore no reconciliation is provided. The stated Mineral Resources were estimated in accordance with the definitions and requirements of NI 43-101. The Mineral Resources are equivalent to Mineralized Material as defined by the SEC Industry Guide 7. The Mineral Resources are not included in and are in addition to the Mineral Reserves. |
|
|
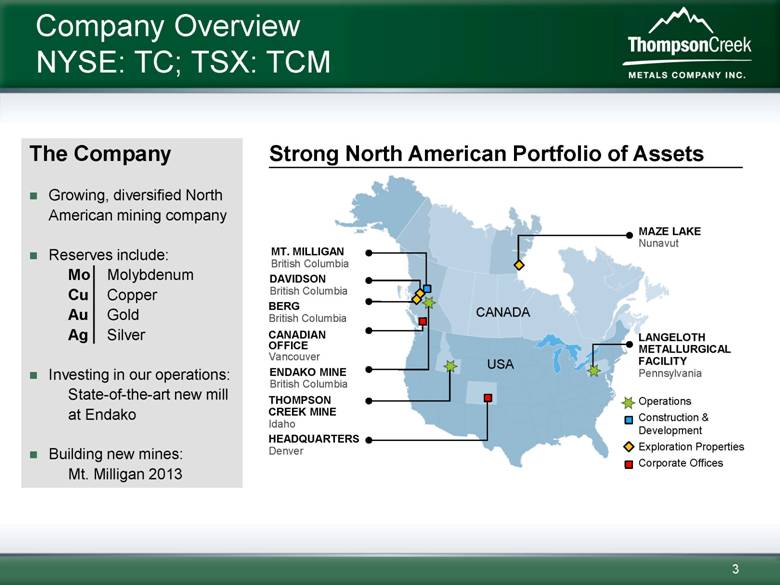
Company Overview NYSE: TC; TSX: TCM THOMPSON CREEK MINE Idaho ENDAKO MINE British Columbia LANGELOTH METALLURGICAL FACILITY Pennsylvania DAVIDSON British Columbia MT. MILLIGAN British Columbia BERG British Columbia MAZE LAKE Nunavut Operations Construction & Development Exploration Properties Corporate Offices CANADA USA CANADIAN OFFICE Vancouver HEADQUARTERS Denver The Company Growing, diversified North American mining company Reserves include: Mo Molybdenum Cu Copper Au Gold Ag Silver Investing in our operations: State-of-the-art new mill at Endako Building new mines: Mt. Milligan 2013 Strong North American Portfolio of Assets |
|
|
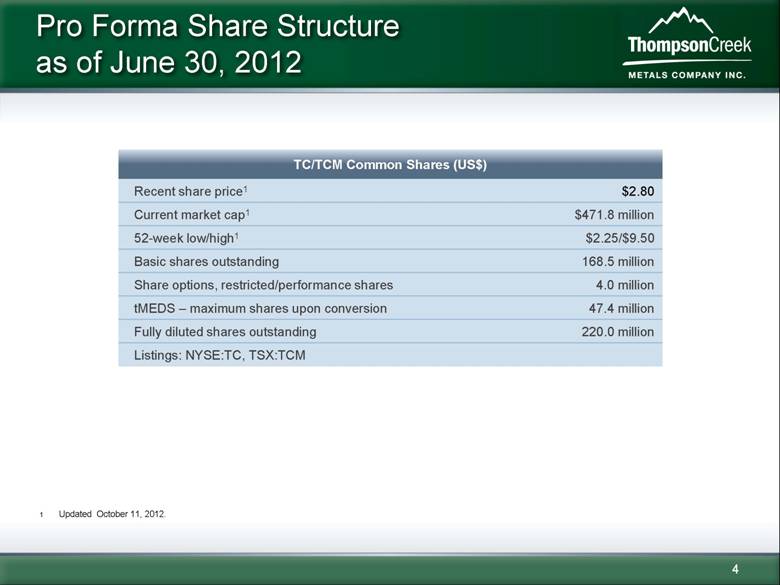
Pro Forma Share Structure as of June 30, 2012 TC/TCM Common Shares (US$) Recent share price1 $2.80 Current market cap1 $471.8 million 52-week low/high1 $2.25/$9.50 Basic shares outstanding 168.5 million Share options, restricted/performance shares 4.0 million tMEDS – maximum shares upon conversion 47.4 million Fully diluted shares outstanding 220.0 million Listings: NYSE:TC, TSX:TCM 1 Updated October 11, 2012. |
|
|
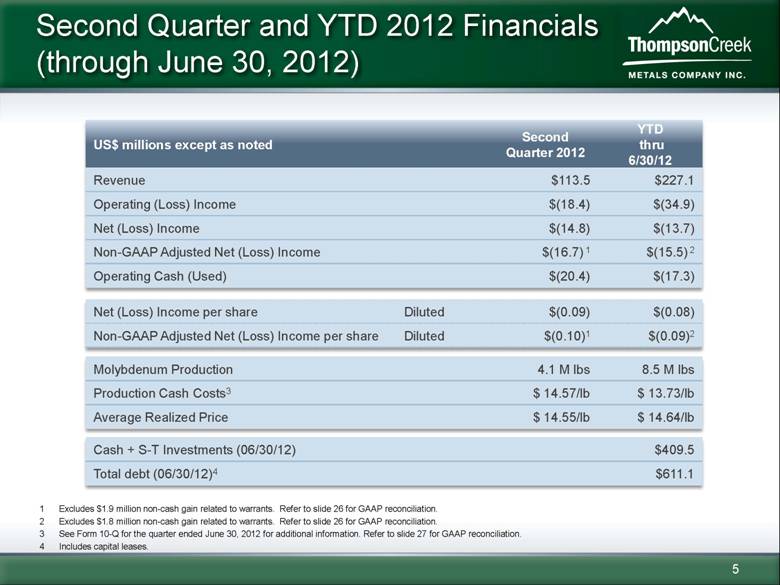
Second Quarter and YTD 2012 Financials (through June 30, 2012) 1 Excludes $1.9 million non-cash gain related to warrants. Refer to slide 26 for GAAP reconciliation. 2 Excludes $1.8 million non-cash gain related to warrants. Refer to slide 26 for GAAP reconciliation. 3 See Form 10-Q for the quarter ended June 30, 2012 for additional information. Refer to slide 27 for GAAP reconciliation. 4 Includes capital leases. YTD Second US$ millions except as noted thru Quarter 2012 6/30/12 Revenue $113.5 $227.1 Operating (Loss) Income $(18.4) $(34.9) Net (Loss)Income $(14.8) $(13.7) Non-GAAP Adjusted Net (Loss)Income $(16.7) 1 $(15.5) 2 OperatingCash (Used) $(20.4) $(17.3) Net (Loss) Income per share Diluted $(0.09) $(0.08) Non-GAAPAdjusted Net (Loss) Incomeper share Diluted $(0.10)1 $(0.09)2 Molybdenum Production 4.1 M lbs 8.5 M lbs Production Cash Costs $ 14.57/lb $ 13.73/lb Average Realized Price $ 14.55/lb $ 14.64/lb Cash + S-T Investments (06/30/12) $409.5 Total debt (06/30/12)4 $611.1 |
|
|
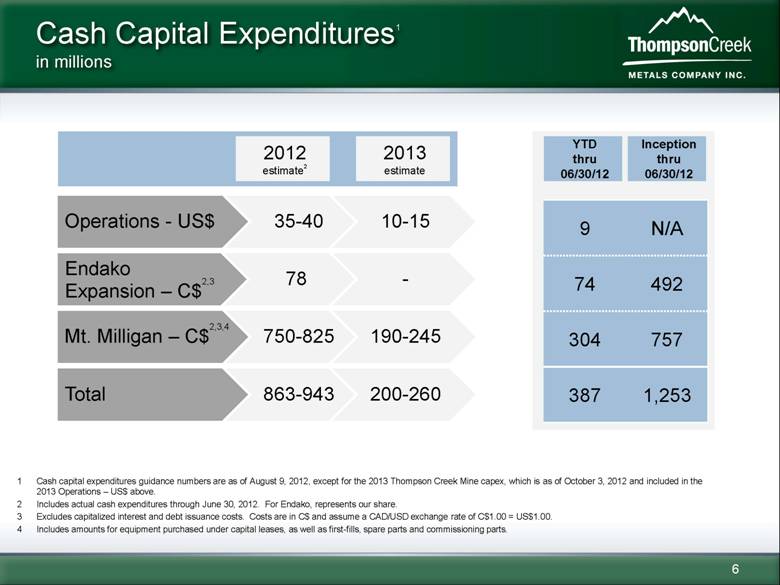
1 Cash capital expenditures guidance numbers are as of August 9, 2012, except for the 2013 Thompson Creek Mine capex, which is as of October 3, 2012 and included in the 2013 Operations – US$ above. 2 Includes actual cash expenditures through June 30, 2012. For Endako, represents our share. 3 Excludes capitalized interest and debt issuance costs. Costs are in C$ and assume a CAD/USD exchange rate of C$1.00 = US$1.00. 4 Includes amounts for equipment purchased under capital leases, as well as first-fills, spare parts and commissioning parts. Cash Capital Expenditures1 in millions 2012 estimate2 2013 estimate 9 N/A 74 492 304 757 387 1,253 YTD thru 06/30/12 Inception thru 06/30/12 Operations -US$ 35-40 10-15 Endako 78 -Expansion –C$2,3 Mt. Milligan – C$2,3,4 750-825 190-245 Total 863-943 200-260 |
|
|
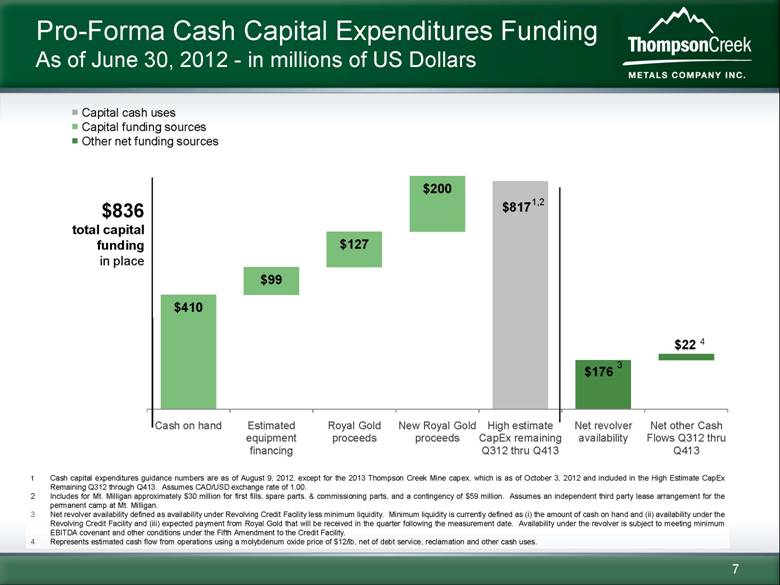
Pro-Forma Cash Capital Expenditures Funding As of June 30, 2012 - in millions of US Dollars 1 Cash capital expenditures guidance numbers are as of August 9, 2012, except for the 2013 Thompson Creek Mine capex, which is as of October 3, 2012 and included in the High Estimate CapEx Remaining Q312 through Q413. Assumes CAD/USD exchange rate of 1.00. 2 Includes for Mt. Milligan approximately $30 million for first fills, spare parts, & commissioning parts, and a contingency of $59 million. Assumes an independent third party lease arrangement for the permanent camp at Mt. Milligan. 3 Net revolver availability defined as availability under Revolving Credit Facility less minimum liquidity. Minimum liquidity is currently defined as (i) the amount of cash on hand and (ii) availability under the Revolving Credit Facility and (iii) expected payment from Royal Gold that will be received in the quarter following the measurement date. Availability under the revolver is subject to meeting minimum EBITDA covenant and other conditions under the Fifth Amendment to the Credit Facility. 4 Represents estimated cash flow from operations using a molybdenum oxide price of $12/lb, net of debt service, reclamation and other cash uses. Capital cash uses Capital funding sources Other net funding sources $817 3 4 1,2 $836 total capital funding in place Cash on hand Estimated Royal Gold New Royal Gold High estimate Net revolver Net other Cash equipment proceeds proceeds CapEx remaining availability Flows Q312 thru financing Q312 thru Q413 Q413 |
|
|
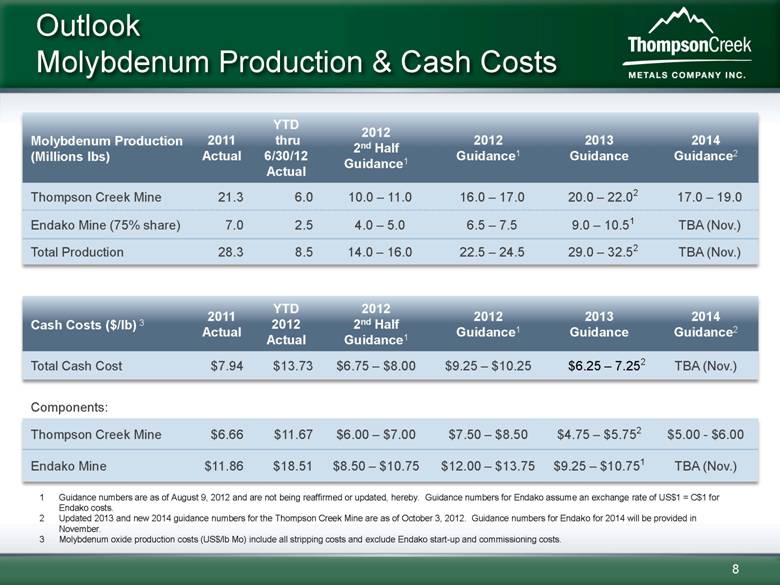
1 Guidance numbers are as of August 9, 2012 and are not being reaffirmed or updated, hereby. Guidance numbers for Endako assume an exchange rate of US$1 = C$1 for Endako costs. 2 Updated 2013 and new 2014 guidance numbers for the Thompson Creek Mine are as of October 3, 2012. Guidance numbers for Endako for 2014 will be provided in November. 3 Molybdenum oxide production costs (US$/lb Mo) include all stripping costs and exclude Endako start-up and commissioning costs. Outlook Molybdenum Production & Cash Costs YTD 2012 Molybdenum Production 2011 thru 2012 2013 2014 2nd Half (Millions lbs) Actual 6/30/12 Guidance1 Guidance Guidance2 Guidance1 Actual Thompson Creek Mine 21.3 6.0 10.0 11.0 16.0 17.0 20.0 22.02 17.0 19.0 Endako Mine (75% share) 7.0 2.5 4.0 5.0 6.5 7.5 9.0 10.51 TBA (Nov.) Total Production 28.3 8.5 14.0 16.0 22.5 24.5 29.0 32.52 TBA (Nov.) YTD 2012 2011 2012 2013 2014 Cash Costs ($/lb) 3 2012 2nd Half Actual Guidance1 Guidance Guidance2 Actual Guidance1 Total Cash Cost $7.94 $13.73 $6.75 $8.00 $9.25 $10.25 $6.25 7.252 TBA (Nov.) Components: Thompson Creek Mine $6.66 $11.67 $6.00 $7.00 $7.50 $8.50 $4.75 $5.752 $5.00 - $6.00 Endako Mine $11.86 $18.51 $8.50 $10.75 $12.00 $13.75 $9.25 $10.751 TBA (Nov.) |
|
|
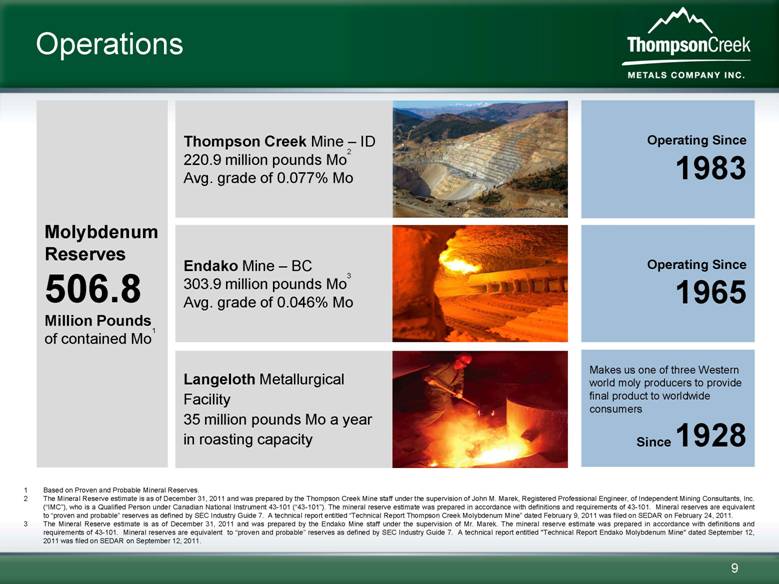
Operations 1 Based on Proven and Probable Mineral Reserves. 2 The Mineral Reserve estimate is as of December 31, 2011 and was prepared by the Thompson Creek Mine staff under the supervision of John M. Marek, Registered Professional Engineer, of Independent Mining Consultants, Inc. (“IMC”), who is a Qualified Person under Canadian National Instrument 43-101 (“43-101”). The mineral reserve estimate was prepared in accordance with definitions and requirements of 43-101. Mineral reserves are equivalent to “proven and probable” reserves as defined by SEC Industry Guide 7. A technical report entitled “Technical Report Thompson Creek Molybdenum Mine” dated February 9, 2011 was filed on SEDAR on February 24, 2011. 3 The Mineral Reserve estimate is as of December 31, 2011 and was prepared by the Endako Mine staff under the supervision of Mr. Marek. The mineral reserve estimate was prepared in accordance with definitions and requirements of 43-101. Mineral reserves are equivalent to “proven and probable” reserves as defined by SEC Industry Guide 7. A technical report entitled "Technical Report Endako Molybdenum Mine" dated September 12, 2011 was filed on SEDAR on September 12, 2011. Thompson Creek Mine – ID 220.9 million pounds Mo2 Avg. grade of 0.077% Mo Operating Since 1983 Endako Mine – BC 303.9 million pounds Mo3 Avg. grade of 0.046% Mo Operating Since 1965 Molybdenum Reserves 506.8 Million Pounds of contained Mo1 Langeloth Metallurgical Facility 35 million pounds Mo a year in roasting capacity Makes us one of three Western world moly producers to provide final product to worldwide consumers Since 1928 |
|
|
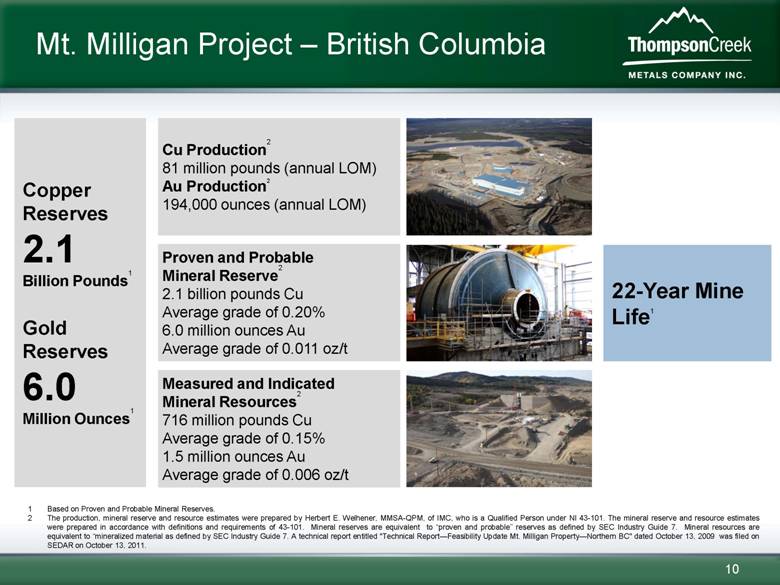
Mt. Milligan Project – British Columbia Cu Production2 81 million pounds (annual LOM) Au Production2 194,000 ounces (annual LOM) Proven and Probable Mineral Reserve2 2.1 billion pounds Cu Average grade of 0.20% 6.0 million ounces Au Average grade of 0.011 oz/t Measured and Indicated Mineral Resources2 716 million pounds Cu Average grade of 0.15% 1.5 million ounces Au Average grade of 0.006 oz/t 1 Based on Proven and Probable Mineral Reserves. 2 The production, mineral reserve and resource estimates were prepared by Herbert E. Welhener, MMSA-QPM, of IMC, who is a Qualified Person under NI 43-101. The mineral reserve and resource estimates were prepared in accordance with definitions and requirements of 43-101. Mineral reserves are equivalent to “proven and probable” reserves as defined by SEC Industry Guide 7. Mineral resources are equivalent to “mineralized material as defined by SEC Industry Guide 7. A technical report entitled "Technical Report—Feasibility Update Mt. Milligan Property—Northern BC" dated October 13, 2009 was filed on SEDAR on October 13, 2011. Copper Reserves 2.1 Billion Pounds1 Gold Reserves 6.0 Million Ounces1 22-Year Mine Life1 |
|
|
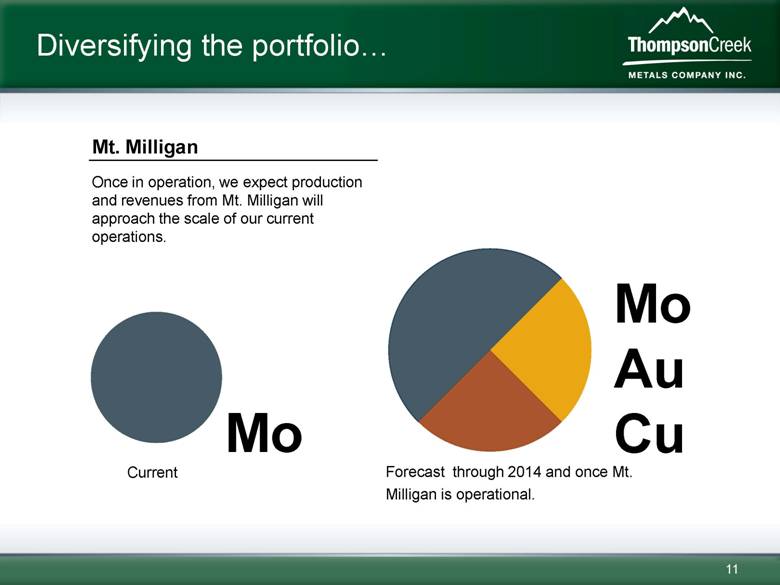
Diversifying the portfolio. . . Mt. Milligan Once in operation, we expect production and revenues from Mt. Milligan will approach the scale of our current operations. Mo Mo Au Cu Current Forecast through 2014 and once Mt. Milligan is operational. |
|
|
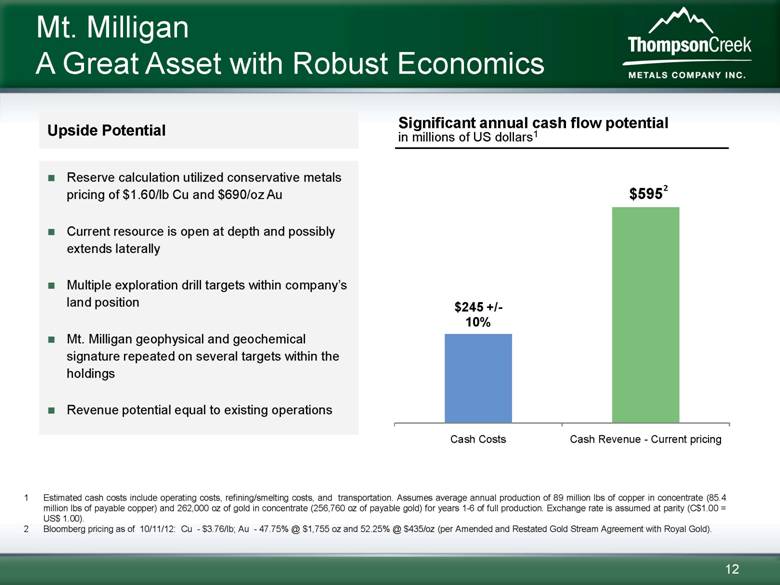
Mt. Milligan A Great Asset with Robust Economics Reserve calculation utilized conservative metals pricing of $1.60/lb Cu and $690/oz Au Current resource is open at depth and possibly extends laterally Multiple exploration drill targets within company’s land position Mt. Milligan geophysical and geochemical signature repeated on several targets within the holdings Revenue potential equal to existing operations 1 Estimated cash costs include operating costs, refining/smelting costs, and transportation. Assumes average annual production of 89 million lbs of copper in concentrate (85.4 million lbs of payable copper) and 262,000 oz of gold in concentrate (256,760 oz of payable gold) for years 1-6 of full production. Exchange rate is assumed at parity (C$1.00 = US$ 1.00). 2 Bloomberg pricing as of 10/11/12: Cu - $3.76/lb; Au - 47.75% @ $1,755 oz and 52.25% @ $435/oz (per Amended and Restated Gold Stream Agreement with Royal Gold). 2 Significant annual cash flow potential in millions of US dollars1 Upside Potential |
|
|
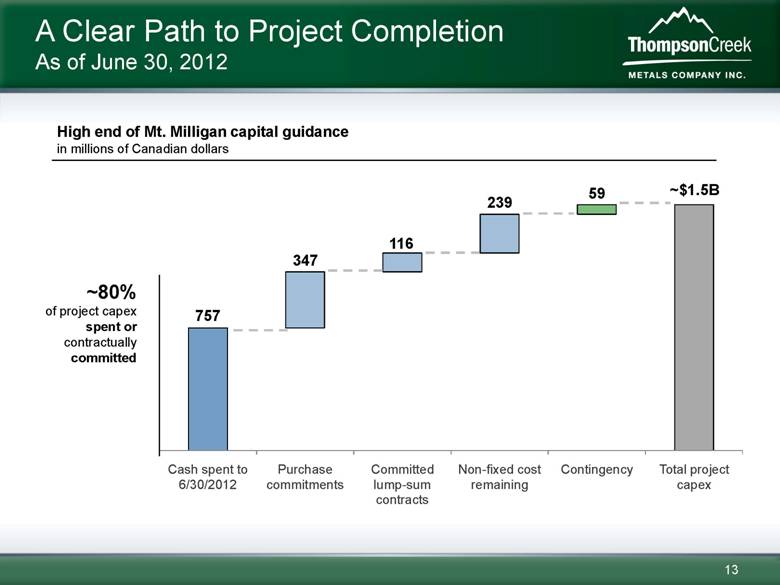
~80% of project capex spent or contractually committed High end of Mt. Milligan capital guidance in millions of Canadian dollars A Clear Path to Project Completion As of June 30, 2012 13 ~$1.5B |
|
|
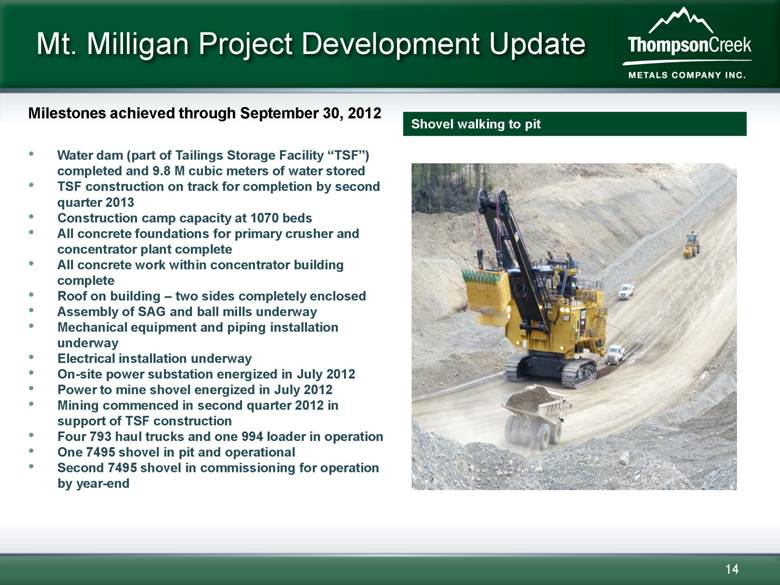
Mt. Milligan Project Development Update Milestones achieved through September 30, 2012 Water dam (part of Tailings Storage Facility “TSF”) completed and 9.8 M cubic meters of water stored TSF construction on track for completion by second quarter 2013 Construction camp capacity at 1070 beds All concrete foundations for primary crusher and concentrator plant complete All concrete work within concentrator building complete Roof on building – two sides completely enclosed Assembly of SAG and ball mills underway Mechanical equipment and piping installation underway Electrical installation underway On-site power substation energized in July 2012 Power to mine shovel energized in July 2012 Mining commenced in second quarter 2012 in support of TSF construction Four 793 haul trucks and one 994 loader in operation One 7495 shovel in pit and operational Second 7495 shovel in commissioning for operation by year-end Shovel walking to pit |
|
|
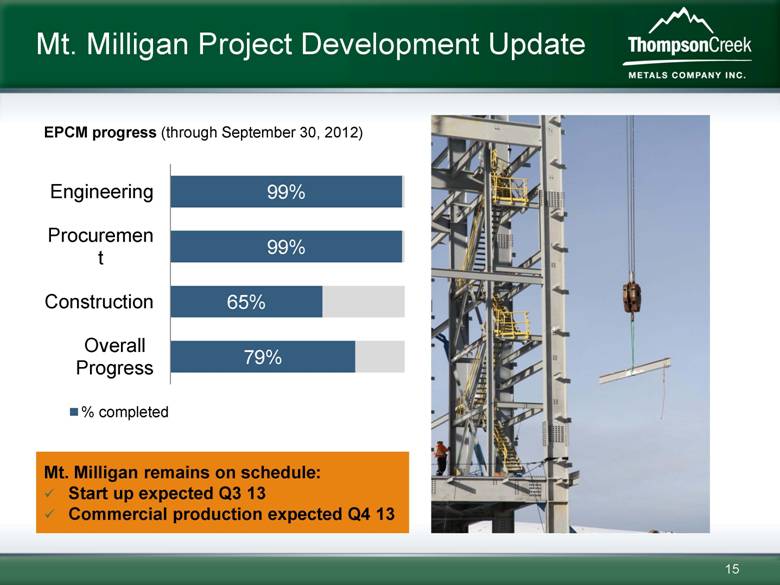
Mt. Milligan Project Development Update EPCM progress (through September 30, 2012) Mt. Milligan remains on schedule: Start up expected Q3 13 Commercial production expected Q4 13 % completed |
|
|
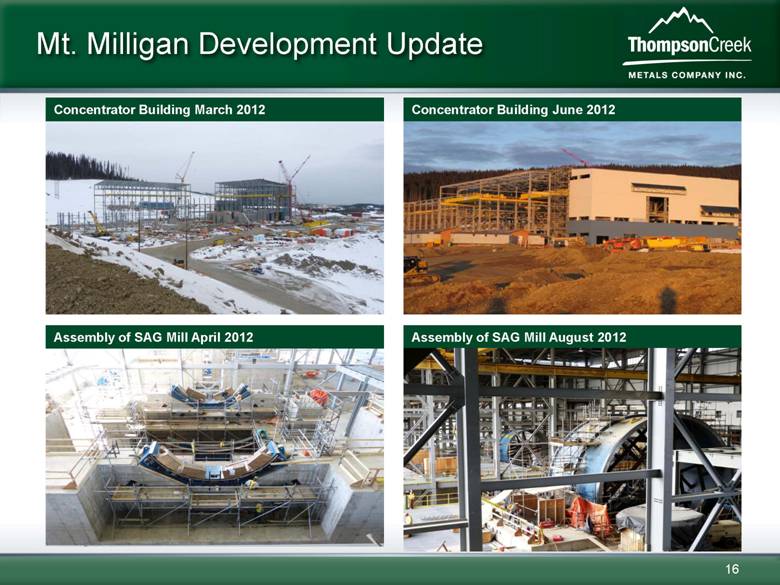
Mt. Milligan Development Update Concentrator Building June 2012 Assembly of SAG Mill April 2012 Assembly of SAG Mill August 2012 Concentrator Building March 2012 |
|
|
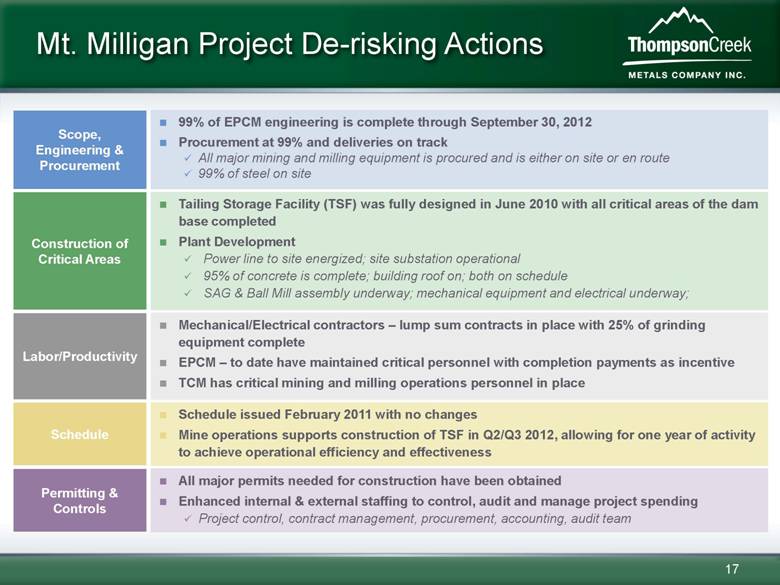
Mt. Milligan Project De-risking Actions All major permits needed for construction have been obtained Enhanced internal & external staffing to control, audit and manage project spending Project control, contract management, procurement, accounting, audit team 99% of EPCM engineering is complete through September 30, 2012 Procurement at 99% and deliveries on track All major mining and milling equipment is procured and is either on site or en route 99% of steel on site Scope, Engineering & Procurement Construction of Critical Areas Tailing Storage Facility (TSF) was fully designed in June 2010 with all critical areas of the dam base completed Plant Development Power line to site energized; site substation operational 95% of concrete is complete; building roof on; both on schedule SAG & Ball Mill assembly underway; mechanical equipment and electrical underway; Permitting & Controls Schedule Schedule issued February 2011 with no changes Mine operations supports construction of TSF in Q2/Q3 2012, allowing for one year of activity to achieve operational efficiency and effectiveness Labor/Productivity Mechanical/Electrical contractors – lump sum contracts in place with 25% of grinding equipment complete EPCM – to date have maintained critical personnel with completion payments as incentive TCM has critical mining and milling operations personnel in place |
|
|
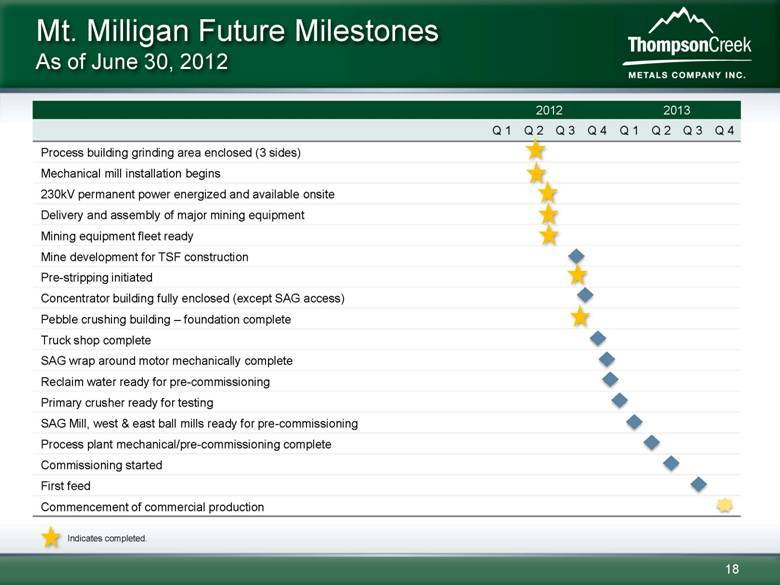
Mt. Milligan Future Milestones As of June 30, 2012 2012 2013 Q1 Q2 Q3 Q4 Q1 Q2 Q3 Q4 Process building grinding area enclosed (3 sides) Mechanical mill installation begins 230kV permanent power energized and available onsite Delivery and assembly of major mining equipment Mining equipment fleet ready Mine development for TSF construction Pre-stripping initiated Concentrator building fully enclosed (except SAG access) Pebble crushing building – foundation complete Truck shop complete SAG wrap around motor mechanically complete Reclaim water ready for pre-commissioning Primary crusher ready for testing SAG Mill, west & east ball mills ready for pre-commissioning Process plant mechanical/pre-commissioning complete Commissioning started First feed Commencement of commercial production Indicates completed. |
|
|
Market Update |
|
|
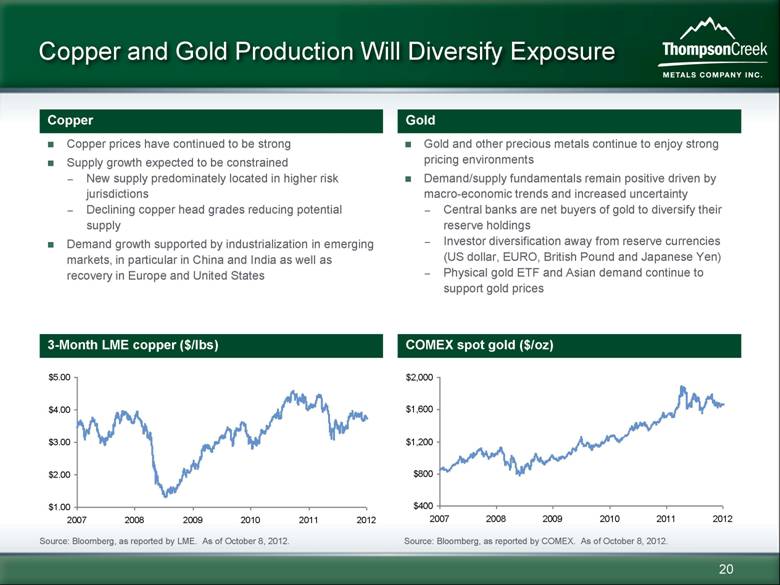
Copper Gold Copper and Gold Production Will Diversify Exposure 20 Copper prices have continued to be strong Supply growth expected to be constrained New supply predominately located in higher risk jurisdictions Declining copper head grades reducing potential supply Demand growth supported by industrialization in emerging markets, in particular in China and India as well as recovery in Europe and United States Gold and other precious metals continue to enjoy strong pricing environments Demand/supply fundamentals remain positive driven by macro-economic trends and increased uncertainty Central banks are net buyers of gold to diversify their reserve holdings Investor diversification away from reserve currencies (US dollar, EURO, British Pound and Japanese Yen) Physical gold ETF and Asian demand continue to support gold prices 3-Month LME copper ($/Ibs) COMEX spot gold ($/oz) Source: Bloomberg, as reported by LME. As of October 8, 2012. Source: Bloomberg, as reported by COMEX. As of October 8, 2012. $1.00 $2.00 $3.00 $4.00 $5.00 2007 2008 2009 2010 2011 2012 |
|
|
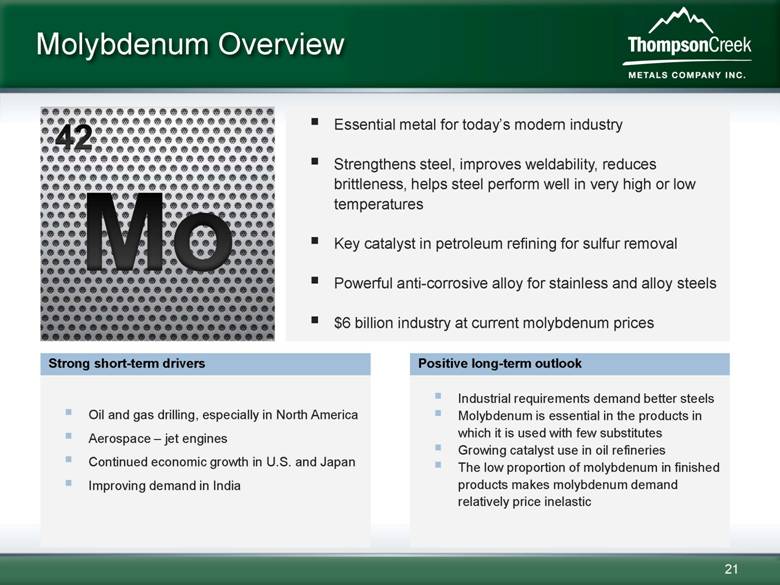
Molybdenum Overview Essential metal for today’s modern industry Strengthens steel, improves weldability, reduces brittleness, helps steel perform well in very high or low temperatures Key catalyst in petroleum refining for sulfur removal Powerful anti-corrosive alloy for stainless and alloy steels $6 billion industry at current molybdenum prices Oil and gas drilling, especially in North America Aerospace – jet engines Continued economic growth in U.S. and Japan Improving demand in India Strong short-term drivers Industrial requirements demand better steels Molybdenum is essential in the products in which it is used with few substitutes Growing catalyst use in oil refineries The low proportion of molybdenum in finished products makes molybdenum demand relatively price inelastic Positive long-term outlook |
|
|
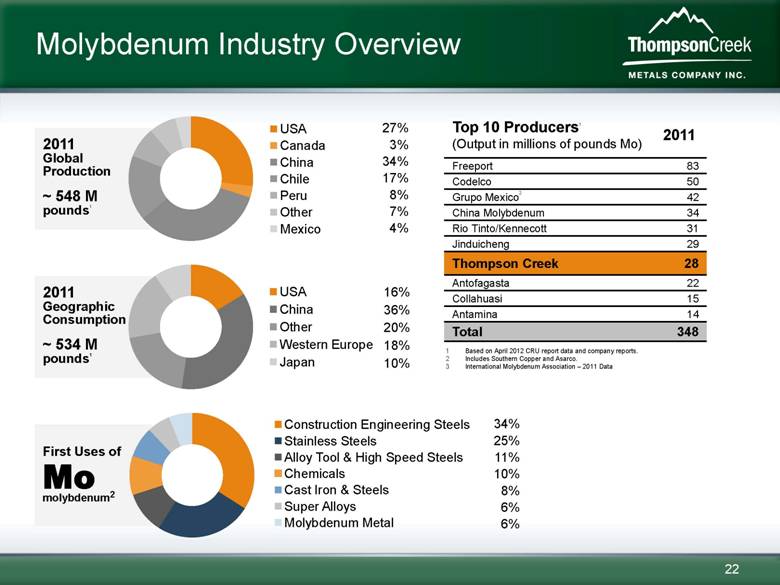
Molybdenum Industry Overview 1 Based on April 2012 CRU report data and company reports. 2 Includes Southern Copper and Asarco. 3 International Molybdenum Association – 2011 Data Top 10 Producers1 (Output in millions of pounds Mo) 2011 Freeport 83 Codelco 50 Grupo Mexico2 42 China Molybdenum 34 Rio Tinto/Kennecott 31 Jinduicheng 29 Thompson Creek 28 Antofagasta 22 Collahuasi 15 Antamina 14 Total 348 2011 Global Production ~ 548 M pounds1 2011 Geographic Consumption ~ 534 M pounds1 First Uses of Mo molybdenum2 27% 3% 34% 17% 8% 7% 4% 16% 36% 20% 18% 10% 34% 25% 11% 10% 8% 6% 6% USA Canada China Chile Peru Other Mexico USA China Other Western Europe Japan Construction Engineering Steels Stainless Steels Alloy Tool & High Speed Steels Chemicals Cast Iron & Steels Super Alloys Molybdenum Metal |
|
|
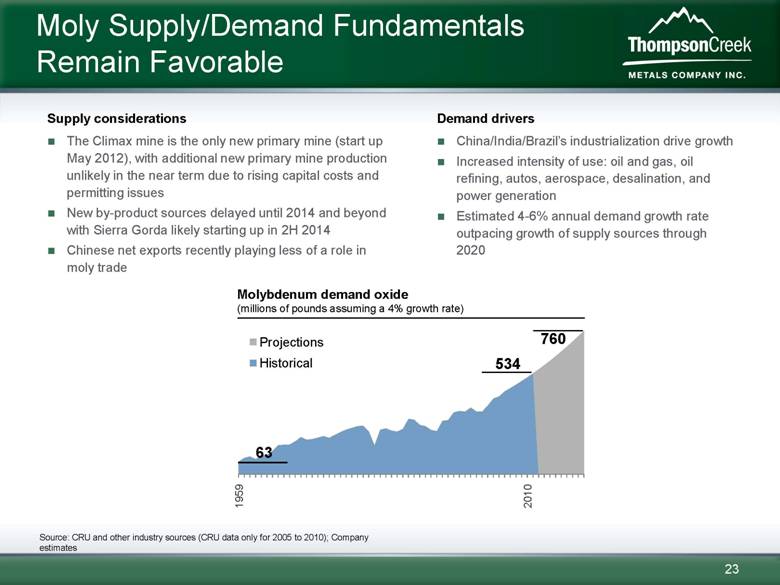
Moly Supply/Demand Fundamentals Remain Favorable The Climax mine is the only new primary mine (start up May 2012), with additional new primary mine production unlikely in the near term due to rising capital costs and permitting issues New by-product sources delayed until 2014 and beyond with Sierra Gorda likely starting up in 2H 2014 Chinese net exports recently playing less of a role in moly trade Supply considerations Demand drivers China/India/Brazil’s industrialization drive growth Increased intensity of use: oil and gas, oil refining, autos, aerospace, desalination, and power generation Estimated 4-6% annual demand growth rate outpacing growth of supply sources through 2020 Molybdenum demand oxide (millions of pounds assuming a 4% growth rate) Source: CRU and other industry sources (CRU data only for 2005 to 2010); Company estimates 534 63 760 |
|
|
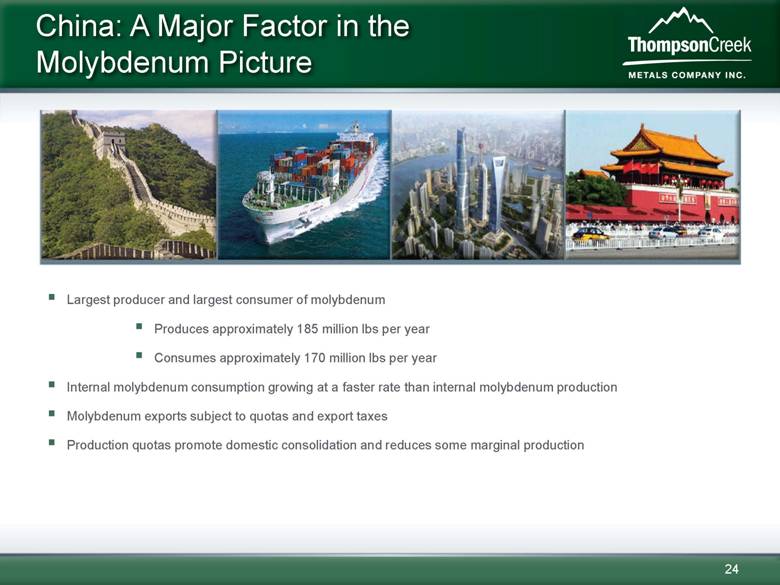
Largest producer and largest consumer of molybdenum Produces approximately 185 million lbs per year Consumes approximately 170 million lbs per year Internal molybdenum consumption growing at a faster rate than internal molybdenum production Molybdenum exports subject to quotas and export taxes Production quotas promote domestic consolidation and reduces some marginal production China: A Major Factor in the Molybdenum Picture |
|
|
Appendix |
|
|
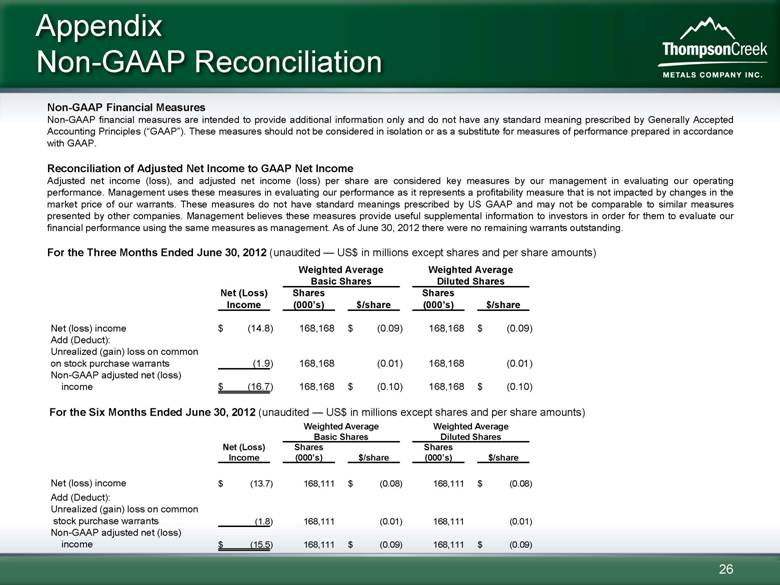
26 Appendix Non-GAAP Reconciliation Non-GAAP Financial Measures Non-GAAP financial measures are intended to provide additional information only and do not have any standard meaning prescribed by Generally Accepted Accounting Principles (“GAAP”). These measures should not be considered in isolation or as a substitute for measures of performance prepared in accordance with GAAP. Reconciliation of Adjusted Net Income to GAAP Net Income Adjusted net income (loss), and adjusted net income (loss) per share are considered key measures by our management in evaluating our operating performance. Management uses these measures in evaluating our performance as it represents a profitability measure that is not impacted by changes in the market price of our warrants. These measures do not have standard meanings prescribed by US GAAP and may not be comparable to similar measures presented by other companies. Management believes these measures provide useful supplemental information to investors in order for them to evaluate our financial performance using the same measures as management. As of June 30, 2012 there were no remaining warrants outstanding. Weighted Average Basic Shares Weighted Average Diluted Shares Net (Loss) Income Shares (000’s) $/share Shares (000’s) $/share Net (loss) income $ (14.8) 168,168 $ (0.09) 168,168 $ (0.09) Add (Deduct): Unrealized (gain) loss on common on stock purchase warrants (1.9) 168,168 (0.01) 168,168 (0.01) Non-GAAP adjusted net (loss) income $ (16.7) 168,168 $ (0.10) 168,168 $ (0.10) For the Three Months Ended June 30, 2012 (unaudited — US$ in millions except shares and per share amounts) Weighted Average Basic Shares Weighted Average Diluted Shares Net (Loss) Income Shares (000’s) $/share Shares (000’s) $/share Net (loss) income $ (13.7) 168,111 $ (0.08) 168,111 $ (0.08) Add (Deduct): Unrealized (gain) loss on common stock purchase warrants (1.8) 168,111 (0.01) 168,111 (0.01) Non-GAAP adjusted net (loss) income $ (15.5) 168,111 $ (0.09) 168,111 $ (0.09) For the Six Months Ended June 30, 2012 (unaudited — US$ in millions except shares and per share amounts) |
|
|
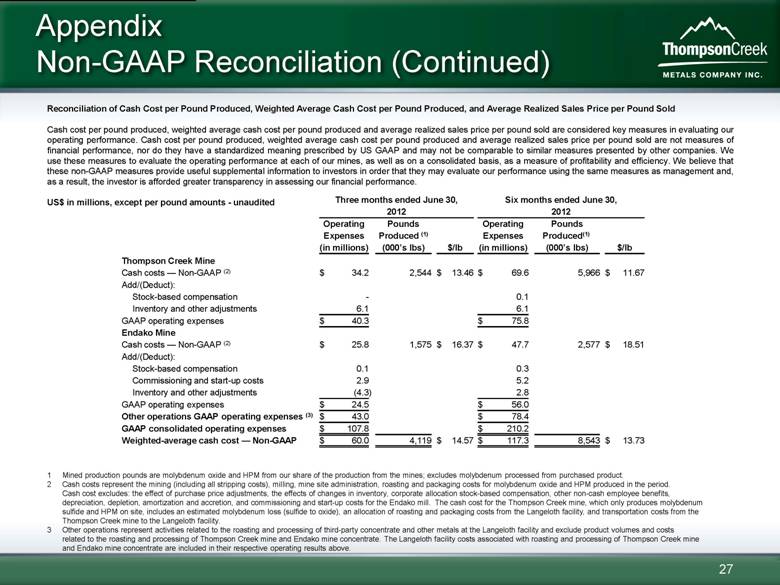
27 Appendix Non-GAAP Reconciliation (Continued) Reconciliation of Cash Cost per Pound Produced, Weighted Average Cash Cost per Pound Produced, and Average Realized Sales Price per Pound Sold Cash cost per pound produced, weighted average cash cost per pound produced and average realized sales price per pound sold are considered key measures in evaluating our operating performance. Cash cost per pound produced, weighted average cash cost per pound produced and average realized sales price per pound sold are not measures of financial performance, nor do they have a standardized meaning prescribed by US GAAP and may not be comparable to similar measures presented by other companies. We use these measures to evaluate the operating performance at each of our mines, as well as on a consolidated basis, as a measure of profitability and efficiency. We believe that these non-GAAP measures provide useful supplemental information to investors in order that they may evaluate our performance using the same measures as management and, as a result, the investor is afforded greater transparency in assessing our financial performance. US$ in millions, except per pound amounts - unaudited 1 Mined production pounds are molybdenum oxide and HPM from our share of the production from the mines; excludes molybdenum processed from purchased product. 2 Cash costs represent the mining (including all stripping costs), milling, mine site administration, roasting and packaging costs for molybdenum oxide and HPM produced in the period. Cash cost excludes: the effect of purchase price adjustments, the effects of changes in inventory, corporate allocation stock-based compensation, other non-cash employee benefits, depreciation, depletion, amortization and accretion, and commissioning and start-up costs for the Endako mill. The cash cost for the Thompson Creek mine, which only produces molybdenum sulfide and HPM on site, includes an estimated molybdenum loss (sulfide to oxide), an allocation of roasting and packaging costs from the Langeloth facility, and transportation costs from the Thompson Creek mine to the Langeloth facility. 3 Other operations represent activities related to the roasting and processing of third-party concentrate and other metals at the Langeloth facility and exclude product volumes and costs related to the roasting and processing of Thompson Creek mine and Endako mine concentrate. The Langeloth facility costs associated with roasting and processing of Thompson Creek mine and Endako mine concentrate are included in their respective operating results above. Three months ended June 30, 2012 Six months ended June 30, 2012 Operating Expenses (in millions) Pounds Produced (1) (000’s lbs) $/lb Operating Expenses (in millions) Pounds Produced(1) (000’s lbs) $/lb Thompson Creek Mine Cash costs — Non-GAAP (2) $ 34.2 2,544 $ 13.46 $ 69.6 5,966 $ 11.67 Add/(Deduct): Stock-based compensation - 0.1 Inventory and other adjustments 6.1 6.1 GAAP operating expenses $ 40.3 $ 75.8 Endako Mine Cash costs — Non-GAAP (2) $ 25.8 1,575 $ 16.37 $ 47.7 2,577 $ 18.51 Add/(Deduct): Stock-based compensation 0.1 0.3 Commissioning and start-up costs 2.9 5.2 Inventory and other adjustments (4.3) 2.8 GAAP operating expenses $ 24.5 $ 56.0 Other operations GAAP operating expenses (3) $ 43.0 $ 78.4 GAAP consolidated operating expenses $ 107.8 $ 210.2 Weighted-average cash cost — Non-GAAP $ 60.0 4,119 $ 14.57 $ 117.3 8,543 $ 13.73 |
|
|
Thompson Creek Metals Company NYSE:TC TSX:TCM www.thompsoncreekmetals.com Pamela Solly Director, Investor Relations Phone: (303) 762-3526 Email: psolly@tcrk.com |