Attached files
| file | filename |
|---|---|
| 8-K - 8-K - TAYLOR CAPITAL GROUP INC | tayc2012q3earningsrelase.htm |
| EX-99.1 - PRESS RELEASE - TAYLOR CAPITAL GROUP INC | taycq32012exhibit991.htm |
1 TAYLOR CAPITAL GROUP, INC. Third Quarter 2012 Financial Results
2 Forward-Looking Statements This presentation includes forward-looking statements that reflect our current expectations and projections about our future results, performance, prospects and opportunities. We have tried to identify these forward-looking statements by using words including “may,” “might”, “contemplate”, “plan”, “prudent”, “potential”, “should”, “will,” “expect,” “anticipate,” “believe,” “intend,” “could” and “estimate” and similar expressions. These forward-looking statements are based on information currently available to us and are subject to a number of risks, uncertainties and other factors that could cause our actual results, performance, prospects or opportunities in 2012 and beyond to differ materially from those expressed in, or implied by, these forward-looking statements. These risks, uncertainties and other factors include, without limitation: Our business may be adversely affected by the highly regulated environment in which we operate. Competition from financial institutions and other financial services providers may adversely affect our growth and profitability. Our business is subject to the conditions of the local economy in which we operate and continued weakness in the local economy and the real estate markets may adversely affect us. Our business is subject to domestic and to a lesser extent, international economic conditions and other factors, many of which are beyond our control and could adversely affect our business. The preparation of our consolidated financial statements requires us to make estimates and judgments, which are subject to an inherent degree of uncertainty and which may differ from actual results. Our allowance for loan losses may prove to be insufficient to absorb losses in our loan portfolio. Our residential mortgage loan repurchase reserve for losses could be insufficient. We are subject to interest rate risk, including interest rate fluctuations that could reduce our profitability. Certain hedging strategies that we use to manage investment in mortgage servicing rights may be ineffective to offset any adverse changes in the fair value of these assets due to changes in interest rates and market liquidity. Our residential mortgage lending profitability could be significantly reduced if we are not able to originate and resell a high volume of mortgage loans. We have counterparty risk and therefore we may be adversely affected by the soundness of other financial institutions. We are subject to certain operational risks, including, but not limited to, data processing system failures and errors and customer or employee fraud. Our controls and procedures may fail or be circumvented. We are dependent upon outside third parties for processing and handling of our records and data. System failure or breaches of our network security, including with respect to our internet banking activities, could subject us to increased operating costs as well as litigation and other liabilities. We are subject to lending concentration risks. We may not be able to access sufficient and cost-effective sources of liquidity. We are subject to liquidity risk, including unanticipated deposit volatility. The recent repeal of federal prohibitions on payment of interest on business demand deposits could increase our interest expense. Changes in our credit ratings could increase our financing costs or make it more difficult for us to obtain funding or capital on commercially acceptable terms. We are a bank holding company and our sources of funds are limited. Our business strategy is dependent on our continued ability to attract, develop and retain highly qualified and experienced personnel in senior management and customer relationship positions. Our reputation could be damaged by negative publicity. New lines of business or new products and services may subject us to certain additional risks. We may experience difficulties in managing our future growth. We, and our subsidiaries, are subject to changes in federal and state tax laws and changes in interpretation of existing laws. Regulatory requirements (including rules recently jointly proposed by the federal bank regulatory agencies to implement Basel III,) growth plans or operating results may require us to raise additional capital, which may not be available on favorable terms or at all. We have not paid a dividend on our common stock since the second quarter of 2008. In addition, regulatory restrictions and liquidity constraints at the holding company level could impair our ability to make distributions on our outstanding securities. For further information about these and other risks, uncertainties and factors, please review the disclosure included in the section captioned "Risk Factors” in our December 31, 2011 Annual Report on Form 10-K filed with the SEC on March 9, 2012 as updated by our Quarterly Reports on form 10-Q, Current Reports on Form 8-K and other filings with the Securities and Exchange Commission. You should not place undue reliance on any forward-looking statements. We undertake no obligation to publicly update or revise any forward-looking statements or risk factors, whether as a result of new information, future events, changed circumstances or any other reason after the date of this press release.
3 Agenda Mark Hoppe, President and Chief Executive Officer Executive comments and opening remarks Randy Conte, Chief Financial Officer and Chief Operating Officer 3rd Qtr Highlights and Results of Operations Questions & Answers THIRD QUARTER 2012 HIGHLIGHTS

4 $16.7 million of Net Income - up 18% from 2Q12 • Diluted Earnings per share of $0.49 in 3Q12 and $1.15 YTD • Record pre-tax, pre-provision operating earnings of $32.8 million • Record revenue of $84.4 million - up over 29% from 2Q12 • Mortgage banking revenue grew 77% to $40.7 million • Asset quality metrics continued to remain strong • Strong net loan growth of $111.2 million; C&I loans grew 3.7% from 2Q12 • Average core deposits grew by $192 million • Prepaid $60 million of 10% subordinated notes THIRD QUARTER 2012 HIGHLIGHTS
5 Diversification and expansion of businesses continues • Mortgage originations grew 44% to $1.38 billion; Mortgage servicing asset grew to $53 million • Cole Taylor Business Capital reached $1 billion in loan commitments • Successful launch of Cole Taylor Equipment Finance (CTEF) • Expansion into Southeast Wisconsin generated loan growth THIRD QUARTER 2012 HIGHLIGHTS

6 Earnings
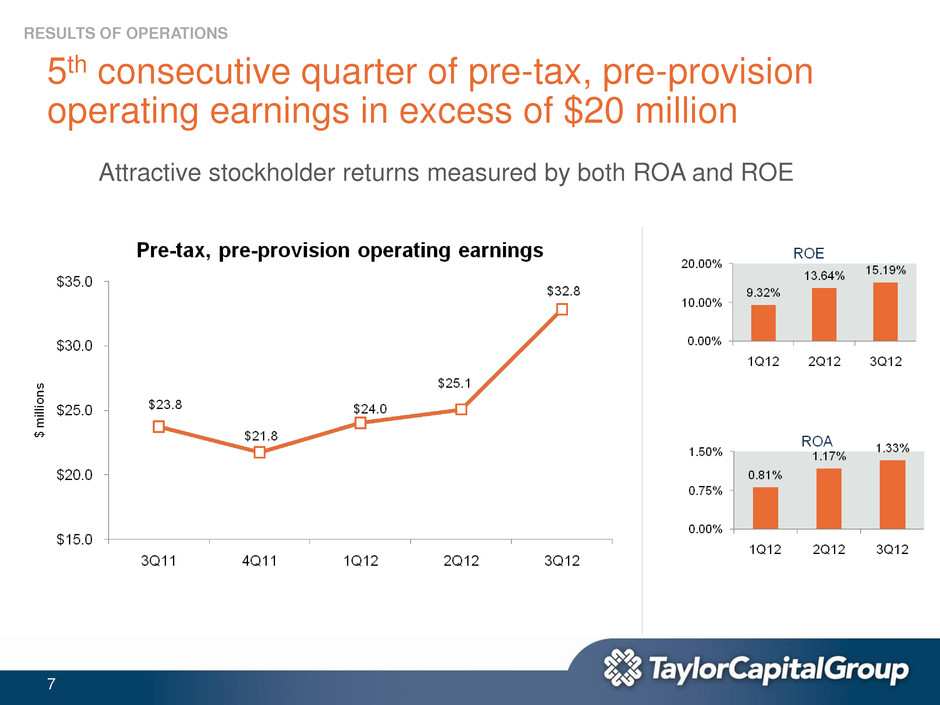
7 5th consecutive quarter of pre-tax, pre-provision operating earnings in excess of $20 million RESULTS OF OPERATIONS Attractive stockholder returns measured by both ROA and ROE
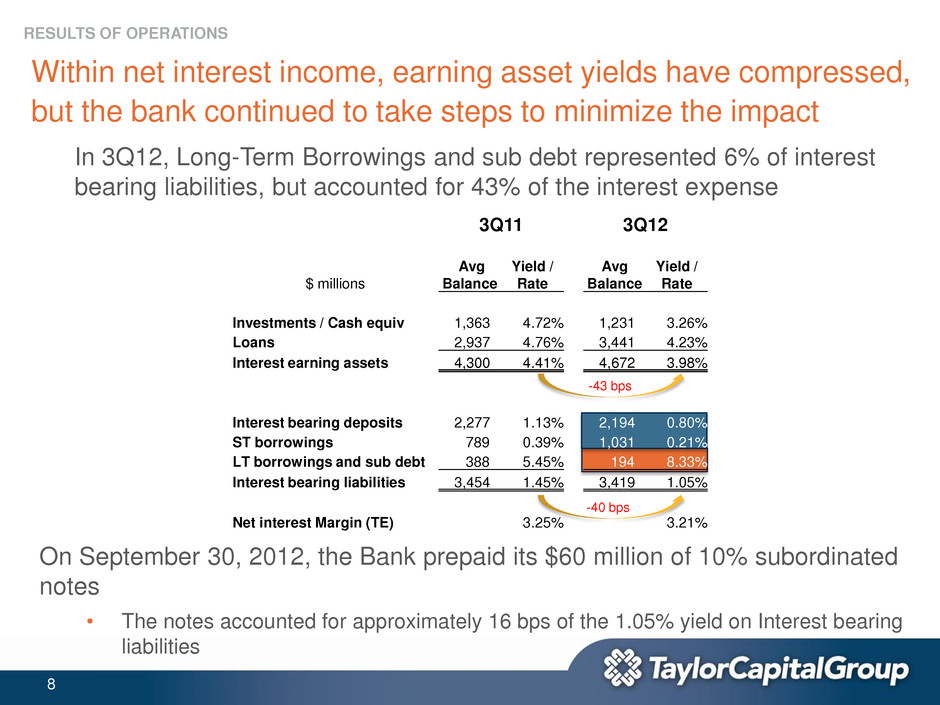
8 Within net interest income, earning asset yields have compressed, but the bank continued to take steps to minimize the impact RESULTS OF OPERATIONS In 3Q12, Long-Term Borrowings and sub debt represented 6% of interest bearing liabilities, but accounted for 43% of the interest expense -43 bps -40 bps On September 30, 2012, the Bank prepaid its $60 million of 10% subordinated notes • The notes accounted for approximately 16 bps of the 1.05% yield on Interest bearing liabilities 3Q11 3Q12 $ millions Avg Balance Yield / Rate Avg Balance Yield / Rate Investments / Cash equiv 1,363 4.72% 1,231 3.26% Loans 2,937 4.76% 3,441 4.23% Interest earning assets 4,300 4.41% 4,672 3.98% Interest bearing deposits 2,277 1.13% 2,194 0.80% ST borrowings 789 0.39% 1,031 0.21% LT borrowings and sub debt 388 5.45% 194 8.33% Interest bearing liabilities 3,454 1.45% 3,419 1.05% Net interest Margin (TE) 3.25% 3.21%
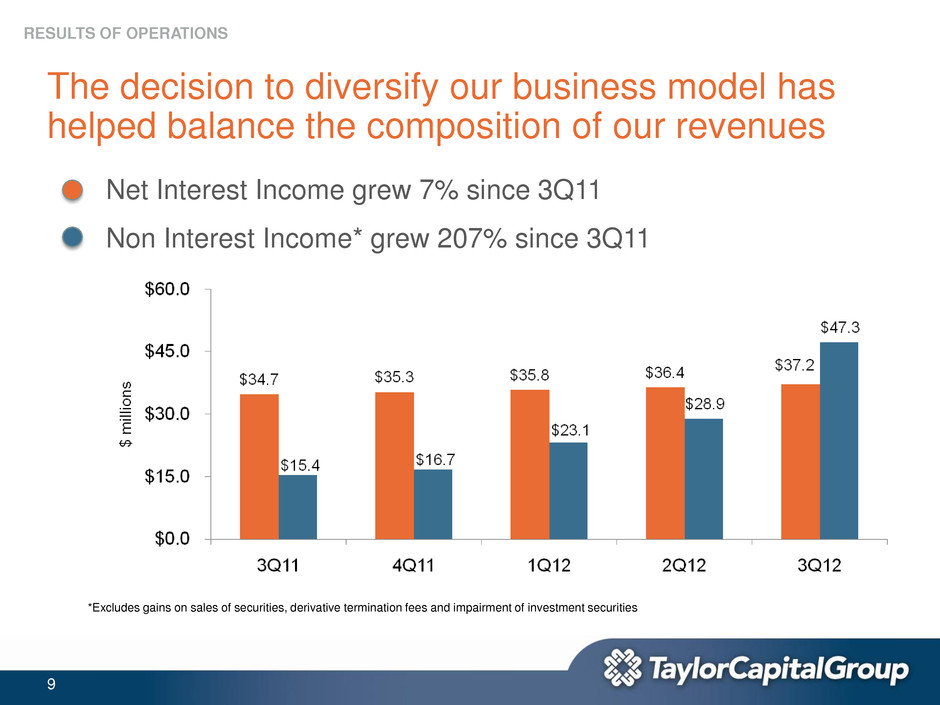
9 The decision to diversify our business model has helped balance the composition of our revenues RESULTS OF OPERATIONS *Excludes gains on sales of securities, derivative termination fees and impairment of investment securities Net Interest Income grew 7% since 3Q11 Non Interest Income* grew 207% since 3Q11
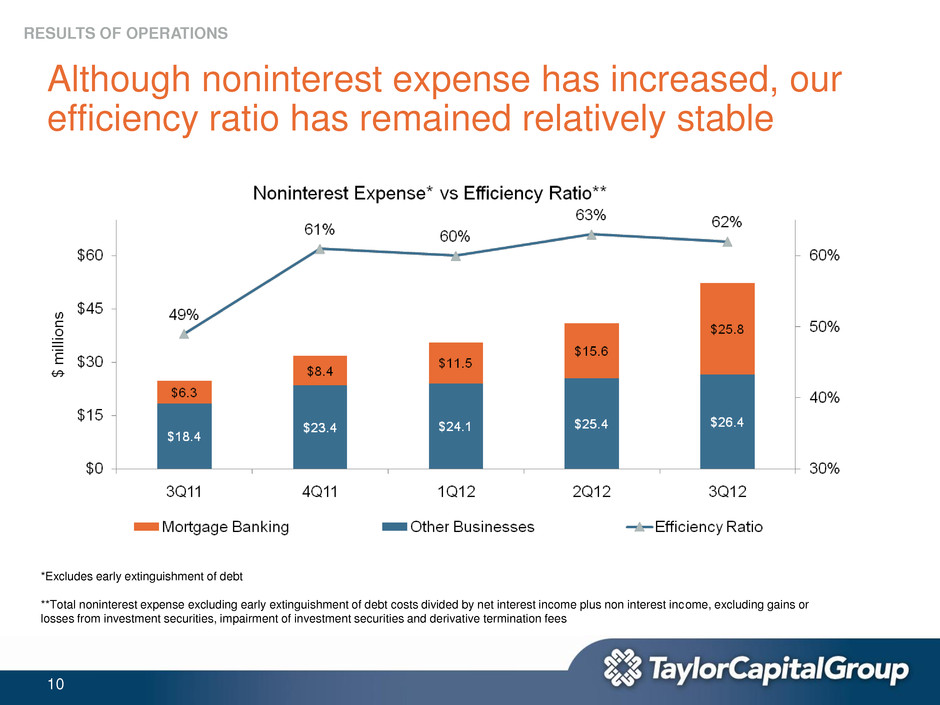
10 Although noninterest expense has increased, our efficiency ratio has remained relatively stable RESULTS OF OPERATIONS *Excludes early extinguishment of debt **Total noninterest expense excluding early extinguishment of debt costs divided by net interest income plus non interest income, excluding gains or losses from investment securities, impairment of investment securities and derivative termination fees

11 Our drive to improve asset quality has yielded results, as credit costs continued to be low – Increased Reserve Coverage to 128.30% as a result of loan workouts outpacing new problem loans – Commercial criticized and classified loans down 18% from 2Q12 and down 48% since 3Q11 – Nonperforming assets continue to decline RESULTS OF OPERATIONS $ m ill io n s $ m ill io n s

12 Balance Sheet
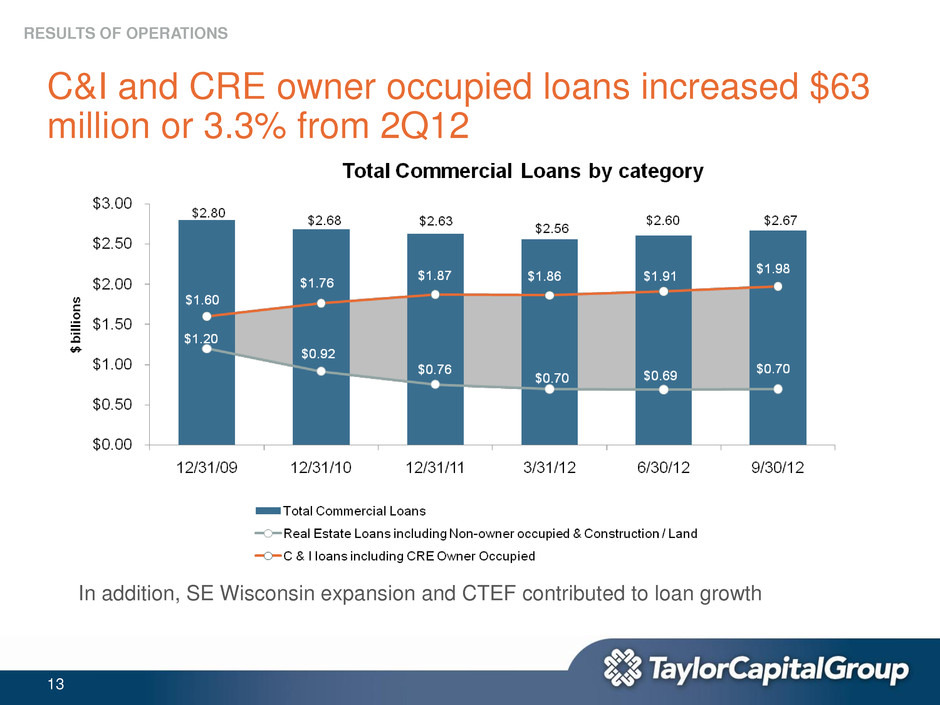
13 C&I and CRE owner occupied loans increased $63 million or 3.3% from 2Q12 RESULTS OF OPERATIONS In addition, SE Wisconsin expansion and CTEF contributed to loan growth
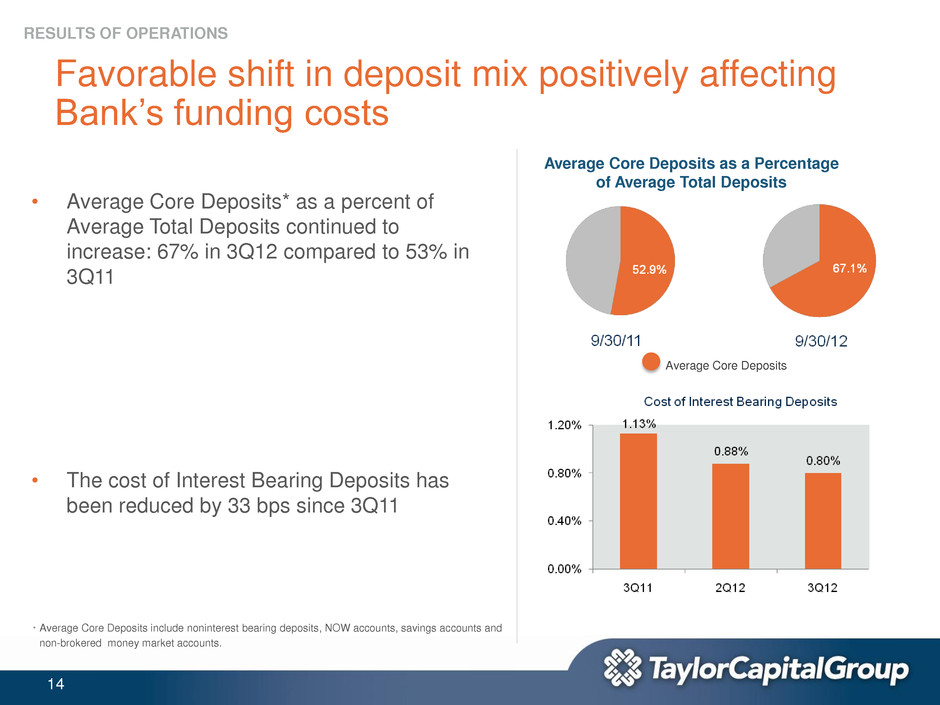
14 Favorable shift in deposit mix positively affecting Bank’s funding costs • Average Core Deposits* as a percent of Average Total Deposits continued to increase: 67% in 3Q12 compared to 53% in 3Q11 • The cost of Interest Bearing Deposits has been reduced by 33 bps since 3Q11 RESULTS OF OPERATIONS Average Core Deposits as a Percentage of Average Total Deposits * Average Core Deposits include noninterest bearing deposits, NOW accounts, savings accounts and non-brokered money market accounts. Average Core Deposits
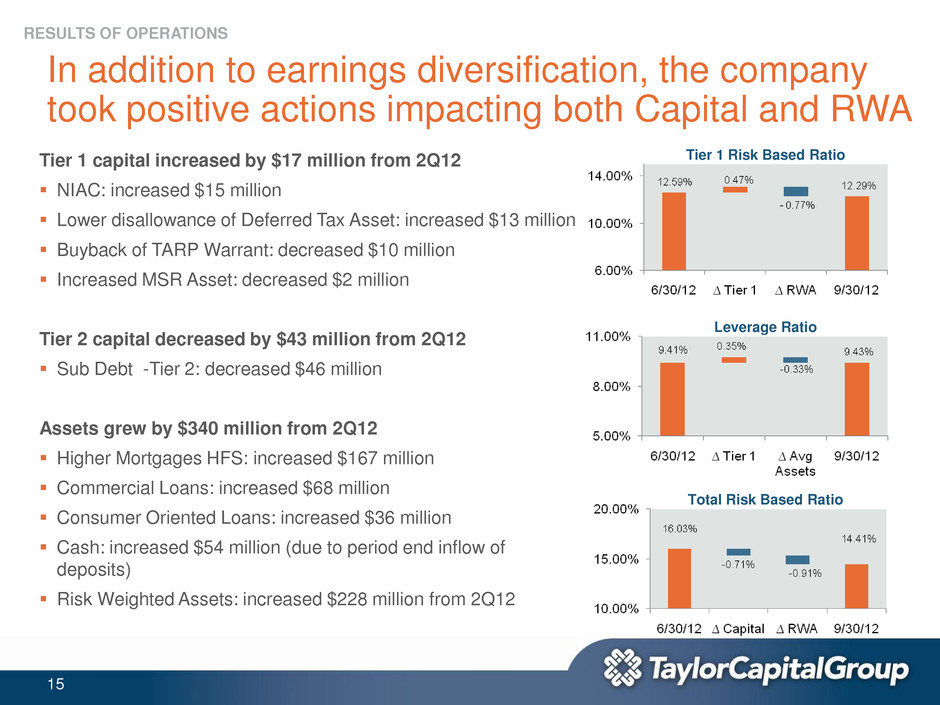
15 In addition to earnings diversification, the company took positive actions impacting both Capital and RWA RESULTS OF OPERATIONS Tier 1 capital increased by $17 million from 2Q12 NIAC: increased $15 million Lower disallowance of Deferred Tax Asset: increased $13 million Buyback of TARP Warrant: decreased $10 million Increased MSR Asset: decreased $2 million Tier 2 capital decreased by $43 million from 2Q12 Sub Debt -Tier 2: decreased $46 million Assets grew by $340 million from 2Q12 Higher Mortgages HFS: increased $167 million Commercial Loans: increased $68 million Consumer Oriented Loans: increased $36 million Cash: increased $54 million (due to period end inflow of deposits) Risk Weighted Assets: increased $228 million from 2Q12 Leverage Ratio Tier 1 Risk Based Ratio Total Risk Based Ratio

16 As a result of strong credit quality and capital strength, our Texas Ratio has improved to 20% RESULTS OF OPERATIONS Texas Ratio – sum of nonperforming assets plus performing restructured loans plus 90 days past due and still accruing divided by the sum of Tier 1 Capital and loan loss reserves, period end
17 Business Lines

18 Cole Taylor Mortgage (CTM) continued to execute all facets of its growth strategy NATIONAL BUSINESS LINES - MORTGAGE BANKING Cole Taylor Mortgage 3Q12 Management Results ($ millions) 4Q11 1Q12 2Q12 3Q12 Loan Origination Income $7.7 $16.3 $20.5 $39.6 Net Servicing Revenue 1.3 1.3 2.6 1.0 Portfolio/HFS Revenue* 2.0 2.5 3.8 5.0 Total Revenue 11.0 20.0 26.8 45.6 Provision for Loan Losses 0.1 0.1 0.1 0.1 Non Interest Expense 8.4 11.5 15.6 25.8 Pre Tax Income 2.5 8.4 11.1 19.7 Income Taxes 1.0 3.4 3.3 7.4 Net Income $1.5 $5.0 $7.8 $12.3 Origination Volume $782 $895 $960 $1,385 Mortgage Servicing Book ($ billion) $1.02 $2.38 $4.02 $6.24 Mortgages Held for Investment $170 $221 $257 $294 *Includes all Net Interest Income • Total mortgage division revenue grew to $45.6 million in 3Q12, a 70% increase over 2Q12 • Net Income of $12.3 million in 3Q12, a 58% increase over 2Q12 – 44% growth in origination volumes – 55% growth in mortgage servicing book – 14% growth in mortgage portfolio held for investment
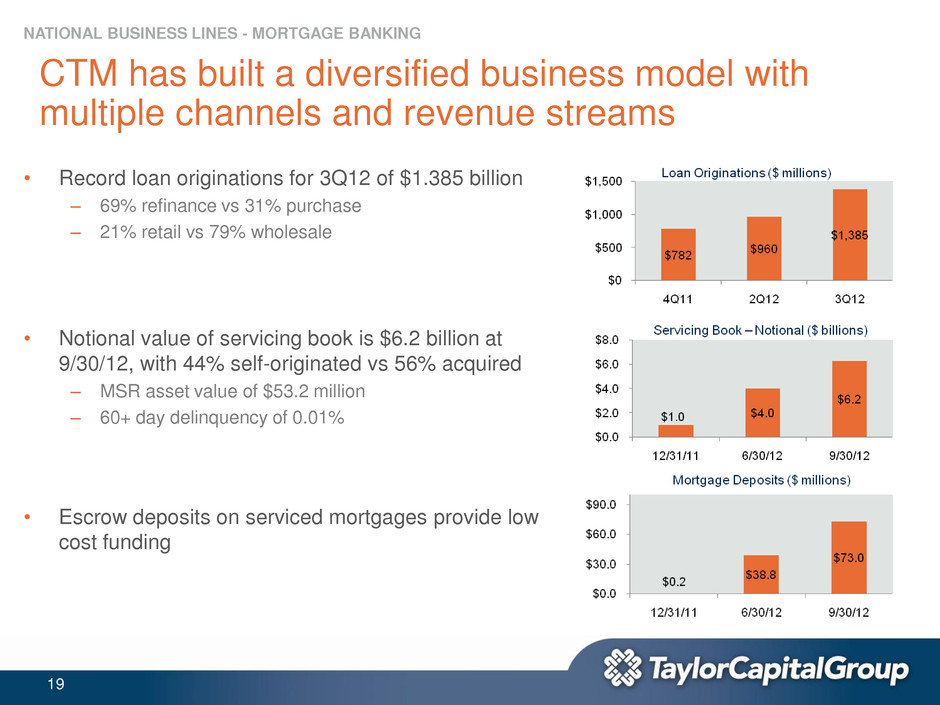
19 CTM has built a diversified business model with multiple channels and revenue streams NATIONAL BUSINESS LINES - MORTGAGE BANKING • Record loan originations for 3Q12 of $1.385 billion – 69% refinance vs 31% purchase – 21% retail vs 79% wholesale • Notional value of servicing book is $6.2 billion at 9/30/12, with 44% self-originated vs 56% acquired – MSR asset value of $53.2 million – 60+ day delinquency of 0.01% • Escrow deposits on serviced mortgages provide low cost funding
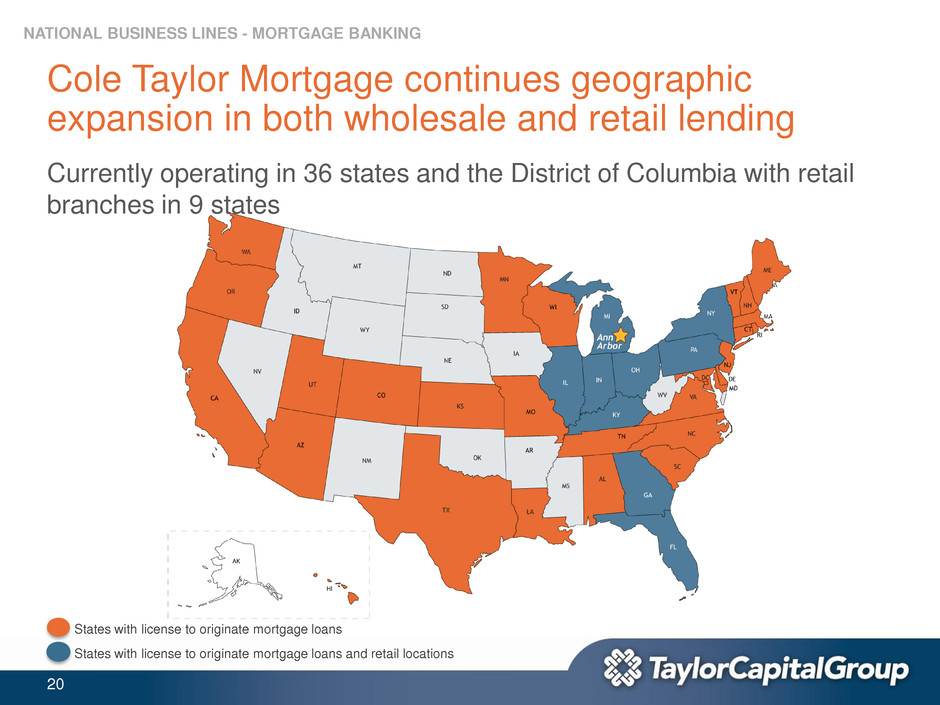
20 Cole Taylor Mortgage continues geographic expansion in both wholesale and retail lending Currently operating in 36 states and the District of Columbia with retail branches in 9 states NATIONAL BUSINESS LINES - MORTGAGE BANKING States with license to originate mortgage loans and retail locations States with license to originate mortgage loans
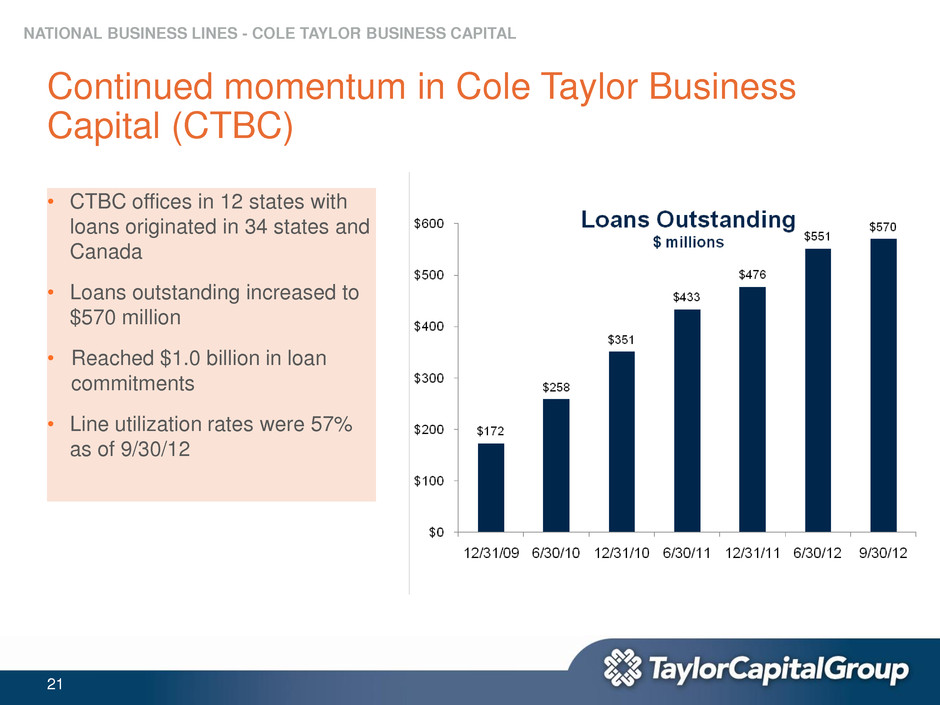
21 Continued momentum in Cole Taylor Business Capital (CTBC) NATIONAL BUSINESS LINES - COLE TAYLOR BUSINESS CAPITAL • CTBC offices in 12 states with loans originated in 34 states and Canada • Loans outstanding increased to $570 million • Reached $1.0 billion in loan commitments • Line utilization rates were 57% as of 9/30/12
22 Conclusion

23 Questions?
