Attached files
| file | filename |
|---|---|
| 8-K - FORM 8-K - Apollo Global Management, Inc. | d424828d8k.htm |
 Apollo Global Management, LLC -
Investor Overview
October 2012
Exhibit 99.1 |
 1
1
1
1
Forward Looking Statements and Other Important Disclosures
It should not be assumed that investments made in the future will be
profitable or will equal the performance of investments in this document.
This presentation may contain forward looking statements that are
within the meaning of Section 27A of the Securities Act of 1933 and Section 21E of the
Securities Exchange Act of 1934. These statements include, but
are not limited to, discussions related to Apollo Global Management LLC’s and its
subsidiaries’ (collectively “Apollo”) expectations
regarding the performance of its business, its liquidity and capital resources and the other non-historical
statements. These forward-looking statements are based on
management’s beliefs, as well as assumptions made by, and information currently available to,
management. When used in this presentation, the words
“believe,” “anticipate,” “estimate,” “expect,” “intend” and similar expressions are intended to
identify forward-looking statements. Although management believes
that the expectations reflected in these forward-looking statements are reasonable, it can
give no assurance that these expectations will prove to have been
correct. These statements are subject to certain risks, uncertainties and assumptions. We
believe these factors include but are not limited to those described
under the section entitled “Risk Factors” in the Company’s prospectus filed in accordance
with Rule 424(b) of the Securities Act with the Securities and
Exchange Commission (“SEC”) on March 30, 2011, as such factors may be updated from time to
time in our periodic filings with the SEC, which are accessible on
the SEC’s website at www.sec.gov. These factors should not be construed as exhaustive and
should be read in conjunction with the other cautionary statements
that are included in this presentation in other SEC filings. We undertake no obligation to
publicly update or review any forward-looking statements, whether
as a result of new information, future developments or otherwise.
“Gross IRR” of a fund represents the cumulative
investment-related cash flows for all of the investors in the fund on the basis of the actual timing of
investment inflows and outflows (for unrealized investment assuming
disposition of the respective “as of” dates referenced) aggregated on a gross basis
quarterly, and the return is annualized and compounded before
management fees, carried interest and certain other fund expenses (including interest incurred
by the fund itself) and measures the returns on the fund’s
investments as a whole without regard to whether all of the returns would, if distributed, be payable
to the fund’s investors. “Net IRR” of a fund
means the gross IRR applicable to all investors, including related parties which may not pay fees, net of
management fees, organizational expenses, transaction costs, and
certain other fund expenses (including interest incurred by the fund itself) and realized
carried interest all offset to the extent of interest income, and
measures returns based on amounts that, if distributed, would be paid to investors of the fund; to
the extent that an Apollo private equity fund exceeds all
requirements detailed within the applicable fund agreement, the estimated unrealized value is adjusted
such that a percentage of up to 20.0% of the unrealized gain is
allocated to the general partner, thereby reducing the balance attributable to fund investors.
This presentation includes non-GAAP financial measures. A
reconciliation of these non-GAAP financial measures to the most directly comparable financial
measures calculated and presented in accordance with GAAP is included
on slide 26 of the presentation, as well as within our most recent earnings release filed
with the SEC on August 2, 2012 and included on our website at
www.agm.com. These non-GAAP financial measures should be considered in addition to and
not as a substitute for, or superior to, financial measures presented
in accordance with GAAP. This presentation is for
informational purposes only and does not constitute an offer to sell, or the solicitation of an offer to buy, any security, product, service
of Apollo as well as any Apollo sponsored investment fund, whether an
existing or contemplated fund (“Apollo Fund”), for which an offer can be made only by
such fund's Confidential Private Placement Memorandum and in
compliance with applicable law. |
 2
Apollo Global Management, LLC
Ticker:
APO
Exchange:
New York Stock Exchange
Trading Price (October 12, 2012):
$14.48
Market Capitalization
$5.6 billion
L12M Dividend Yield
7.9%
Total Shares / Public Float
(1)
387 million / 60 million
% Insider Ownership
(1)
~70%
L12M Distribution
$1.15 per share
1.
As of June 30, 2012.
Apollo Global Management is a leading
global alternative investment manager in
private equity, credit-oriented capital
markets and real estate |
 3
Agenda
1.
Overview of Apollo
2.
Secular Opportunity
3.
Business Segments
4.
Financial Overview |
 4
Investment Highlights
Leading global alternative investment manager with a diversified
and integrated
platform and highly scalable business model
22 year history of industry-leading returns, especially during
periods of market turbulence
Well positioned to capitalize on secular growth dynamics in
alternative asset management sector with established brand
name Proven success growing assets under management and building
new businesses Attractive financial characteristics with solid
track record of cash distributions to shareholders
Strong management and investment teams aligned with shareholders
and clients |
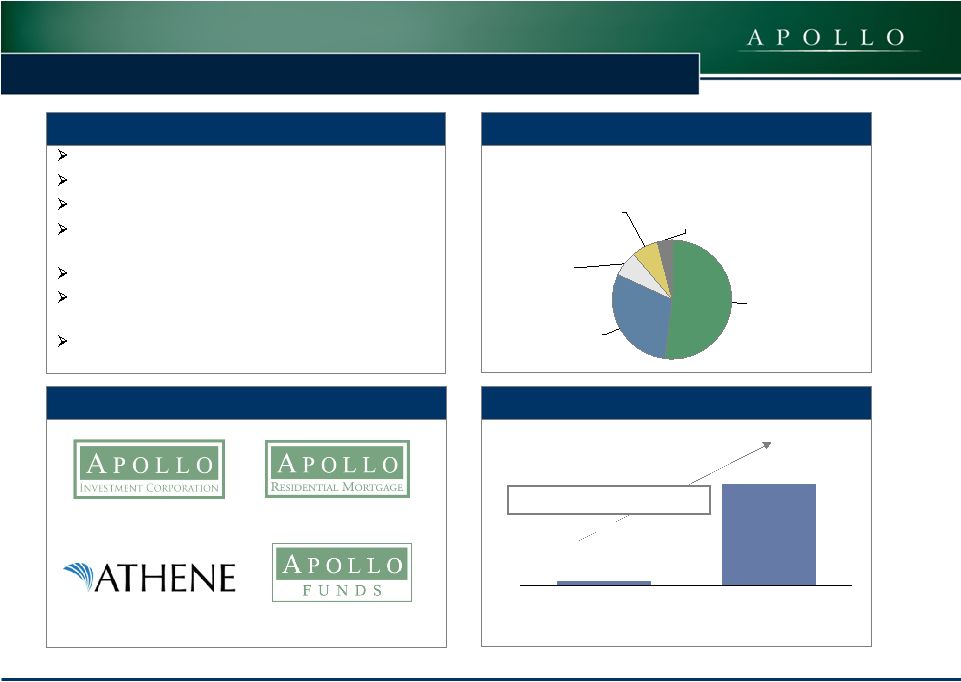
 5
Apollo Global Management Overview
Private Equity
$38bn
AUM
Capital Markets
(3)
$56bn
AUM
Principal Investment Businesses
(1)
Natural Resources
(2)
~$1bn
AUM
Real Estate
$8bn
AUM
Los Angeles
New York
London
Singapore
Frankfurt
Luxembourg
Mumbai
Hong Kong
Houston
Firm Profile
(1)
Founded:
1990
AUM:
$105 bn
Employees:
616
Inv. Prof.:
237
Global Footprint
Investment Approach
Value-oriented
Contrarian
Opportunistic across
market cycles
Integrated platform across
asset classes and
geographies
Deep industry knowledge
Invest across the capital
structure
1.
As of June 30, 2012. (2) Approximate total commitments as of June
30, 2012. There can be no assurance as to the final committed capital. (3) Includes three funds that are denominated in Euros and translated into U.S.
dollars at an exchange rate of €1.00 to $1.27 as of June 30,
2012. |
 6
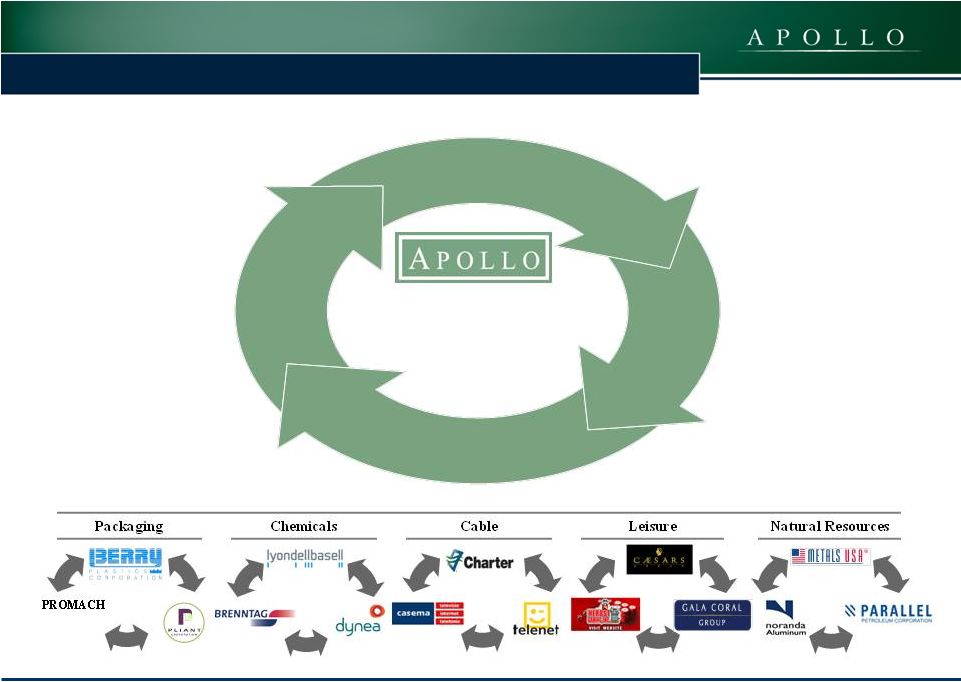
Apollo’s Fully Integrated Business Model
Industry Insights
Management Relationships
Investment Opportunities
Capital
Markets
Investment Opportunities
Market Insights
Market Relationships
Private
Equity
Development of industry insight through :
–
Over 300 current and former portfolio
companies
–
Exclusive strategic relationships
with industry executives
–
Significant relationships at CEO,
CFO and board level
Real
Estate
Natural
Resources
Note: The listed companies are a sample of Apollo private equity
and capital markets investments. The list was compiled based on non-performance criteria and are not representative of all transactions of a given type or
investment of any Apollo fund generally, and are solely intended to be
illustrative of the type of investments across certain core industries that may be made by the Apollo funds. There can be no guarantees that any similar
investment opportunities will be available or pursued by Apollo in the
future. It contains companies which are not currently held in any Apollo portfolio. |
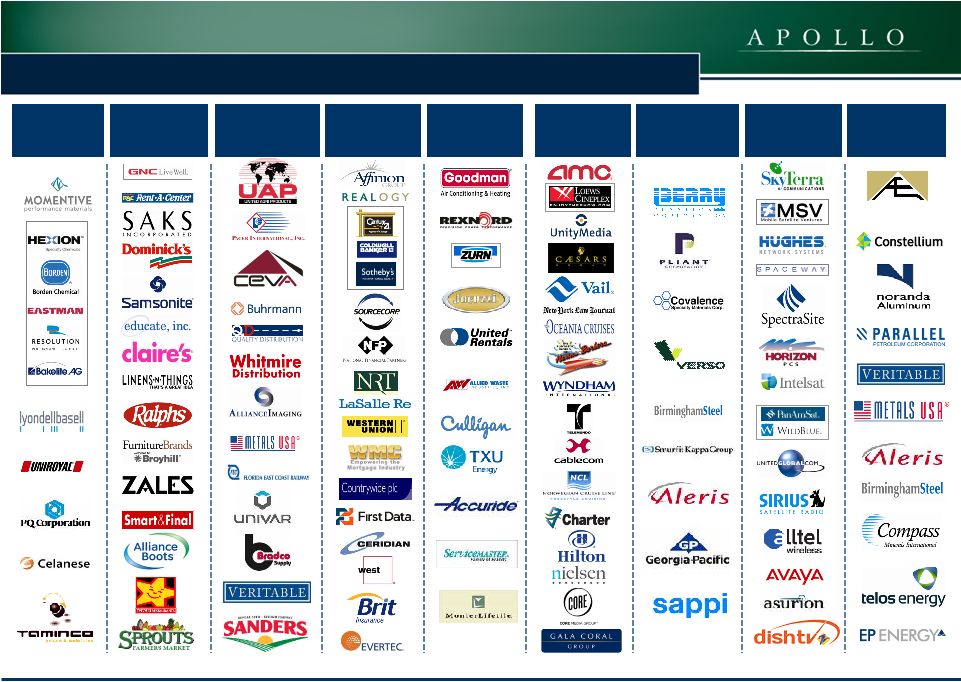 7
Apollo’s Expertise –
Nine Core Industries
Chemicals
Consumer
& Retail
Distribution &
Transportation
Financial &
Business
Services
Manufacturing
& Industrial
Media, Cable &
Leisure
Packaging &
Materials
Satellite &
Wireless
Commodities
ATHLON ENERGY
Note: The listed companies are a sample of Apollo private equity
and capital markets investments. The list was compiled based on non-performance criteria and are not representative of all transactions of a given
type or investment of any Apollo fund generally, and are solely intended
to be illustrative of the type of investments across certain core industries that may be made by the Apollo funds. There can be no guarantees
that any similar investment opportunities will be available or pursued
by Apollo in the future. It contains companies which are not currently held in any Apollo portfolio. |
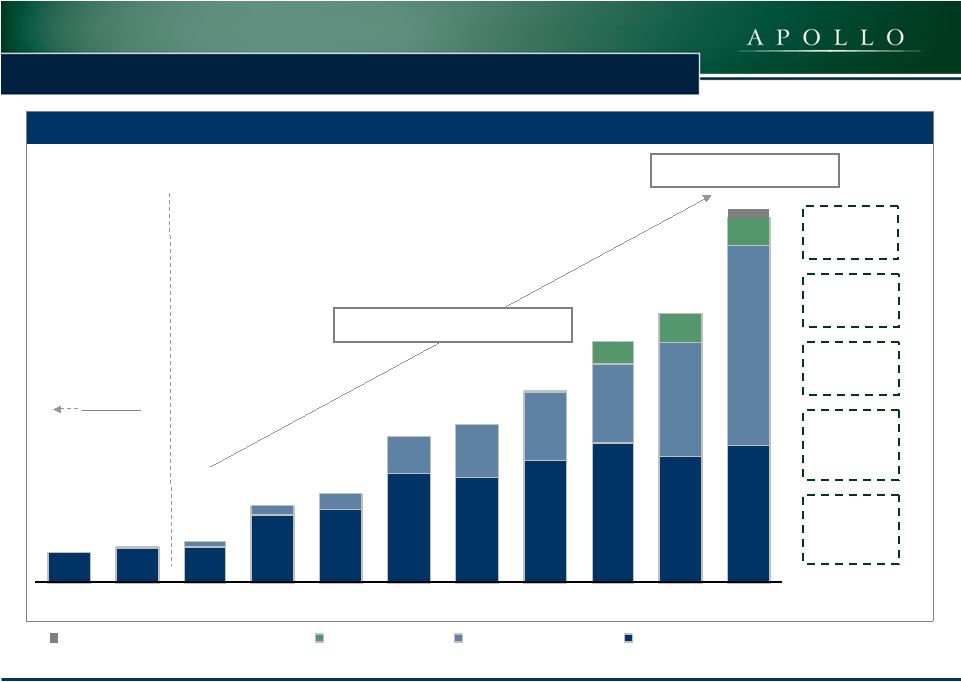 8
Apollo’s Total AUM Has Grown By More Than 10x Over the Last
Decade $8,163
$9,200
$9,765
$18,734
$20,186
$30,237
$29,094
$34,002
$38,799
$35,384
$38,228
$529
$1,557
$2,463
$4,392
$10,533
$15,108
$19,112
$22,283
$31,867
$56,108
$495
$6,469
$7,971
$7,861
$2,696
2002
2003
2004
2005
2006
2007
2008
2009
2010
2011
June 2012
Unallocated Strategic Account AUM
Real Estate AUM
Capital Markets AUM
Private Equity AUM
1990-2002:
PE Only
Significant Growth and Diversification
Strategic
Acquisitions
& Alliances
Geographic
Expansion
New Product
Development
Scale Existing
Businesses
2013 and
Beyond
New
Distribution
Channels
($ in millions)
Apollo AUM CAGR: 35%
Total AUM: $105 bn |
 9
Growing Global Base of Loyal Long-Term Investors
Long-Lived
Asset
Base
1
Recent Mandates for Large Strategic Partnerships
Total AUM: $68 billion
Approximately 92% of AUM was in funds with a contractual
life at inception of seven years or more
Customized
strategic
partnerships
enable
Apollo’s
institutional investors to be more opportunistic and
well-positioned to capture value in today’s market
1.
As of June 30, 2012. Duration of AUM based on contractual life at
inception. 9
Large State
Pension Plan
$3 billion
Large State
Pension Plan
$1.5 billion
Large
Sovereign
Wealth Fund
$500 million
Large
U.S. City
Pension Plan
$600 million
Large
Sovereign
Wealth Fund
€200 million
Select Apollo Strategic Partnerships:
7 or More Years
(excl. Perm. Capital)
85%
Permanent Capital
7%
Fewer than 7 Years
8% |
 10
Significant Progress Since Our IPO
10
10
Increased
total AUM by 50%
from $70 billion to $105 billion
Raised
$9.6 billion
of third party capital across the Apollo platform
Deployed
$5.2 billion
of private equity capital
Distributed $1.61 per share
of cash to our shareholders over the last six quarters
Acquired two alternative credit managers
(Stone Tower, Gulf Stream) with
approximately $21 billion of assets under management
Since its IPO in March, 2011, Apollo has continued to execute against
its growth plan |
 11
Agenda
1.
Background & Business Model
2.
Secular Opportunity
3.
Business Segments
4.
Financial Overview |
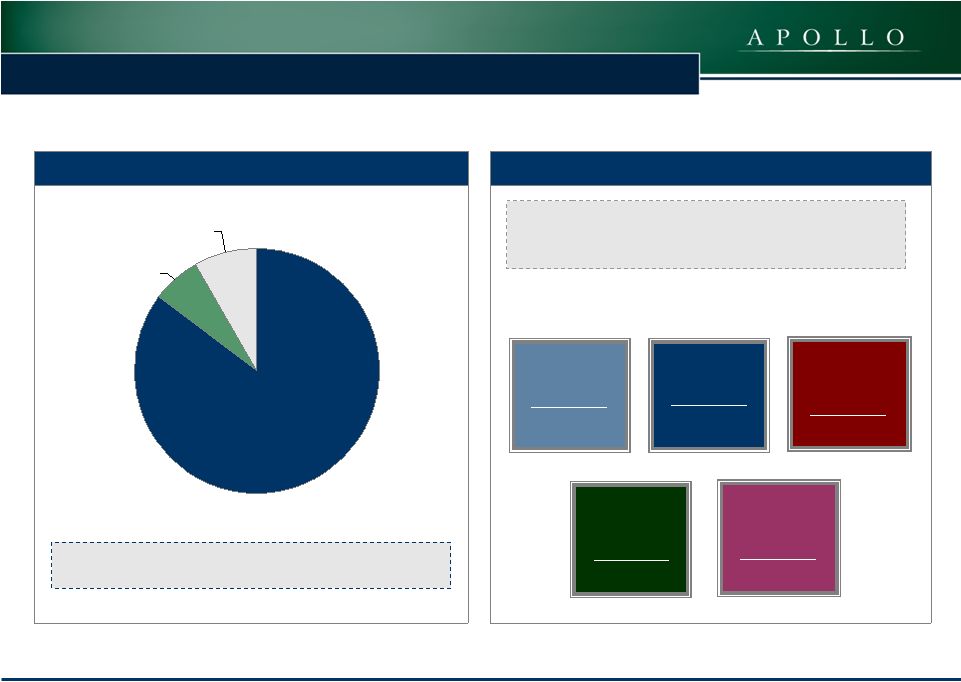
 12
Current Pension Allocation Plans are Broken
Real Assets
8%
Equities
41%
Cash, Other; 6%
Alternatives
12%
Fixed Income
33%
20 Year
10 Year
5 year
Projected
(2)
7.8%
2.9%
(0.3%)
3-5%
6.5%
5.8%
6.5%
2-4%
13.5%
12.0%
7.2%
15+%
8.1%
8.1%
3.1%
9-12%
Typical
Pension
Allocation
(1)
Historical Asset Class Returns
(1)
(1)
(1)
(1)
1. Source: Russell Investments 2012
Global Survey on Alternative Investing. Sources: Equities – PerTrac for S&P 500 Total Return as of December 31, 2011; Fixed Income – PerTrac for Barclay’s Aggregate Bond
Index as of December 31, 2011; Alternatives - Cambridge Associates
LLC U.S. Private Equity Index and Benchmark Statistics, December 31, 2011; returns represent End-to-End Pooled Mean Net to Limited
Partners for all U.S. Private Equity; Real Assets – PerTrac for
NCREIF National Index as of December 31, 2011.
2 Represents Apollo estimates for returns over next 3-5 years based on current market trading levels, interest rates and potential interest rate changes over time, inflation and expected inflation, third
party
research, comparable analysis, precedent transactions and current and
expected underwriting levels. No assurances can be made that these projections will be met. |
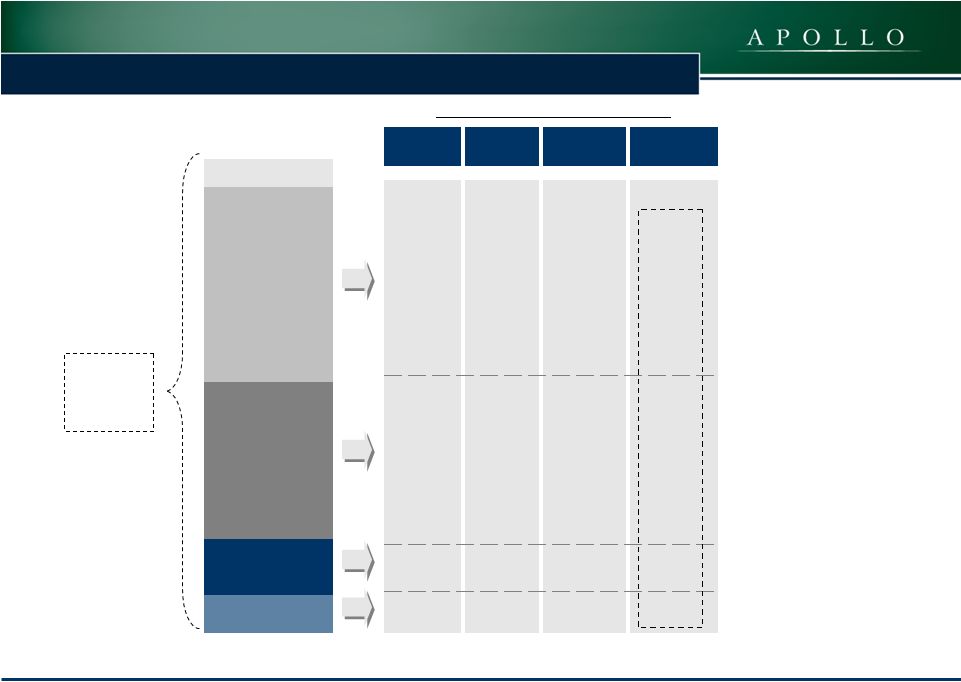
 13
Alternatives are Growing as Investors Search for Yield
13
1.
Source: Towers Watson Global Pension Assets Study 2012.
Portfolio Allocations to Alternatives Have
Quadrupled
Since
1995
(1)
49%
51%
41%
46%
37%
39%
5%
12%
20%
0%
10%
20%
30%
40%
50%
60%
1995
2003
2011E
Equities
Alternatives
Fixed Income / Cash
“Cash-strapped US Pension Funds Ditch
Stocks For Alternatives”
—
Reuters (8/18/12)
“Alternatives Becoming Mainstream”
—
Asset Allocation News (7/27/12)
“In Search of Diversification and Alpha,
Investors Seek Alts…”
—
Asset International (6/19/12)
“Alts Poised to Gain Significant Market
Share…”
—
Fundfire (5/7/12)
“Alternatives Growing in Portfolios as
Markets Stumble”
—
AdvisorOne (6/4/12) |
 14
Agenda
1.
Background & Business Model
2.
Secular Opportunity
3.
Business Segments
4.
Financial Overview |
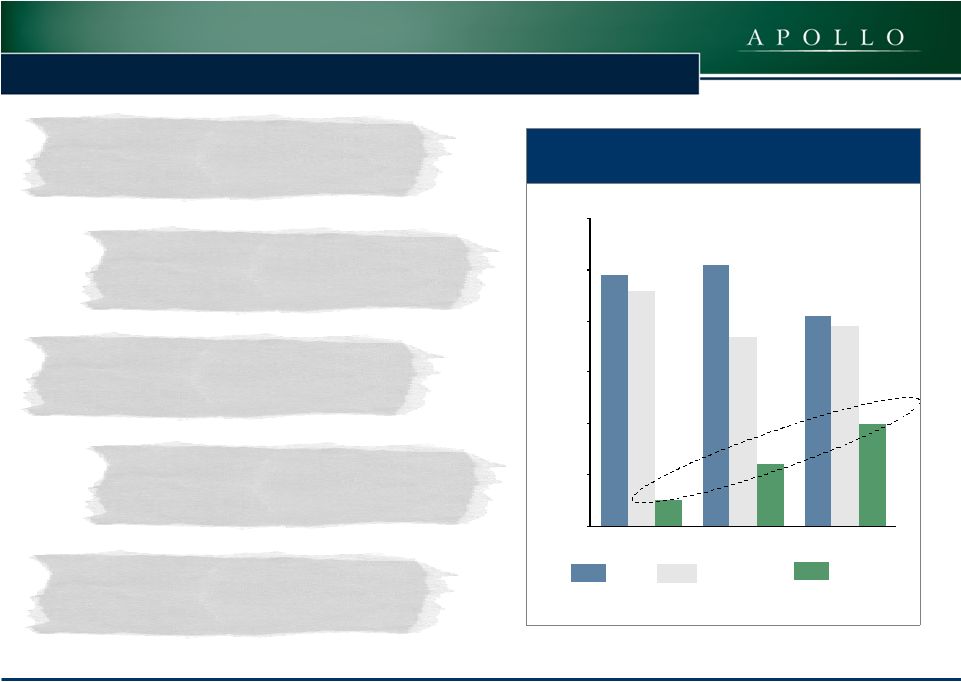
 15
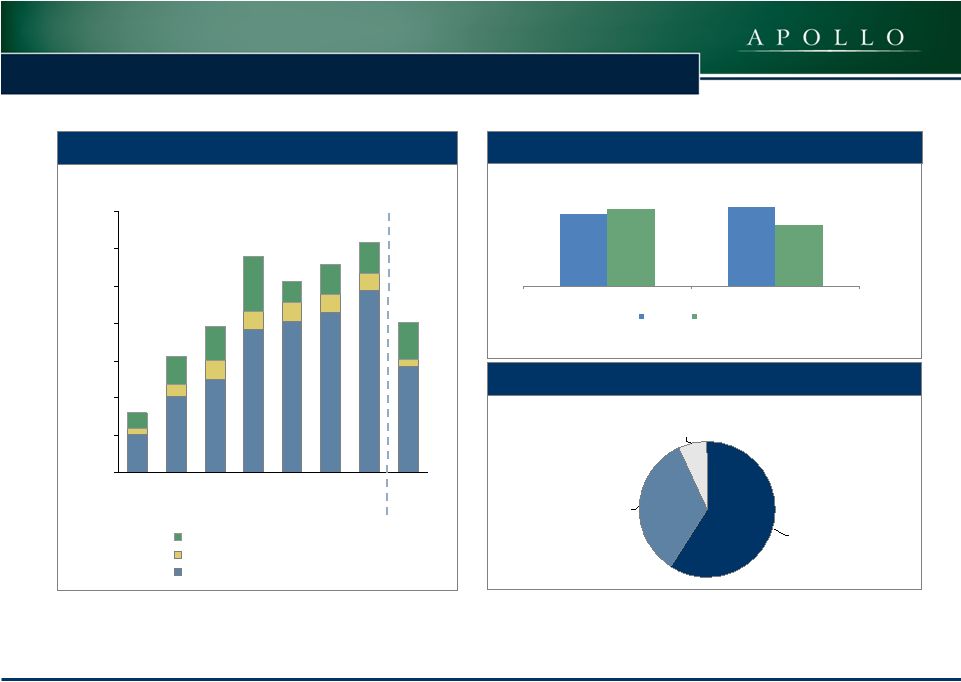
Private Equity Business Overview
15
Highlights
(1)
$38.2bn in AUM ($27.8bn in fee generating)
–
16% CAGR (12/31/07-
6/30/12) fee generating
$6.6bn of “dry powder”
–
Latest fund (Fund VII) total value 1.5x total
invested capital
Value orientation: Buyouts completed at lower
EBITDA multiples than industry averages
Significant
focus
on
distressed
since
inception
(2)
–
$11.1 billion in 247 distressed investments
–
Generated MOIC of 1.9x and 49% gross IRR
Steady Pace of Capital Deployment
Remaining Capital
Invested
$9,238
($mm)
Recent Portfolio Company IPOs & Sales
$1,266
$334
$802
$565
$757
$1,226
$984
$1,657
Q3'10
Q4'10
Q1'11
Q2'11
Q3'11
Q4'11
Q1'12
Q2'12
$950mm average per quarter
Historical Returns for Selected Asset Classes
(3)
14%
20%
8%
S&P 500
Index
All Private
Equity
Estimated Top
Quartile PE
20 Year
25%
Apollo PE Net
IRR
(4)
1.
As of June 30, 2012. 2. Please refer to the Endnotes at the
end of this presentation. 3. Please refer to the Endnotes at the end of this presentation. 4. Smart & Final sale transaction is pending. |
 16
Capital Markets Business Overview
(1)
16
Diversified Mix of AUM
Highlights
$1.6
$56.1
2004
30-Jun-12
Other including
Strategic
Accounts and
Athene Life Re
$29.1bn
52%
Senior Credit
Funds
$16.9
30%
Non-Performing
Loan Funds
$4.1bn
7%
Mezzanine Funds
$4.0bn
7%
Distressed &
Event Driven
Hedge Funds
$2.0bn
4%
Established in 2003
$56.1 billion AUM ($45.5 billion in fee-generating)
Same value-oriented approach as private equity
Leverage core industry expertise of global Apollo
franchise and benefit from integrated platform
Activities span broad range of credit spectrum
Attractive relative returns with downside protected
strategies
Consists of private locked funds, public permanent
capital vehicles, and more liquid funds
Significant Growth
1.
All figures as of June 30, 2012.
Apollo Captive Investment Vehicles (AUM)
(
$3.4 billion
$437 million
$1.4 billion
$10.7 billion
2004 –
6/30/2012 CAGR: 61%
($bn) |
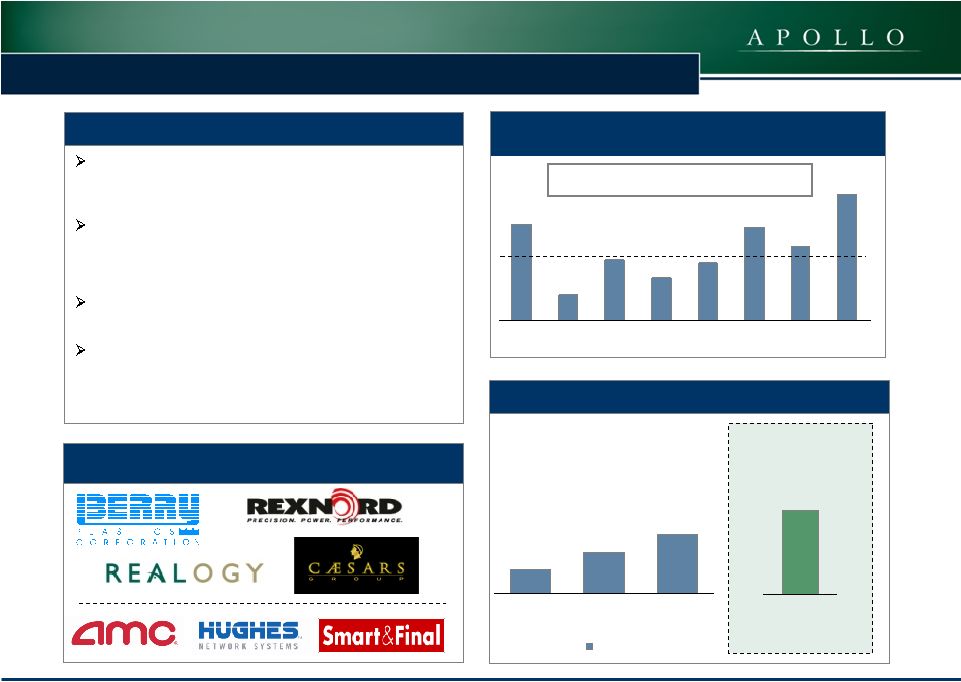
 17
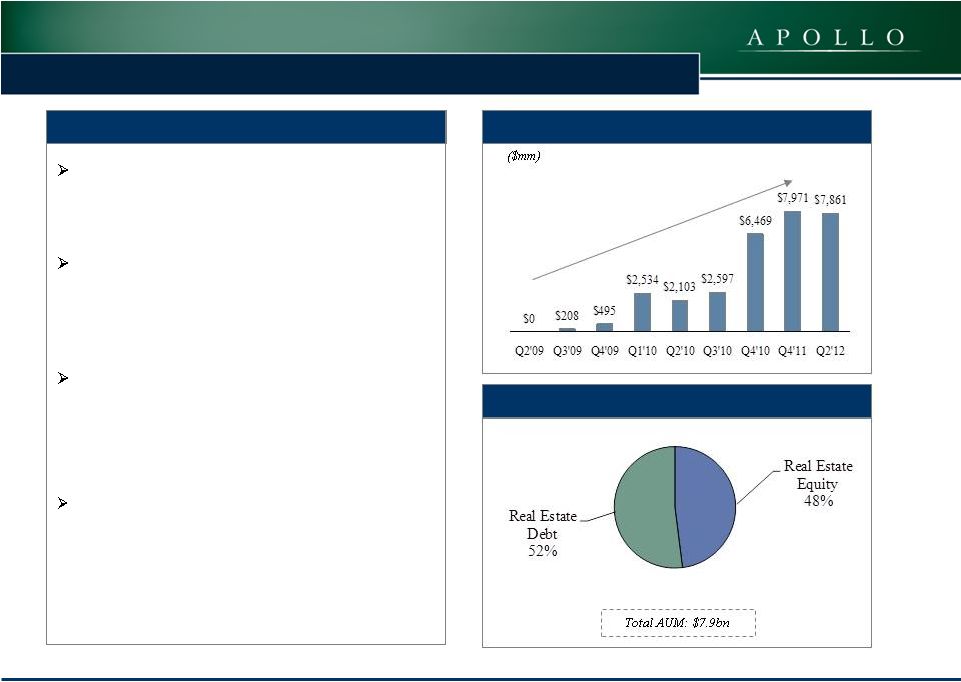
Real Estate Business Overview
Overview
(1)
Apollo Global Real Estate (AGRE) leverages
Apollo’s investment expertise and long history
of investing in real estate-related sectors
AGRE’s investment team has significant
experience in real estate restructuring and
investing in all parts of the capital structure
including both debt and equity
Acquired Citi Property Investors from Citigroup
in November 2010
–
Real estate investment management business
with $3.6 billion in AUM
Recently raised first dedicated U.S. private
equity style fund with total capital of $785
million
1.
All figures as of June 30, 2012.
Real Estate Portfolio Diversification
Growth in Apollo’s Real Estate AUM |
 18
Agenda
1.
Background & Business Model
2.
Secular Opportunity
3.
Business Segments
4.
Financial Overview |
 19
19
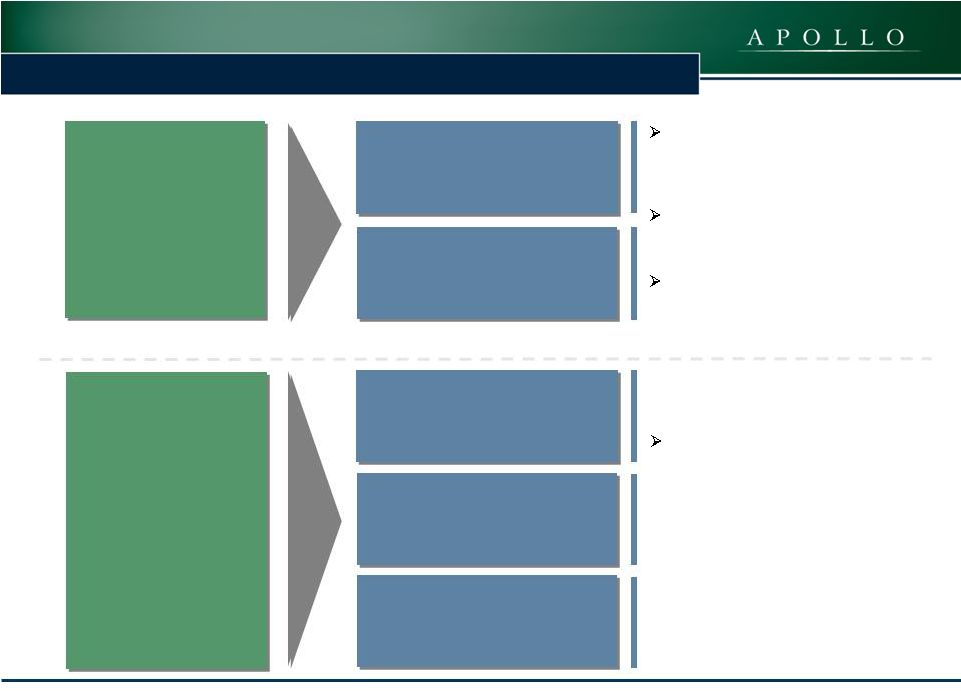
Apollo’s Primary Business Drivers
Management fees are earned
based on a percentage of fee-
generating assets
Transaction fees are generated on
certain completed PE & RE
transactions
Advisory fees are derived
through the ongoing
monitoring of PE portfolio
company operations
Carried interest from our
funds entitles us to as
much as 20% of the income
and gains that are
achieved by the funds net
of fund expenses
Note: Simplified structure for illustrative purposes only.
Assets Under
Management
Investment
Performance
Management Fees
Transaction and Advisory Fees
Private Equity & Real
Estate Carry
Capital Markets Incentive
Income
General Partner Investments |
 20
Steady Growth of Management Fee Revenue
0.94 %
1.03 %
1.00 %
0.80 %
Private Equity
Capital Markets
Q2 2011
Q2 2012
Management Business Revenues
Management Fee as % of Avg. Fee Generating AUM
$159.6
$313.8
$391.6
$579.3
$512.7
$558.3
$617.0
$402.5
$0
$100
$200
$300
$400
$500
$600
$700
2005
2006
2007
2008
2009
2010
2011
1H
2012
Advisory & Transaction Fees
Net Interest Income
Management Fees
($mm)
Revenue Breakdown by Business Segment
(1)
Private Equity
59%
Real Estate
7%
Capital
Markets
34%
1.
Based on segment revenues for Q2 2012. |
 21
21
Overview of Carried Interest
$ in millions
As of 6/30/12
Carried Interest Receivable by Segment:
Private Equity
$990.6
Capital Markets
308.8
Real Estate
3.4
Total Carried Interest Rec.
$1,302.8
Less: Profit Sharing Payable
665.9
Net Carried Interest Receivable
$636.9
% of Portfolio Marks Valued Using Exchange
or Broker Quotes
(1)
as of 6/30/12
87%
59%
72%
47%
Total
Real
Estate
Capital
Markets
Private
Equity
Note: Past performance is not indicative of future results.
1.
Percent of investments valued using listed exchange quotes or broker
quotes. |
 22
22
AGM Key Balance Sheet Indicators
AGM Key Balance Sheet Indicators as of June 30, 2012
($ in millions, except per share data)
Cash and Cash Equivalents
$620
G.P and L.P. Investments Held by AGM
404
Carried Interest Receivable
1,302
Profit Sharing Payable
666
Shareholders Equity (excluding consolidated entities)
3,293
Total Debt
738
Q2 2012 Dividend Per Share
$0.24
Net Carry
Receivable
$636
Note: Past performance is not indicative of future results.
1.
Dividend for Q2 2012 declared on August 2, 2012.
(1) |
 23
Cash Distributions to Shareholders
Since the beginning of 2011, Apollo has distributed an average
quarterly cash distribution of $0.27 per share
(1)
($ per share)
~$0.07
regular
distribution
~$0.08 from
interest and
dividends
~$0.12 from
one-time
realizations
1.
Past performance is not indicative of future results.
|
 24
24
AGM’s
Financial
Summary
–
Combined
Segments
(1)
For the Three Months Ended June
For the Six Months Ended June
$ in millions
2012
2011
2012
2011
Total
Assets
under
Management
(2)
Private Equity
$38,228
$40,430
$38,228
$40,430
Capital Markets
56,108
23,684
56,108
23,684
Real Estate
7,861
7,600
7,861
7,600
TOTAL AUM
$104,893
(1)
$71,714
$104,893
(1)
$71,714
Management Business Revenues
Management Fees
156.4
121.2
286.4
239.4
Net Advisory & Transaction Fees
70.0
23.6
97.3
43.0
Carried Interest (from AIC)
9.2
11.2
18.8
23.7
Total Management Business Revenues
235.6
156.0
402.5
306.1
Management Business Expenses
158.3
137.6
295.8
277.6
Other Management Business Income / (Loss)
(6.9)
12.1
(1.1)
16.8
Management Business ENI
70.4
30.5
105.5
45.2
Incentive Business
Carried Interest Income
3.2
152.9
627.2
699.2
Carry & Incentive Fee Compensation
19.8
67.1
268.9
294.4
Other Incentive Business Income/(Loss)
(11.8)
9.0
40.2
51.9
Incentive Business ENI
(28.4)
94.8
398.5
456.7
Total ENI (after tax)
18.7
117.5
441.0
468.9
Total ENI per share
$0.05
$0.31
$1.15
$1.29
Distributions per share
$0.24
$0.24
$0.49
$0.46
1.
Totals may not sum due to rounding..
2.
Includes $2.7 billion of commitments that have yet to be deployed to an
Apollo fund within Apollo’s three segments. |
 25
25 |
 26
26
ENI to GAAP Earnings Reconciliation
($'s in millions)
June 30, 2012
June 30, 2011
June 30, 2012
June 30, 2011
Reconciliation of GAAP Net Income to ENI and Adjusted ENI
Net Income (loss) attributable to Apollo Global Management, LLC
(41.3)
$
(51.0)
$
56.7
$
(12.8)
$
Impact of non-cash charges related to
equity-based compensation 127.8
270.4
257.8
540.8
Income tax provision
10.6
3.6
25.2
12.4
Amortization of intangible assets associated with 2007 Reorganization and acquisition. . . .
. 9.6
4.3
15.7
7.5
Net income (loss) attributable to Non-Controlling Interests in Apollo Operating Group. . .
. . (64.7)
(102.0)
148.6
(46.0)
Economic Net Income.. . . . . . . . . . . . . . . . . . . . . . . . . . . . . . . .
. . . . . . . . . . . . . . .
42.0
$
125.3
$
504.0
$
501.9
$
For the Three Months Ended
For the Six Months Ended
. . . . . . . . . . . . . . . . . . . . . .
. . . . . . . . . . . . . . . . . . . . . .
. . . . . . . . .. . . . . . . . . . . . . . . . . . . . . . . . . . . . . . . . . . . . . .
. . . . . . . . . . . . . . |
 27
27
Endnotes
Footnotes from Page 15:
1.
Data as of June 30, 2012.
2.
Information for Apollo’s
distressed
investment
experience
is
provided
to
illustrate
the
Firm’s
experience
making
distressed
investments
since
the
Firm’s
inception. While
Apollo
believes
the
performance
represents
all
such
distressed
investments,
there
can
be
no
assurance
as
to
the
validity of such
methodology or determination. Gross IRRs and MOIC are computed prior
to management fees, incentive compensation, certain expenses and taxes,
which, if given effect to, would reduce such returns and, in
the aggregate, are expected to be substantial. Gross
IRRs are based on actual cash flows to and from the respective
Apollo fund in accordance with the applicable provisions within the partnership agreement of the relevant Apollo fund, as well
as the valuations for unrealized investments as of June 30, 2012.
3.
(a) S&P
as
of
June
30,
2012.
(b)
All
Private
Equity
per
Cambridge
Associates
LLC
U.S.
Private
Equity
Index
and
Benchmark
Statistics,
March 31,
2012, the most recent data available. Returns represent
End-to-End Pooled Mean Net to Limited Partners (net of fees, expenses and carried interest)
for all U.S. Private Equity. (c) Estimated Top Quartile Private Equity
per Cambridge Associates LLC U.S. Private Equity Index and Benchmark
Statistics, March 31, 2012, the most recent data available. Estimated
Top Quartile PE numbers are calculated by taking 20 year return metrics as
described above and adding the average of the delta between Top
Quartile IRRs and the Pooled Mean Net to Limited Partners for the selected
timeframe. (d) Apollo Private Equity Net IRR represents returns of all
Apollo Private Equity funds since inception in 1990 through June 30, 2012. |