Attached files
| file | filename |
|---|---|
| EX-99.1 - TRANSCRIPT OF ALCOA INC. THIRD QUARTER 2012 EARNINGS CALL - Howmet Aerospace Inc. | d424171dex991.htm |
| 8-K - FORM 8-K - Howmet Aerospace Inc. | d424171d8k.htm |
 0
[Alcoa logo]
3
rd
Quarter
Earnings
Conference
October 9, 2012
Exhibit 99.2 |
 1
[Alcoa logo]
Cautionary Statement
Forward-Looking Statements This presentation
contains statements that relate to future events and expectations and as such constitute forward-looking statements. Forward-looking
statements include those containing such words as “anticipates,” “estimates,”
“expects,” “forecasts,” “intends,” “outlook,” “plans,” “projects,” “should,”
“targets,” “will,” or other words of similar meaning. All statements that
reflect Alcoa’s expectations, assumptions, or projections about the future other than
statements of historical fact are forward-looking statements, including, without limitation,
forecasts concerning global demand growth for aluminum, end- market conditions,
supply/demand balances, and growth opportunities for aluminum in automotive, aerospace and other applications, trend projections,
targeted financial results or operating performance, and statements about Alcoa’s strategies,
outlook, and business and financial prospects. Forward- looking statements are subject
to a number of known and unknown risks, uncertainties, and other factors and are not guarantees of future performance.
Important factors that could cause actual results to differ materially from those in the
forward-looking statements include: (a) material adverse changes in aluminum industry
conditions, including global supply and demand conditions and fluctuations in London Metal Exchange-based prices for primary
aluminum, alumina, and other products, and fluctuations in indexed-based and spot prices for
alumina; (b) deterioration in global economic and financial market conditions generally; (c)
unfavorable changes in the markets served by Alcoa, including automotive and commercial transportation, aerospace,
building and construction, distribution, packaging, defense, and industrial gas turbine; (d) the
impact of changes in foreign currency exchange rates on costs and results, particularly the
Australian dollar, Brazilian real, Canadian dollar, euro, and Norwegian kroner; (e) increases in energy costs, including electricity,
natural gas, and fuel oil, or the unavailability or interruption of energy supplies; (f) increases in
the costs of other raw materials, including calcined petroleum coke, caustic soda, and liquid
pitch; (g) Alcoa’s inability to achieve the level of revenue growth, cash generation, cost savings, improvement in profitability
and margins, fiscal discipline, or strengthening of competitiveness and operations (including moving
its alumina refining and aluminum smelting businesses down on the industry cost curves and
increasing revenues in its Global Rolled Products and Engineered Products and Solutions segments) anticipated from
its restructuring programs and productivity improvement, cash sustainability, and other initiatives;
(h) Alcoa's inability to realize expected benefits, in each case as planned and by targeted
completion dates, from sales of non-core assets, such as the announced sale of the Tapoco hydroelectric project, or from
newly constructed, expanded, or acquired facilities, such as the upstream operations in Brazil and the
investments in hydropower projects in Brazil, or from international joint ventures, including
the joint venture in Saudi Arabia; (i) political, economic, and regulatory risks in the countries in which Alcoa operates or
sells products, including unfavorable changes in laws and governmental policies, civil unrest, or
other events beyond Alcoa’s control; (j) the outcome of contingencies, including legal
proceedings, government investigations, and environmental remediation; (k) the business or financial condition of key
customers, suppliers, and business partners; (l) adverse changes in tax rates or benefits; (m) adverse
changes in discount rates or investment returns on pension assets; (n) the impact of cyber
attacks and potential information technology or data security breaches; and (o) the other risk factors summarized in
Alcoa's Form 10-K for the year ended December 31, 2011 and other reports filed with the Securities
and Exchange Commission. Alcoa disclaims any obligation to update publicly any
forward-looking statements, whether in response to new information, future events or otherwise, except as required by
applicable law.
Non-GAAP Financial Measures Some of the
information included in this presentation is derived from Alcoa’s consolidated financial information but is not presented in Alcoa’s financial
statements prepared in accordance with U.S. generally accepted accounting principles (GAAP).
Certain of these data are considered “non-GAAP financial measures” under SEC
rules. These non-GAAP financial measures supplement our GAAP disclosures and should not be considered an alternative to the
GAAP measure. Reconciliations to the most directly comparable GAAP financial measures and
management’s rationale for the use of the non-GAAP financial measures can be found in
the Appendix to this presentation and on our website at www.alcoa.com under the “Invest” section. Any reference
during the discussion today to EBITDA means adjusted EBITDA, for which we have provided calculations
and reconciliations in the Appendix and on our website. |
 2
[Alcoa logo]
Chuck McLane
Executive Vice President and Chief Financial Officer
October 9, 2012 |
 3
[Alcoa logo]
3
rd
Quarter 2012 Financial Overview
See appendix for reconciliations to GAAP and additional information
Loss from Continuing
Operations $0.13 per share;
Excluding
restructuring other special items:
•
Income from continuing operations $32 million, or $0.03 per share Revenue
Adjusted EBITDA
Upstream
sequential performance improvement
Midstream and
Downstream record third quarter
Days Working
Capital record low third quarter Debt-to-Capital
Net Debt-to-Capital
Cash on hand of $1.4 billion
at $5.8 billion
of $143 million, or
impact of
of $282 million
delivers significant
achieved
at 33 days, a
of 36.1%,
of 32.4%
and
of
results |
 4
[Alcoa logo]
Income Statement Summary
$ Millions, except per-share amounts
3Q11
Actual
2Q12
Actual
3Q12
Actual
Sequential
Change
Sales
$6,419
$5,963
$5,833
($130)
Cost of Goods Sold
$5,290
$5,154
$5,266
$112
82.4%
86.4%
90.3%
3.9 % pts.
Selling, General Administrative, Other
$261
$245
$234
($11)
4.1%
4.1%
4.0%
(0.1 % pts.)
Other Expenses (Income), Net
$31
$22
($2)
($24)
Restructuring and Other Charges
$9
$15
$2
($13)
Effective Tax Rate
19.6%
(216.7%)
15.9%
232.6 % pts.
Income (Loss) from Continuing Operations
$172
($2)
($143)
($141)
Income (Loss) Per Diluted Share
$0.15
$0.00
($0.13)
($0.13)
Income Statement Summary
COGS % Sales
SGA % Sales |
 5
[Alcoa logo]
Restructuring and Other Special Items
$ Millions, except per-share amounts
2Q12
3Q12
Income Statement
Classification
Segment
Loss from Continuing Ops
($2)
($143)
Loss Per Diluted Share
$0.00
($0.13)
Environmental Reserve
($13)
($120)
COGS
Corporate
Litigation Reserve
($18)
($15)
COGS
Corporate
Massena Fire
($12)
($9)
Revenue, COGS and
Other Income/Expense
Primary
Metals/EPS
Discrete Tax Items
($10)
($26)
Income Taxes
Corporate
Mark-to-Market Energy Contracts
-
($3)
Other Income/Expense
Corporate
Restructuring-Related
($10)
($2)
Restructuring and
Other Charges
Corporate
Special Items
($63)
($175)
Income
from
Continuing
Ops
excl
Special
Items
$61
$32
Income per Diluted Share excl Special Items
$0.06
$0.03
See appendix for Adjusted income reconciliation |
 6
[Alcoa logo]
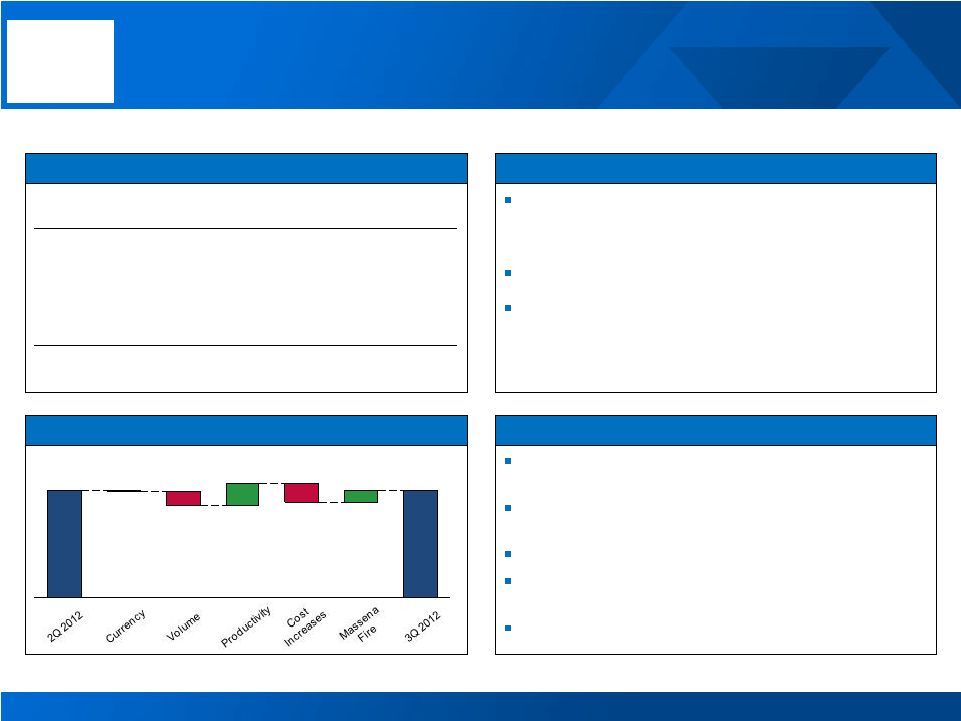
Income from Continuing Operations Excluding Restructuring & Other Special
Items ($ millions) -$94m
+$86m
-$21m
32
61
3Q 2012
Cost
Increases
/ Other
24
Raw
Materials
3
Productivity
55
34
Volume
3
Currency
3
LME
2Q 2012
3
Quarter 2012 vs. 2
Quarter 2012 Earnings Bridge
See appendix for Adjusted income reconciliation
91
Price
/Mix
rd
nd |
 7
[Alcoa logo]
Alumina
Higher
shipments
stemming
from
prior
quarter
shipping
delays
Price/mix
driven
by
stable
API
pricing
despite
LME
decline
Continued
productivity
improvements
Energy
improvements
driven
by
lower
fuel
oil
prices
Working
capital
improved
1
day
vs.
prior
year
quarter
3 Quarter Results
3
Quarter Business Highlights
3
Quarter Performance Bridge
4 Quarter Outlook
Alumina Q3 Results and Q4 Outlook
3Q 11
2Q 12
3Q 12
Production (kmt)
4,140
4,033
4,077
3 Party Shipments (kmt)
2,256
2,194
2,368
3
Party Revenue ($ Millions)
879
750
764
ATOI ($ Millions)
154
23
(9)
$16
Currency
-$11
LME
3Q
2012
-$9
Raw
Materials
-$4
Energy
$3
Productivity
$23
Price
/ Mix
$32
Volume
-$91
2Q
2012
Market
Performance
+$70m
-$102m
40%
of
3
party
shipments
on
spot
or
alumina
price
index
with
30
day
lag
Other
pricing
to
follow
two-month
lag
to
LME
34%
of
LME
sensitivity
driven
by
alumina
segment
Caustic
pricing
expected
to
remain
level
API
pricing
has
remained
flat
as
LME
has
increased
since
early
September
Productivity
gains
to
continue
rd
rd
rd
th
rd
rd
rd
$23 |
 8
[Alcoa logo]
3
Quarter Performance Bridge
Production
decreased
due
to
curtailments
in
Spain
and Italy
Price/Mix
driven
by
improving
regional
premiums
Continued
productivity
improvements
Raw
materials
driven
by
higher
API
related
alumina
costs,
partially
offset
by
improving
coke
and
pitch
prices
3
Quarter Results
3
Quarter Business Highlights
4
Quarter Outlook
Pricing
to
follow
15
day
lag
to
LME
Curtailments
continue with expected negative $15m
ATOI impact
Expected to close US hydropower asset sale by the
end of the quarter
Productivity gains to continue
Market
Performance
Primary Metals
Primary Metals Q3 Results and Q4 Outlook
3Q 11
2Q 12
3Q 12
Production (kmt)
964
941
938
3
Party Shipments (kmt)
754
749
768
3
Party Revenue ($ Millions)
2,124
1,804
1,794
3
Party Price ($/MT)
2,689
2,329
2,222
ATOI ($ Millions)
110
(3)
(14)
Market
-$3
+$27m
-$38m
2Q
2012
-$19
Energy
Cost
Decrease
$8
Raw
Materials
3Q
2012
-$14
-$1
Prod-
uctivity
$27
Price /
Mix
$13
Volume
-$1
Currency
-$2
LME
-$36
rd
th
rd
rd
rd
rd
rd
Working
capital
improved
4
days
vs.
prior
year
quarter |
 9
[Alcoa logo]
See appendix for Adjusted EBITDA reconciliation
3Q
Record
ATOI
and
adjusted
EBITDA
per
metric
ton
ATOI
up
63%
YOY
quarter
Demand
increases
in
can
stock,
mainly
in
NA
Continued
strong
demand
in
Aero
and
Auto
Europe
seasonal
summer
plant
shutdowns
and
weaker
demand
in
NA
Industrial
Working
capital
improved
5
days
vs.
prior
year
quarter
Aerospace
and
automotive
demand
remain
strong
Seasonal
demand
decrease
in
packaging
European
and
NA
Industrial
markets
weakening;
increasing pricing pressure and demand reduction
Slower
growth
rates
in
China
and
Russia
Continuing
to
deliver
improving
days
working
capital
Global Rolled Products
Global Rolled Products Q3 Results and Q4 Outlook
ATOI ($ Millions)
3Q 11
2Q 12
3Q 12
Global Rolled Products,
excl Russia, China & Other
56
89
89
Russia, China & Other
4
6
9
Total ATOI
60
95
98
Adjusted EBITDA/mt
313
390
395
3
Quarter Results
3
Quarter Business Highlights
4
Quarter Outlook
$98
$95
$19
3Q 2012
2Q 2012
-$2
Currency
-$10
-$4
Volume
3
Quarter Performance Bridge
rd
rd
th
Price/
Mix
Cost
Increase
rd |
 10
[Alcoa logo]
Engineered Products and Solutions
Engineered Products and Solutions Q3 Results and Q4 Outlook
Record
3Q
ATOI
driven
by
productivity
offsetting
seasonal declines
in building & construction and
weakness in commercial transportation
Record quarterly
adjusted EBITDA margin at 20.3%
$13 million of favorable productivity
Continued weaker Building & Construction market in
Europe
Weaker Heavy Duty truck build rates
in NA and
Europe
Weaker global industrial
market
Share gains
through
innovation
continue across all
market sectors
Productivity gains
to continue
See appendix for Adjusted EBITDA reconciliation
($ Millions)
3Q 11
2Q 12
3Q 12
3
Party Revenue
1,373
1,420
1,367
ATOI
138
160
160
Adjusted EBITDA Margin
17.8%
19.4%
20.3%
3
Quarter Results
3 Quarter Business Highlights
4 Quarter Outlook
3 Quarter Performance Bridge
$7
$13
$160
-$11
-$8
-$1
$160
rd
rd
rd
th
rd |
 11
[Alcoa logo]
($ Millions)
3Q11
2Q12
3Q12
Net Income (Loss)
$225
($19)
($175)
DD&A
$377
$364
$366
Change in Working Capital
($93)
($147)
$88
Pension Contributions
($114)
($139)
($163)
Taxes / Other Adjustments
$94
$478
$147
Cash from Operations
$489
$537
$263
Dividends to Shareholders
($33)
($33)
($32)
Change in Debt
$72
($143)
($273)
Distributions to Noncontrolling Interest
($66)
($44)
($1)
Contributions from Noncontrolling Interest
$8
$20
$22
Other Financing Activities
($8)
$2
$2
Cash from Financing Activities
($27)
($198)
($282)
Capital Expenditures
($325)
($291)
($302)
Other Investing Activities
($42)
($63)
$40
Cash from Investing Activities
($367)
($354)
($262)
3Q12 FCF
($39) million
$1.4 billion
of cash
DWC 5 Day
reduction
vs. 3Q 2011
3
rd
Quarter 2012 Cash Flow Overview
3 Quarter 2012 Cash Flow
See appendix for Free Cash Flow and Net Debt-to-Capital
reconciliations Debt-to-Cap
at 36.1%;
Net Debt-to-
Cap at 32.4%
Overview
rd |
 12
[Alcoa logo]
Continued Sustainable Reductions in DWC
Days Working Capital since Fourth Quarter 2008
33
33
32
38
38
39
43
44
41
48
50
55
20
25
30
35
40
45
50
55
-5 days
27
30
33
43
3 days
lower
10 days
lower
3 days
lower
Record Low
3
rd
Quarter |
 13
[Alcoa logo]
(Loss) Income from Continuing Operations excl.
restructuring and other special items
Free Cash Flow
Cash on Hand
Debt ($ Millions) and Debt-to-Capital (%)
Proven Cash Sustainability Efforts Enhance Liquidity
($ Millions)
See appendix for reconciliations to GAAP and additional information
Income and Liquidity Performance Overview
32
61
105
-34
165
364
317
223
96
139
101
9
39
-256
-477
-221
-39
246
-506
656
164
526
-440
1,005
176
87
-22
761
-186
-90
-742
-409
1,432
1,712
1,749
1,939
1,332
1,260
887
1,543
843
1,344
1,292
1,481
1,066
851
1,131
762
9,524
9,542
9,743
9,371
9,311
9,348
9,294
9,800
9,757
9,819
10,073
10,265
10,205
10,578
9,309
9,165
42.5%
38.7%
34.9%
35.3%
36.1%
Debt to Cap
Gross Debt
($ Millions)
($ Millions)
3Q
12
2Q
12
1Q
12
4Q
11
3Q
11
2Q
11
1Q
11
4Q
10
3Q
10
2Q
10
1Q
10
4Q
09
3Q
09
2Q
09
1Q
09
4Q
08
3Q
12
2Q
12
1Q
12
4Q
11
3Q
11
2Q
11
1Q
11
4Q
10
3Q
10
2Q
10
1Q
10
4Q
09
3Q
09
2Q
09
1Q
09
4Q
08
3Q
12
2Q
12
1Q
12
4Q
11
3Q
11
2Q
11
1Q
11
4Q
10
3Q
10
2Q
10
1Q
10
4Q
09
3Q
09
2Q
09
1Q
09
4Q
08
3Q
12
2Q
12
1Q
12
4Q
11
3Q
11
2Q
11
1Q
11
4Q
10
3Q
10
2Q
10
1Q
10
4Q
09
3Q
09
2Q
09
1Q
09
4Q
08 |
 14
[Alcoa logo]
Continuing to Execute in a Challenging Environment
Achieving Targets
Executing Our Strategy
Significant sequential
performance
improvement
in the
upstream
Restructuring through
executed curtailments
Record 3Q ATOI
and
adjusted EBITDA/mt
in the
midstream
Record 3Q adjusted
EBITDA margins
in the
downstream
Productivity
continues
Record 3Q Days Working
Capital
30-35%
$1.7B
$800M
$50M
1.5
days
Positive Free Cash Flow
Delivering Results
Productivity
Overhead
Working Capital
Capital Spend
and Investments
Maintain
Debt-to-Capital |
 15
[Alcoa logo]
Klaus Kleinfeld
Chairman and Chief Executive Officer
October 9, 2012 |
 16
[Alcoa logo]
Source: Alcoa analysis
Alcoa End Markets: Current Assessment of 2012 vs. 2011
North America
China
Global
Europe
4%-8%
prod growth
13%-14%
sales growth
2%-3%
sales growth
2.5%-3.5%
sales growth
3%-5%
airfoil market
growth rate
4%-7%
prod growth
5%-8%
sales growth
7%-8%
sales growth
18%-21%
prod decline
4%-5%
sales growth
8%
sales decline
4%-9%
prod decline
8%-11%
prod decline
11%-15%
prod growth
2%-4%
prod growth
5%
sales decline
-1%-0%
sales flat
Aerospace
Automotive
Heavy Truck &
Trailer
Beverage Can
Packaging
Commercial
Building and
Construction
Industrial Gas
Turbine
2012 Market Conditions
7%-9%
prod decline |
 17
[Alcoa logo]
9%
-2%
4%
5%
6%
6%
1%
5%
20.7
6.5
5.9
5.6
3.5
1.9
1.0
0.9
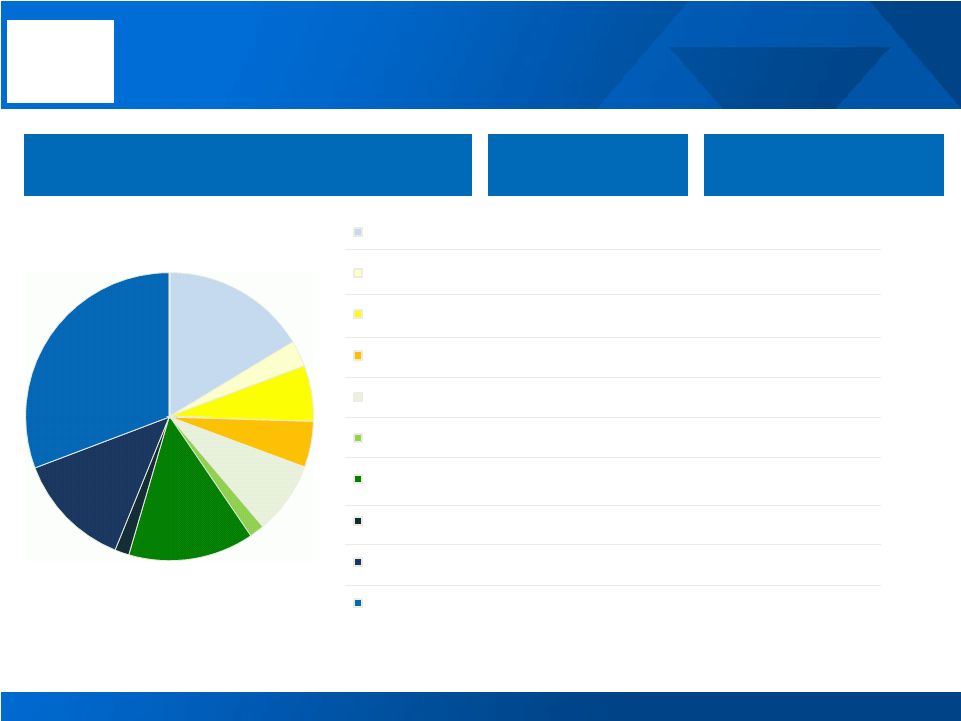
2012 Primary Aluminum Consumption (mmt), Annualized Growth (%) and Change (% pts)
by Region 2012 Consumption
(3Q12 estimate)
Source: Alcoa analysis
Global Aluminum Demand Grows 6% Amid Volatile Environment
Russia
Brazil
India
Other
(1)
Asia ex.China
North America
Europe
China
46.1 mmt
2012 Growth (vs. 2011)
(3Q12 estimate)
Change in Growth
(H1 to H2 in % pts.)
Average: 6%
0%
6%
2%
2%
2%
0%
2%
Russia
Brazil
India
Asia ex.China
North America
Europe
China
4%
Other
(1)
Notes: (1) ‘Other’
consists
of:
Middle
East,
Latin
America
ex
Brazil
and
Rest
of
the
World
(ROW) |
 18
[Alcoa logo]
2012E Alumina Supply/Demand Balance (kmt)
Source: Alcoa estimates, Brook Hunt, CRU, CNIA, IAI
(000 mt)
China
Rest of World
Aug 2012 Annualized Rate
37,400
54,300
2012 Production to be added
300
300
2012 Capacity to be curtailed
(1,000)
(50)
Imports/(Exports)
4,100
(4,100)
Total Supply
40,800
50,450
Demand
(40,200)
(50,650)
Net Balance
600
(200)
Alumina and Aluminum Markets Essentially Balanced
Supply and Demand Analysis
(000 mt)
China
Rest of World
Aug 2012 Annualized Rate
19,824
24,763
2012 Production to be added
1,296
295
2012 Capacity to be curtailed
(320)
(55)
Total Supply
20,800
25,003
Demand
(20,700)
(25,365)
Net Balance
100
(362)
Surplus
400
Supply
Demand
Supply
Demand
Deficit
(262)
2012E Aluminum Supply/Demand Balance (kmt) |
 19
[Alcoa logo]
Tight Physical Market Drives Record Premiums
Source: Alcoa estimates, LME, SHFE, IAI, Marubeni, Platt’s Metals Week and
Metal Bulletin Regional Premiums over time
$ per metric
ton
$ per metric
ton |
 20
[Alcoa logo]
Currently Inventory Levels Are Not Driving the Price
Global
Inventories Decline
27 days from ‘09 peak
Flat from 2Q’12
Days of
Consumption
80 days
LME Price
$2,686/MT
Days of
Consumption
102 days
LME Price
$2,214/MT
Days of
Consumption
75 days
LME Price
$2,112/MT
Global Inventories vs. LME Price over time
Days of
Consumption
LME Price
Source: Alcoa estimates, LME, SHFE, IAI, Marubeni, Platt’s Metals Week and
Metal Bulletin |
 21
[Alcoa logo]
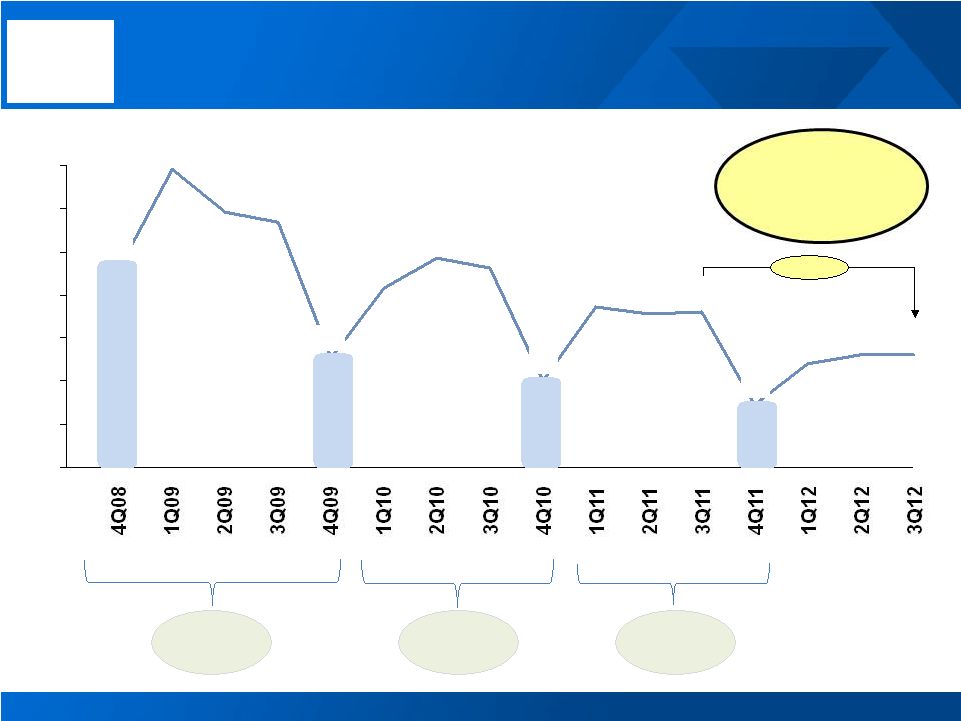
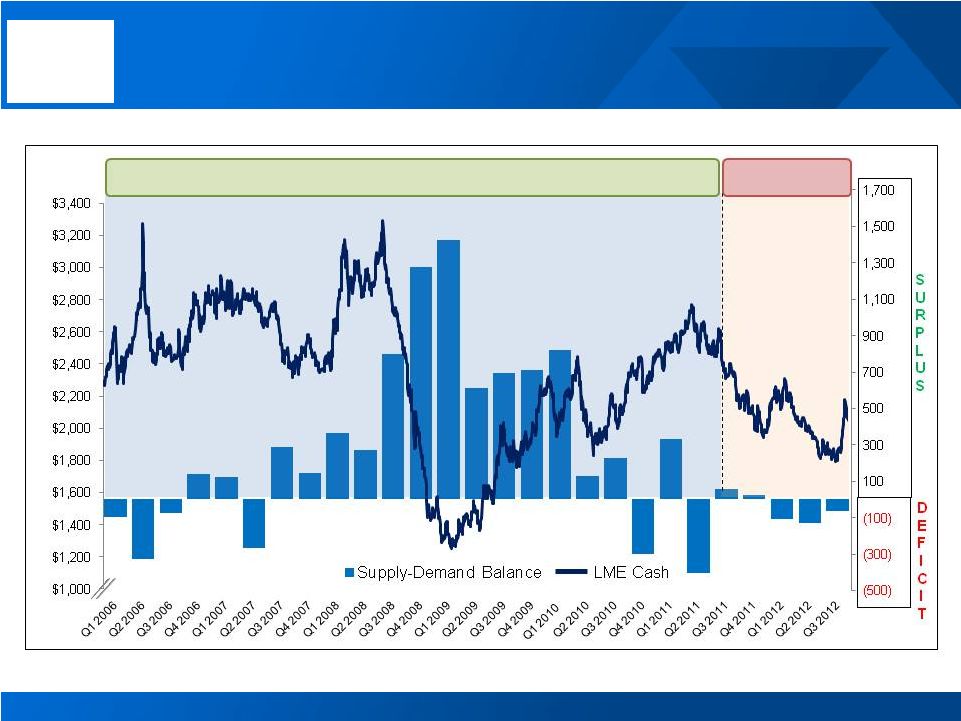
LME Price Remains Decoupled From Market Fundamentals
LME Cash versus Quarterly Supply/Demand Balance
Price SYNCHRONIZED with fundamentals
DECOUPLED
LME Price
Supply/
Demand
Sources: Alcoa estimates, Brook Hunt, CRU, Harbor
|
 22
[Alcoa logo]
Broad Market Sentiment Continues to Dominate Price
Source: Bloomberg
Sept 12
th
German court ruling
LME $2,075
Sept 7
th
China stimulus plan
LME $1,988
Sept 6
th
ECB bond buying program
LME $1,963
Sept 13
th
QE3
LME $2,082
10-Sep-12
17-Sep-12
24-Sep-12
Movement in LME Cash Prices After Economic Announcements
[Alcoa logo] |
 23
[Alcoa logo]
Market Fundamentals Intact; Macro Factors Influence Price
Movement in LME Cash Prices After Economic Announcements
Supply and Demand Analysis
Global Inventories vs. LME Price over time
Regional Premiums Over Time
Market Effectively Balanced
Premiums Remain At Record High
Inventories Down
Market Sentiment Dominates Price
0
10
20
30
40
50
60
70
80
90
100
Days of
Consumption
$1,250
$1,450
$1,650
$1,850
$2,050
$2,250
$2,450
$2,650
$2,850
$3,050
$3,250
LME Price
Days of
Consumption
102 days
LME Price
$2,214/MT
Days of
Consumption
80 days
LME Price
$2,686/MT
Days of
Consumption
75 days
LME Price
$2,112/MT
Global
Inventories Decline
27 days from ‘09 peak
Flat from 2Q’12
Off Exchange
Producer
Japan Port
China ex SRB
LME On Warrant
Cancelled Warrants
LME 3 Mon |
 24
[Alcoa logo]
~40% of
customers on
API or spot
basis by YE
Alumina: Improving Performance Through Margin Focus
Notes: See appendix for Adjusted EBITDA reconciliations
Adjusted EBITDA per MT
Aligning Prices With Market Fundamentals
Five
Year
Plan
To
Improve
Cost
Competitiveness
Executing on the Strategy
Alumina Performance Overview
2010
Strategy Executed
30
th
25
th
20
th
23
rd
30
th
Projecting
1-3% points
by end 2013
Refining Cost Curve
Avg.
Adj. EBITDA/MT
LME
1,433
1,350
YTD
2012
1,664
1,900
Source: API estimate: Alcoa analysis, ABARE, Baltic Exchange, CRU,
Metal Bulletin, PACE Curtailments
complete:
390kmt
curtailed
Productivity
gains
:
$320m
since
2010
Driving
to
API
Pricing
:
~40%
tied
to
spot
or
index-based
pricing
by
the
end
of
2012
-8
days
DWC
from
Q3
2010:
~$115m
in
cash
Saudi
Arabia
project:
on
schedule
and
budget
10-YR Average ~ $67/MT |
 25
[Alcoa logo]
2010
Strategy Executed
50
th
45
th
40
th
41
st
51
st
Projecting
3-6% points
by end 2013
Adjusted EBITDA per MT
Optimizing Cast House Profitability
Taking Action to Move Down the Cost Curve
Executing Our Strategy
Smelting Cost Curve
Primary Metals: Driving Long-Term Improvements
Notes: See appendix for Adjusted EBITDA reconciliations
Primary Metals Performance Overview
10-YR Average ~ $374/MT
Billet
Slab
T-Bar
Foundry
Rod
$375M
Margin*
2011 through
YTD Sept 2012
Avg.
Adj. EBITDA/MT
LME
YTD
2012
2011
2010
2009
-159
1,664
2008
2007
2006
784
2,570
2005
1,900
2004
2003
1,433
2002
1,350
Curtailments:
Italy
more
than
70%
curtailed
Productivity
gains
:
$385m
since
2010
Improving
our
cost
of
power:
USA
(Intalco
and
Mt. Holly), Australia and Brazil
-9
days
DWC
from
Q3
2010:
~$240m
in
cash
Saudi
Arabia
project:
on
schedule
and
budget
* Margin refers to incremental valued added product margin over P1020 primary aluminum |
 26
[Alcoa logo]
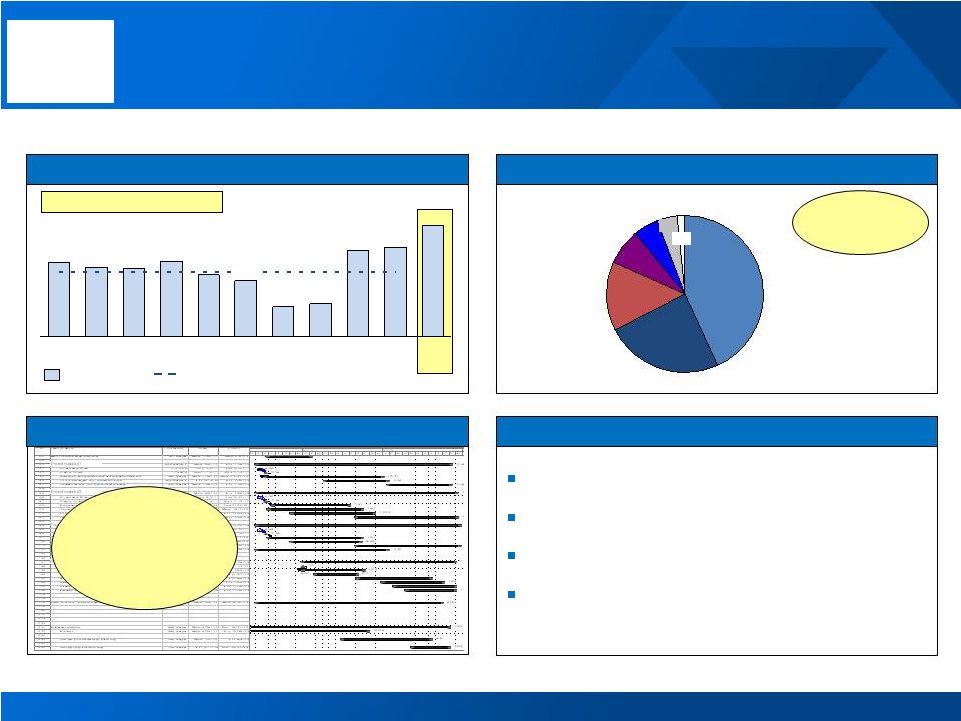
Generating Record Adjusted EBITDA per MT
2012
YTD
3
rd
Party
Sales
by
Market
Davenport
auto
expansion
on
time
&
on
budget
Delivering Results
Global Rolled Products: Leveraging Our Strategic Asset Base
See appendix for Adjusted EBITDA reconciliations
Avg.
Adj. EBITDA/MT
405
327
314
119
108
226
276
249
253
273
2010
2011
YTD
2012
2002
2009
2008
2007
201
2006
2005
2004
2003
10-YR Average ~ $235/MT
Global Rolled Products Performance Overview
Record
YTD
adjusted
EBITDA/ton:
$405/MT
Aero
and
Auto
driving
profitable
growth
Productivity
gains:
$218m
since
2010
-3
days
DWC
from
Q3
2010:
~$60m
in
cash
85%
Utilization
Other
2%
B&C
4%
Commercial Transport
5%
Automotive
8%
Aerospace
14%
Industrial Products
24%
Packaging
43%
1
st
coils
to
be
shipped Dec
2013 |
 27
[Alcoa logo]
Engineered Products & Solutions: Continuing to Grow Profitably
* Alcoa 10/10/2012 Edit: Substituted generic photo which focuses on the
blade section of the engine Setting Record Adjusted EBITDA Margins
Al
Solutions
meet
Commercial
Aerospace
Goals
Strong Platform for Profitable Growth
Record
YTD adjusted EBITDA margins
Productivity
gains:
$350
million
since
2010
Continued
strength
in
global
aerospace
market driving profitable growth
Share
gains
through
innovation
accelerate
growth across all markets
78%
Aerospace
Utilization
65% Other
Utilization
Engineered Products and Solutions Performance Overview
Adj. EBITDA Margin
20%
18%
17%
13%
15%
13%
12%
11%
12%
9%
8%
2008
2007
2006
2005
2004
2003
2002
YTD
2012
2011
2010
2009
6%
Other
Automotive
3%
IGT
7%
Commercial Transport
17%
B&C
18%
Aerospace
49%
$4.6
Al 2026 Stringers
~3.5%
Sharklet
Al 2060 Fan Blade
~15%
*
Notes: See appendix for Adjusted EBITDA reconciliations
2012
YTD
3
rd
Party
Sales
by
Market
3.7% Higher strength to
weight ratio
Ultra efficient, light
weight, low speed
blade
Fuel burn reduction
Fuel burn reduction |
 28
[Alcoa logo]
Regulation and Market Preference Drives Aluminum Demand
Source: Consumer Reports, The Aluminum Association, Ducker Research, Alcoa
Analysis Changing Regulations…
US Corporate Average
Fuel Economy (MPG)
Percentage of consumers willing to pay
more for fuel-efficiency
2011
83%
2008
54%
54.5
35.5
27.2
+100%
2025
2016
2011
…Shifting Buying Behavior…
+31%
37%
of consumers rank
fuel economy as the #1
factor in buying decision
…Drive Substitution
7.5X
increase
Global Auto Body Sheet
Consumption (KMT)
800
200
2020
1,500
2016
2011 |
 29
[Alcoa logo]
Macro Trumps Ali Fundamentals
Controlling Our Own Destiny in a Challenging Environment
Sentiment Drives Price
Demand Solid; Markets
Effectively Balanced
Delivering Results
Capturing Future Growth
Upstream
delivers $98M in
performance improvement
quarter over quarter
Restructuring
high cost
assets
through executed
curtailments
Global Rolled Products:
Record
YTD
ATOI
and
adjusted
EBITDA
of
$405
per metric ton
Engineered Products and
Solutions:
Highest
quarterly
adjusted EBITDA Margin
ever
of 20.3%
Record
low
third
quarter
Days Working Capital
Lightweighting With Aluminum
Necessary to Meet Market Demands
37% of consumers
rank fuel economy as
the #1 factor in buying
decision |
 [Alcoa logo]
30 |
 31
[Alcoa logo]
Kelly Pasterick
Director, Investor Relations
Alcoa
390 Park Avenue
New York, NY 10022-4608
Telephone: (212) 836-2674
www.alcoa.com
Additional Information |
 32
[Alcoa logo]
Annual Sensitivity Summary
Currency Annual Net Income Sensitivity
+/-
$100/MT = +/-
$220 million
LME Aluminum Annual Net Income Sensitivity
Australian $
+/-
$11 million
per 0.01 change in USD / AUD
Brazilian $
+/-
$ 3 million
per 0.01 change in BRL / USD
Euro €
+/-
$ 2 million
per 0.01 change in USD / EUR
Canadian $
+/-
$ 5 million
per 0.01 change in CAD / USD
Norwegian Kroner
+/-
$ 5 million
per 0.10 change in NOK / USD |
 33
[Alcoa logo]
Revenue Change by Market
(2%)
(5%)
(1%)
(13%)
(8%)
2%
(1%)
(10%)
2%
(1%)
9%
2%
(8%)
(10%)
(16%)
(1%)
(6%)
(19%)
(13%)
(16%)
3Q’12 Third-Party Revenue
Sequential
Change
Year-Over-Year
Change
16%
3%
6%
5%
8%
2%
14%
2%
13%
31%
Aerospace
Automotive
B&C
Comm. Transport
Industrial Products
IGT
Packaging
Distribution/Other*
Alumina
Primary Metals |
 34
[Alcoa logo]
Reconciliation of ATOI to Consolidated Net Income (Loss)
Attributable to Alcoa
(in millions)
1Q11
2Q11
3Q11
4Q11
2011
1Q12
2Q12
3Q12
Total segment ATOI
$
555
$
635
$
462
$
241
$
1,893
$
296
$
275
$
235
Unallocated amounts (net of tax):
Impact of LIFO
(24)
(27)
2
11
(38)
–
19
(7)
Interest expense
(72)
(106)
(81)
(81)
(340)
(80)
(80)
(81)
Noncontrolling interests
(58)
(55)
(53)
(28)
(194)
(5)
17
32
Corporate expense
(67)
(76)
(76)
(71)
(290)
(64)
(69)
(62)
Restructuring and other charges
(6)
(22)
(7)
(161)
(196)
(7)
(10)
(2)
Discontinued operations
(1)
(4)
–
2
(3)
–
–
–
Other
(19)
(23)
(75)
(104)
(221)
(46)
(154)
(258)
Consolidated net income (loss) attributable to
Alcoa
$ 308
$ 322
$ 172
$ (191)
$ 611
$ 94
$ (2)
$ (143)
|
 35
[Alcoa logo]
Reconciliation of Adjusted Income
(in millions, except per-
share amounts)
Income (Loss)
Diluted EPS
Quarter ended
Quarter ended
2011
June 30,
2012
2012
2011
June 30,
2012
2012
Net income (loss)
attributable to Alcoa
$ 172
$ (2)
$ (143)
$ 0.15
$ –
$ (0.13)
Loss from discontinued
operations
–
–
–
Income (loss) from
continuing
operations
attributable to Alcoa
172
(2)
(143)
0.15
–
(0.13)
Restructuring and
other charges
5
10
2
Discrete tax items*
(10)
10
26
Other special items**
(2)
43
147
Income from
continuing
operations
attributable to Alcoa
–
as adjusted
$ 165
$
61
$
32
0.15
0.06
0.03
Income from continuing operations attributable to Alcoa – as adjusted is a non-GAAP financial
measure. Management believes that this measure is meaningful to investors because management reviews the
operating results of Alcoa excluding the impacts of restructuring and other charges, discrete tax
items, and other special items (collectively, “special items”). There can be no assurances that additional special
items will not occur in future periods. To compensate for this limitation, management believes
that it is appropriate to consider both Income (loss) from continuing operations attributable to Alcoa determined under
GAAP as well as Income from continuing operations attributable to Alcoa – as adjusted.
* Discrete tax items include the following:
• for the quarter ended September 30, 2012, unbenefitted losses in Italy, China, and Suriname
($35), a benefit as a result of including the anticipated gain from the sale of the Tapoco Hydroelectric Project in the
calculation of the estimated annual effective tax rate ($12), and a net charge for other miscellaneous
items ($3); • for the quarter ended June 30, 2012, a charge related to prior year U.S.
taxes on certain depletable assets ($8) and a net charge for other miscellaneous items ($2); and
• for the quarter ended September 30, 2011, a net benefit for adjustments made related to the
filing of 2010 tax returns in various jurisdictions ($5) and a net benefit for other miscellaneous items ($5).
** Other special items include the following:
• for the quarter ended September 30, 2012, an increase in the environmental reserve mostly
related to the Grasse River remediation in Massena, NY and two new remediation projects at the smelter sites in Baie
Comeau, Canada and Mosjøen, Norway ($120), a litigation reserve ($15), uninsured losses related to
fire damage to the cast house at the Massena, NY location ($9), and a net unfavorable change in certain
mark-to-market energy derivative contracts ($3);
• for the quarter ended June 30, 2012, a litigation reserve ($18), uninsured losses related to
fire damage to the cast house at the Massena, NY location ($12), and a net increase in the environmental reserve
related to the Grasse River remediation in Massena, NY and remediation at two former locations, East
St. Louis, IL and Sherwin, TX ($13); and • for the quarter ended September 30, 2011,
a net favorable mark-to-market change in certain energy derivative contracts ($13) and uninsured losses, including costs related to flood damage to a plant in
Pennsylvania caused by Hurricane Irene, ($11).
September 30,
September 30,
September 30,
September 30, |
 36
[Alcoa logo]
Reconciliation of Adjusted Income, continued
Income (loss) from continuing operations attributable to Alcoa – as adjusted is a non-GAAP
financial measure. Management believes that this measure is meaningful to investors because
management reviews the operating results of Alcoa excluding the impacts of restructuring and other charges, discrete tax items,
and other special items (collectively, “special items”). There can be no assurances that
additional special items will not occur in future periods. To compensate for this limitation,
management believes that it is appropriate to consider both Income (loss) from continuing operations attributable to Alcoa determined under GAAP as
well as Income (loss) from continuing operations attributable to Alcoa – as adjusted.
(in millions)
March 31,
2011
June 30,
2011
September 30,
2011
December 31,
2011
March
31,
2012
Net income (loss)
attributable to Alcoa
$ 308
$ 322
$ 172
$ (191)
$ 94
(Loss) income
from
discontinued
operations
(1)
(4)
–
2
–
Income (loss) from
continuing
operations
attributable to Alcoa
309
326
172
(193)
94
Restructuring and
other charges
5
16
5
155
7
Discrete tax items*
–
–
(10
)
12
–
Other special items**
3
22
(2)
(8)
4
Income
(loss) from
continuing
operations
attributable to Alcoa
–
as adjusted
$ 317
$ 364
$ 165
$ (34)
$ 105
* Discrete tax items include the following:
for the quarter ended December 31, 2011, charges for a tax rate change in Hungary and a tax law change
regarding the utilization of net operating losses in Italy ($8), a charge related to the 2010
change in the tax treatment of federal subsidies received related to prescription drug benefits provided under certain retiree health benefit
plans ($7), and a net benefit for other miscellaneous items ($3); and,
for the quarter ended September 30, 2011, a net benefit for adjustments made related to the filing of
2010 tax returns in various jurisdictions ($5) and a net benefit for other miscellaneous items
($5). ** Other special items include the following:
for the quarter ended March 31, 2012, a net unfavorable change in certain mark-to-market
energy derivative contracts; for the quarter ended December 31, 2011, a gain on the sale of land in Australia ($18), uninsured
losses, including costs related to flood damage to a plant in Pennsylvania caused by Hurricane
Irene, ($14), a net favorable change in certain mark-to-market energy derivative contracts ($8), and the write off of inventory
related to the permanent closure of a smelter in the U.S ($4);
for the quarter ended September 30, 2011, a net favorable mark-to-market change in
certain energy derivative contracts ($13) and uninsured losses, including costs related to
flood damage to a plant in Pennsylvania caused by Hurricane Irene, ($11);
for the quarter ended June 30, 2011, a net charge comprised of expenses for the early repayment of
Notes set to mature in 2013 due to the premiums paid under the tender offers and call option
and gains from the termination of related “in-the-money” interest rate swaps ($32) and a net favorable mark-to-market change in certain
energy derivative contracts ($10); and,
for the quarter ended March 31, 2011, costs related to acquisitions of the aerospace fastener business
of TransDigm Group Inc. and full ownership of carbothermic smelting technology from ORKLA ASA
($8) and a net favorable mark-to-market change in certain energy derivative contracts ($5).
|
 37
[Alcoa logo]
Reconciliation of Adjusted Income, continued
(in millions)
Quarter ended
December 31,
2008
March 31,
2009
June 30,
2009
September 30,
2009
December 31,
2009
March 31,
2010
June 30,
2010
September 30,
2010
December 31,
2010
Net (loss) income
attributable to Alcoa
$ (1,191)
$ (497)
$ (454)
$ 77
$ (277)
$ (201)
$ 136
$ 61
$ 258
(Loss) income from
discontinued
operations
(262)
(17)
(142)
4
(11)
(7)
(1)
–
–
(Loss) income from
continuing
operations
attributable to Alcoa
(929)
(480)
(312)
73
(266)
(194)
137
61
258
Restructuring and
other charges
614
46
56
1
49
119
20
(1)
(8)
Discrete tax items*
65
(28)
–
–
(82)
112
(16)
(38)
(18)
Other special items**
29
(15)
–
(35)
308
64
(2)
74
(9)
(Loss) income from
continuing
operations
attributable to Alcoa
–
as adjusted
$ (221)
$ (477)
$ (256
)
$ 39
$ 9
$ 101
$ 139
$ 96
$ 223
Income (loss) from continuing operations attributable to Alcoa – as adjusted is a non-GAAP
financial measure. Management believes that this measure is meaningful to investors because management reviews the operating results of Alcoa excluding the impacts of
restructuring and other charges, discrete tax items, and other special items (collectively,
“special items”). There can be no assurances that additional special items will not occur in future periods. To compensate for this limitation, management believes that it is
appropriate to consider both Income (loss) from continuing operations attributable to Alcoa determined
under GAAP as well as Income (loss) from continuing operations attributable to Alcoa – as adjusted.
* Discrete tax items include the following:
• for the quarter ended December 31, 2010, a benefit for the reversal of the remaining valuation
allowance related to net operating losses of an international subsidiary ($16) (a portion was initially reversed in the quarter ended September 30, 2010) and a net benefit
for other small items ($2);
• for the quarter ended September 30, 2010, a benefit for the reversal of a valuation allowance
related to net operating losses of an international subsidiary that are now realizable due to a settlement with a tax authority ($41), a charge for a tax rate change in Brazil
($11), and a benefit for the recovery of a portion of the unfavorable impact included in the quarter
ended March 31, 2010 related to unbenefitted losses in Russia, China, and Italy ($8);
• for the quarter ended June 30, 2010, a benefit for a change in a Canadian provincial tax law
permitting tax returns to be filed in U.S. dollars ($24), a charge based on settlement discussions of several matters with international taxing authorities ($18), and a benefit
for the recovery of a portion of the unfavorable impact included in the quarter ended March 31, 2010
related to unbenefitted losses in Russia, China, and Italy ($10); • for the quarter
ended March 31, 2010, charges for a change in the tax treatment of federal subsidies received related to prescription drug benefits provided under certain retiree health benefit plans ($79), unbenefitted losses in Russia, China, and Italy ($22),
interest due to the IRS related to a previously deferred gain associated with the 2007 formation
of the former soft alloy extrusions joint venture ($6), and a change in the anticipated sale structure of the Transportation Products Europe business ($5);
• for the quarter ended December 31, 2009, a benefit for the reorganization of an equity
investment in Canada ($71), a charge for the write-off of deferred tax assets related to operations in Italy ($41), a benefit for a tax rate change in Iceland ($31), and a benefit for
the reversal of a valuation allowance on net operating losses in Norway ($21);
• for the quarter ended March 31, 2009, a benefit for a change in a Canadian national tax law
permitting tax returns to be filed in U.S. dollars; and, • for the quarter
ended December 31, 2008, a charge for non-cash tax on repatriated earnings. ** Other special items include the following:
• for the quarter ended December 31, 2010, a net favorable mark-to-market change in
certain energy derivative contracts; • for the quarter ended September 30, 2010, a
net unfavorable mark-to-market change in certain energy derivative contracts ($29), recovery costs associated with the São Luís, Brazil facility due to a power outage and failure of a ship unloader in the first half of 2010
($23), restart costs and lost volumes related to a June 2010 flood at the Avilés smelter in Spain
($13), and a net charge comprised of expenses for the early repayment of Notes set to mature in 2011 through 2013 due to the premiums paid under the tender offers
and call option and gains from the termination of related “in-the-money” interest
rate swaps ($9); • for the quarter ended June 30, 2010, a net favorable
mark-to-market change in certain energy derivative contracts ($22), a charge for costs associated with the potential strike and successful execution of a new agreement with the United Steelworkers ($13), and a
charge related to an unfavorable decision in Alcoa’s lawsuit against Luminant related to the
Rockdale, TX facility ($7); • for the quarter ended March 31, 2010, charges related
to unfavorable mark-to-market changes in certain energy derivative contracts ($31), power outages at the Rockdale, TX and São Luís, Brazil facilities ($17), an additional environmental accrual for the Grasse
River remediation in Massena, NY ($11), and the write off of inventory related to the permanent
closures of certain U.S. facilities ($5); • for the quarter ended December 31, 2009,
charges related to the European Commission’s ruling on electricity pricing for smelters in Italy ($250), a tax settlement related to an equity investment in Brazil ($24), an estimated loss on excess power at the Intalco
smelter ($19), and an environmental accrual for smelters in Italy ($15);
• for the quarter ended September 30, 2009, a gain on an acquisition in Suriname;
• for the quarter ended March 31, 2009, a gain on the Elkem/SAPA AB swap ($133) and a loss on the
sale of Shining Prospect ($118); and, • for the quarter ended December 31, 2008,
charges for environmental reserve ($26), obsolete inventory ($16), and accounts receivable reserve ($11), and a refund of an indemnification payment ($24). |
 38
[Alcoa logo]
Reconciliation of Alcoa Adjusted EBITDA
($ in millions)
2002
2003
2004
2005
2006
2007
2008
2009
20
10
2011
3Q11
2Q12
3Q12
Net income (loss)
attributable to
Alcoa
$ 420
$ 938
$ 1,310
$ 1,233
$ 2,248
$ 2,564
$ (74)
$ (1,151)
$ 254
$ 611
$ 172
$ (2)
$ (143)
Add:
Net income
(loss)
attributable to
noncontrolling
interests
181
212
233
259
436
365
221
61
138
194
53
(17)
(32)
Cumulative effect
of accounting
changes
(34)
47
–
2
–
–
–
–
–
–
–
–
–
Loss (income)
from discontinued
operations
101
–
27
50
(22)
250
303
166
8
3
–
–
–
Provision (benefit)
for income taxes
307
367
546
464
853
1,623
342
(574)
148
255
55
13
(33)
Other (income)
expenses
, net
(175)
(278)
(266)
(478)
(236)
(1,920)
(59)
(161)
5
(87)
31
22
(2)
Interest expense
350
314
271
339
384
401
407
470
494
524
125
123
124
Restructuring and
other charges
398
(28)
(29)
266
507
268
939
237
207
281
9
15
2
Provision for
depreciation,
depletion, and
amortization
1,037
1,110
1,142
1,227
1,252
1,244
1,234
1,311
1,450
1,479
376
363
366
Adjusted EBITDA
$ 2,585
$ 2,682
$ 3,234
$ 3,362
$ 5,422
$ 4,795
$ 3,313
$ 359
$ 2,704
$ 3,260
$ 821
$ 517
$ 282
Sales
$17,691
$18,879
$21,370
$24,149
$28,950
$29
,280
$26,901
$18
,439
$21,013
$24,951
$ 6,419
$ 5,963
$ 5,833
Adjusted EBITDA
Margin
15%
14%
15%
14%
19%
16%
12%
2%
13%
13%
13%
9%
5%
Alcoa’s definition of Adjusted EBITDA (Earnings before interest, taxes, depreciation, and
amortization) is net margin plus an add-back for depreciation, depletion, and amortization. Net margin is
equivalent to Sales minus the following items: Cost of goods sold; Selling, general administrative, and
other expenses; Research and development expenses; and Provision for depreciation,
depletion, and amortization. Adjusted EBITDA is a non-GAAP financial measure.
Management believes that this measure is meaningful to investors because Adjusted EBITDA provides
additional information with respect to Alcoa’s operating performance and the Company’s
ability to meet its financial obligations. The Adjusted EBITDA presented may not be comparable to
similarly titled measures of other companies. |
 39
[Alcoa logo]
Reconciliation of Alumina Adjusted EBITDA
($ in millions, except
per metric ton
amounts)
2002
2003
2004
2005
2006
2007
2008
2009
2010
2011
3Q11
2Q12
3Q12
3Q12
YTD
After-tax operating
income (ATOI)
$ 315
$ 415
$ 632
$ 682
$ 1,050
$ 956
$ 727
$ 112
$ 301
$ 607
$ 154
$ 23
$ (9)
$ 49
Add:
Depreciation,
depletion, and
amortization
139
147
153
172
192
267
268
292
406
444
117
114
120
348
Equity (income)
loss
(1)
–
(1)
–
2
(1)
(7)
(8)
(10)
(25)
(2)
(1)
(2)
(4)
Income taxes
130
161
240
246
428
340
277
(22)
60
179
42
(6)
(22)
(29)
Other
(14)
(55)
(46)
(8)
(6)
2
(26)
(92)
(5)
(44)
–
(3)
(1)
(4)
Adjusted EBITDA
$ 569
$ 668
$ 978
$ 1,092
$ 1,666
$ 1,564
$ 1,239
$ 282
$ 752
$ 1,161
$ 311
$ 127
$ 86
$ 360
Production
(thousand metric
tons) (kmt)
13,027
13,841
14,343
14,598
15,128
15,084
15,256
14,265
15,922
16,486
4,140
4,033
4,077
12,263
Adjusted
EBITDA/Production
($ per metric ton)
$ 44
$ 48
$ 68
$ 75
$ 110
$ 104
$ 81
$ 20
$ 47
$ 70
$ 75
$ 31
$ 21
$ 29
Alcoa’s definition of Adjusted EBITDA (Earnings before interest, taxes, depreciation, and
amortization) is net margin plus an add-back for depreciation, depletion, and amortization. Net margin is equivalent to Sales minus the following
items: Cost of goods sold; Selling, general administrative, and other expenses; Research and
development expenses; and Provision for depreciation, depletion, and amortization. The Other line in the table above includes gains/losses on
asset sales and other nonoperating items. Adjusted EBITDA is a non-GAAP financial
measure. Management believes that this measure is meaningful to investors because Adjusted EBITDA provides additional information with respect to
Alcoa’s operating performance and the Company’s ability to meet its financial
obligations. The Adjusted EBITDA presented may not be comparable to similarly titled measures of other companies.
|
 40
[Alcoa logo]
Reconciliation of Primary Metals Adjusted EBITDA
($ in millions, except
per metric ton
amounts)
2002
2003
2004
2005
2006
2007
2008
2009
2010
2011
3Q11
2Q
12
3Q12
3Q12
YTD
After-tax operating
income (ATOI)
$ 650
$ 657
$ 808
$ 822
$ 1,760
$ 1,445
$ 931
$ (612)
$ 488
$ 481
$ 110
$ (3)
$ (14)
$ (7)
Add:
Depreciation,
depletion, and
amortization
300
310
326
368
395
410
503
560
571
556
137
133
130
398
Equity (income) loss
(44)
(55)
(58)
12
(82)
(57)
(2)
26
(1)
7
4
9
5
16
Income taxes
266
256
314
307
726
542
172
(365)
96
92
21
(19)
(19)
(51)
Other
(47)
12
20
(96)
(13)
(27)
(32)
(176)
(7)
2
–
(1)
2
1
Adjusted
EBITDA
$ 1,125
$ 1,180
$ 1,410
$ 1,413
$ 2,786
$ 2,313
$ 1,572
$ (567)
$ 1,147
$ 1,138
$ 272
$
119
$
104
$
357
Production
(thousand metric
tons) (kmt)
3,500
3,508
3,376
3,554
3,552
3,693
4,007
3,564
3,586
3,775
964
941
938
2,830
Adjusted
EBITDA/Production
($ per metric ton)
$ 321
$ 336
$ 418
$ 398
$ 784
$ 626
$ 392
$ (159)
$ 320
$ 301
$ 282
$ 126
$ 111
$ 126
Alcoa’s definition of Adjusted EBITDA (Earnings before interest, taxes, depreciation, and
amortization) is net margin plus an add-back for depreciation, depletion, and amortization. Net margin is equivalent to
Sales minus the following items: Cost of goods sold; Selling, general administrative, and other
expenses; Research and development expenses; and Provision for depreciation, depletion, and amortization.
The Other line in the table above includes gains/losses on asset sales and other nonoperating
items. Adjusted EBITDA is a non-GAAP financial measure. Management believes that this measure is
meaningful to investors because Adjusted EBITDA provides additional information with respect to
Alcoa’s operating performance and the Company’s ability to meet its financial obligations. The Adjusted
EBITDA presented may not be comparable to similarly titled measures of other companies.
|
 41
[Alcoa logo]
Reconciliation of Global Rolled Products Adjusted EBITDA
($ in millions, except
per metric ton
amounts)
2002
2003
2004
2005
2006
2007
2008
2009
2010
2011
3Q11
2Q12
3Q12
3Q11
YTD
3Q12
YTD
After-tax operating
income (ATOI)
$ 225
$ 222
$ 254
$ 278
$ 233
$ 178
$ (3)
$ (49)
$ 220
$ 266
$ 60
$ 95
$ 98
$ 240
$ 289
Add:
Depreciation,
depletion, and
amortization
184
190
200
220
223
227
216
227
238
237
61
57
57
179
171
Equity loss
4
1
1
–
2
–
–
–
–
3
–
2
1
–
4
Income taxes
90
71
75
121
58
92
35
48
92
104
26
43
44
94
136
Other
(8)
(5)
1
1
20
1
6
(2)
1
1
–
–
(2)
–
(2)
Adjusted EBITDA
$ 495
$ 479
$ 531
$ 620
$ 536
$ 498
$ 254
$ 224
$ 551
$ 611
$ 147
$ 197
$ 198
$ 513
$ 598
Total shipments
(thousand metric
tons) (kmt)
1,814
1,893
2,136
2,250
2,376
2,482
2,361
1,888
1,755
1,866
469
505
501
1,430
1,478
Adjusted
EBITDA/Total
shipments ($ per
metric ton)
$ 273
$ 253
$ 249
$ 276
$ 226
$ 201
$ 108
$ 119
$ 314
$ 327
$ 313
$ 390
$ 395
$ 359
$ 405
Alcoa’s definition of Adjusted EBITDA (Earnings before interest, taxes, depreciation, and
amortization) is net margin plus an add-back for depreciation, depletion, and amortization. Net margin is equivalent to Sales minus the following items:
Cost of goods sold; Selling, general administrative, and other expenses; Research and development
expenses; and Provision for depreciation, depletion, and amortization. The Other line in the table above includes gains/losses on asset sales
and other nonoperating items. Adjusted EBITDA is a non-GAAP financial measure.
Management believes that this measure is meaningful to investors because Adjusted EBITDA provides additional information with respect to Alcoa’s
operating performance and the Company’s ability to meet its financial obligations. The
Adjusted EBITDA presented may not be comparable to similarly titled measures of other companies.
|
 42
[Alcoa logo]
Reconciliation of Engineered Products and Solutions
Adjusted EBITDA
Alcoa’s definition of Adjusted EBITDA (Earnings before interest, taxes, depreciation, and
amortization) is net margin plus an add-back for depreciation, depletion, and amortization. Net margin is equivalent to Sales minus
the following items: Cost of goods sold; Selling, general administrative, and other expenses; Research
and development expenses; and Provision for depreciation, depletion, and amortization. The Other line in the table
above includes gains/losses on asset sales and other nonoperating items. Adjusted EBITDA is a
non-GAAP financial measure. Management believes that this measure is meaningful to investors because Adjusted EBITDA
provides additional information with respect to Alcoa’s operating performance and the
Company’s ability to meet its financial obligations. The Adjusted EBITDA presented may not be comparable to similarly titled measures
of other companies.
($ in millions)
2002
2003
2004
2005
2006
2007
2008
2009
2010
2011
3Q11
2Q12
3Q12
3Q11
YTD
3Q12
YTD
After-tax operating
income (ATOI)
$ 63
$ 124
$ 156
$ 271
$ 365
$ 435
$ 533
$ 315
$ 415
$ 539
$ 138
$ 160
$ 160
$ 417
$ 475
Add:
Depreciation,
depletion, and
amortization
150
166
168
160
152
163
165
177
154
158
40
39
39
119
118
Equity loss
(income)
–
–
–
–
6
–
–
(2)
(2)
(1)
–
–
–
1
–
Income taxes
39
55
65
116
155
192
222
139
195
260
67
77
79
201
228
Other
35
11
106
(11)
(2)
(7)
2
1
–
(1)
–
–
(1)
(3)
(1)
Adjusted EBITDA
$ 287
$ 356
$ 495
$ 536
$ 676
$ 783
$ 922
$ 630
$ 762
$ 955
$ 245
$ 276
$ 277
$ 735
$ 820
Total sales
$ 3,492
$ 3,905
$ 4,283
$ 4,773
$ 5,428
$ 5,834
$ 6,199
$ 4,689
$ 4,584
$ 5,345
$ 1,373
$ 1,420
$ 1,367
$ 3,990
$ 4,177
Adjusted EBITDA
Margin
8%
9%
12%
11%
12%
13%
15%
13%
17%
18%
18%
19%
20%
18%
20% |
 43
[Alcoa logo]
Reconciliation of Free Cash Flow
(in millions)
Quarter ended
March 31,
2011
June 30,
2011
September 30,
2011
December 31,
2011
March 31,
2012
June 30,
2012
September
30,
2012
Cash from
operations
$ (236)
$ 798
$ 489
$ 1,142
$ (236)
$ 537
$ 263
Capital
expenditures
(204)
(272)
(325)
(486)
(270)
(291)
(302)
Free cash
flow
$ 164
$ 656
$ (506)
6
$ (39)
Free Cash Flow is a non-GAAP financial measure. Management believes that this measure is
meaningful to investors because management reviews cash flows generated from operations after
taking into consideration capital expenditures due to the fact that these expenditures are considered
necessary to maintain and expand Alcoa’s asset base and are expected to generate future cash
flows from operations. It is important to note that Free Cash Flow does not represent the
residual cash flow available for discretionary expenditures since other non-discretionary expenditures, such as
mandatory debt service requirements, are not deducted from the measure.
$ (440)
$ 526
$ 24 |
 44
[Alcoa logo]
Reconciliation of Free Cash Flow, continued
(in millions)
Quarter ended
December 31,
2008
March 31,
2009
June 30,
2009
September 30,
2009
December 31,
2009
March 31,
2010
June 30,
2010
September 30,
2010
December 31,
2010
Cash from
operations
$ 608
$ (271)
$
328
$ 184
$ 1,124
$ 199
$ 300
$ 392
$ 1,370
Capital
expenditures
(1,017)
(471)
(418)
(370)
(363)
(221)
(213)
(216)
(365)
Free cash
flow
$ (409)
$ (742)
$
(90)
$ (186)
$ 761
$ (22)
$ 87
$ 176
$ 1,005
Free Cash Flow is a non-GAAP financial measure. Management believes that this measure is
meaningful to investors because management reviews cash flows generated from operations after taking into
consideration capital expenditures due to the fact that these expenditures are considered necessary to
maintain and expand Alcoa’s asset base and are expected to generate future cash flows from operations. It
is important to note that Free Cash Flow does not represent the residual cash flow available for
discretionary expenditures since other non-discretionary expenditures, such as mandatory debt service requirements,
are not deducted from the measure.
|
 45
[Alcoa logo]
Days Working Capital
($ in millions)
Quarter ended
September
30,
2011
June 30,
2012
September
30,
2012
Receivables from customers, less allowances
$ 1,943
$ 1,575
$ 1,619
Add: Deferred purchase price receivable *
–
141
81
Receivables from customers, less allowances, as adjusted
1,943
1,716
1,700
Add: Inventories
3,194
3,051
2,973
Less: Accounts payable, trade
2,488
2,633
2,590
Working Capital
$ 2,649
$ 2,134
$ 2,083
Sales
$ 6,419
$ 5,963
$ 5,833
Days Working
Capital
38
33
33
Days Working Capital = Working Capital divided by (Sales/number of days in the
quarter). * The deferred purchase price receivable relates to an arrangement to sell certain
customer receivables to a financial institution on a recurring basis. Alcoa is adding
back this receivable for the purposes of the Days Working Capital calculation. |
 46
[Alcoa logo]
Reconciliation of Net Debt-to-Capital
($ in millions)
Quarter ended September 30, 2012
Debt-to-Capital
Cash and Cash
Equivalents
Net Debt-to-
Capital
Total Debt
Short-term borrowings
$ 591
Commercial paper
43
Long-term debt due within
one year
540
Long-term debt, less amount
due within one year
8,350
Numerator
$ 9,524
$ 1,432
$ 8,092
Total Capital
Total debt
$ 9,524
Total equity
16,854
Denominator
$ 26,378
$ 1,432
$ 24,946
Ratio
36.1%
32.4%
Net debt-to-capital is a non-GAAP financial measure. Management believes that this
measure is meaningful to investors because management assesses Alcoa’s leverage position
after factoring in available cash that could be used to repay outstanding debt.
|