Attached files
| file | filename |
|---|---|
| 8-K - FORM 8-K - NTELOS HOLDINGS CORP. | d423633d8k.htm |
| EX-99.1 - EXHIBIT 99.1 - NTELOS HOLDINGS CORP. | d423633dex991.htm |
 NASDAQ: NTLS
Company Overview
NASDAQ: NTLS
EXHIBIT 99.2 |
 Presentation of Financial and Other Important Information
2
NASDAQ: NTLS
USE OF NON-GAAP FINANCIAL MEASURES
Included in this presentation are certain non-GAAP financial measures that are not determined in
accordance with US generally accepted accounting principles (“GAAP”). These financial
performance measures are not indicative of cash provided or used by operating activities and exclude the effects of certain operating,
capital and financing costs and may differ from comparable information provided by other companies,
and they should not be considered in isolation, as an alternative to, or more meaningful than
measures of financial performance determined in accordance with US generally accepted accounting principles. These
financial performance measures are commonly used in the industry and are presented because NTELOS
believes they provide relevant and useful information to investors. NTELOS utilizes these
financial performance measures to assess its ability to meet future capital expenditure and working capital requirements, to incur
indebtedness if necessary, and to fund continued growth. NTELOS also uses these financial
performance measures to evaluate the performance of its business, for budget planning purposes
and as factors in its employee compensation programs. Adjusted EBITDA is defined as net income attributable to NTELOS Holdings
Corp. before interest, income taxes, depreciation and amortization, accretion of asset retirement
obligations, gain/loss on derivatives, net income attributable to non-controlling
interests, other expenses/income, equity based compensation charges, acquisition related charges, net loss from discontinued operations and
costs related to the separation of the wireless and wireline companies. Please review the
reconciliations and other definitions of non-GAAP financial measures contained in the press
releases filed by the Company with the SEC, including those filed on Form 8-K on February 29, 2012, April 30, 2012 and August 1, 2012.
SPECIAL NOTE REGARDING FORWARD-LOOKING STATEMENTS
Any statements contained in this presentation that are not statements of historical fact, including
statements about our beliefs and expectations, are forward- looking statements and should be
evaluated as such. The words “anticipates,” “believes,” “expects,” “intends,” “plans,” “estimates,” “targets,” “projects,” “should,”
“may,” “will” and similar words and expressions are intended to identify
forward-looking statements. Such forward-looking statements reflect, among other things,
our current expectations, plans and strategies, and anticipated financial results, all of which are
subject to known and unknown risks, uncertainties and factors that may cause our actual results
to differ materially from those expressed or implied by these forward-looking statements. Many of these risks are beyond our ability to
control or predict. Because of these risks, uncertainties and assumptions, you should not place undue
reliance on these forward-looking statements. Furthermore, forward-looking statements
speak only as of the date they are made. We do not undertake any obligation to update or review any forward-looking information,
whether as a result of new information, future events or otherwise. Important factors with
respect to any such forward-looking statements, including certain risks and uncertainties
that could cause actual results to differ from those contained in the forward-looking statements, include, but are not limited to: our ability to
attract and retain retail subscribers to our services; our dependence on our strategic relationship
and the potential outcome of any disputes with Sprint Nextel (“Sprint”); a potential
increase in roaming rates and wireless handset subsidy costs; rapid development and intense competition in the telecommunications
industry; our ability to finance, design, construct and realize the benefits of any planned network
technology upgrade; the potential to experience a high rate of customer turnover; the potential
for Sprint and others to build networks in our markets; cash and capital requirements; operating and financial restrictions imposed
by our senior credit facility; adverse economic conditions; federal and state regulatory fees,
requirements and developments; loss of ability to use our current cell sites; our ability to
realize the benefits anticipated following the spinoff of our wireline business; our continued reliance on indirect channels of retail distribution; our
reliance on certain suppliers and vendors; and other unforeseen difficulties that may occur. These
risks and uncertainties are not intended to represent a complete list of all risks and
uncertainties inherent in our business, and should be read in conjunction with the more detailed cautionary statements and risk factors included
in our SEC filings, including our most recent Annual Report filed on Form 10-K.
|
 NASDAQ:
NTLS 3
Leading
regional
provider
of
wireless
communications
services
in
the
mid-Atlantic
region,
serving Virginia, West Virginia and parts of Kentucky, North Carolina, Ohio,
Pennsylvania and Maryland
NTELOS-branded retail postpay and prepay subscribers as well as robust
wholesale business Key operating strategies
Elevate brand & best value in wireless position to improve quality of
subscriber base and grow market share
Enhance customer experience at all touch points by focusing on core
differentiators of savings,
simplicity
and
service
to
improve
customer
satisfaction
and
reduce
subscriber
churn
Drive Smartphone and data services penetration to increase ARPU
Leverage disciplined network investments to expand wholesale revenues and
margin Manage cost structure to improve profitability
Exclusive CDMA Network provider for Sprint in WV and Western VA
NTELOS spun off its wireline operations to Lumos Networks (NASDAQ: LMOS) on October
31, 2011, becoming a pure-play wireless operator
Company Overview (NASDAQ: NTLS) |
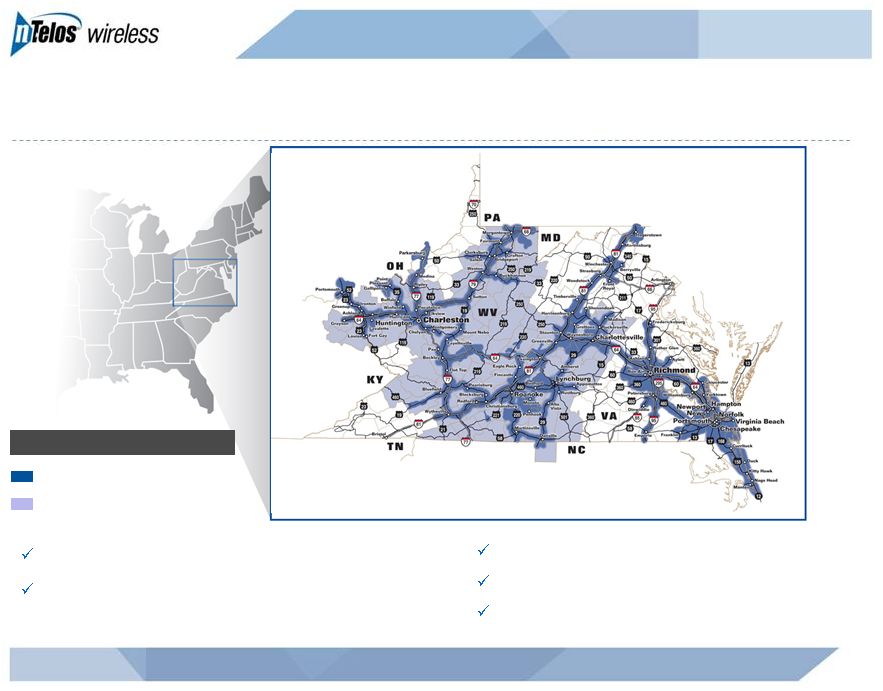 Regionally Focused Wireless Service Provider
NASDAQ: NTLS
4
LTM
9/30/2012
revenue
of
$443M
(1)
LTM
9/30/12
adjusted
EBITDA
of
$136M
(1)
Diverse spectrum portfolio
6.0 million covered POPs
430K retail subscribers as of 9/30/12
Ntelos Covered Network
Sprint Wholesale Markets
STRATEGIC NETWORK ASSETS
(1)
Denotes preliminary numbers |
 Attractive Spectrum Portfolio
5
NASDAQ: NTLS
Average Spectrum Depth in Key Markets
Band
Commentary
PCS
Average depth of 23 MHz
Scarce strategic asset
AWS
Significant spectrum
holdings in top operating
markets of western Virginia
Currently undeployed
MHZ
3,643
2,661
1,775
1,025
Licensed POPs
(000’s)
302
194
211
213
200
273
Source: Map Info: Custom Data, Total Population – Current Year and Five Year USA by Block
Group: United States, SO215245 |
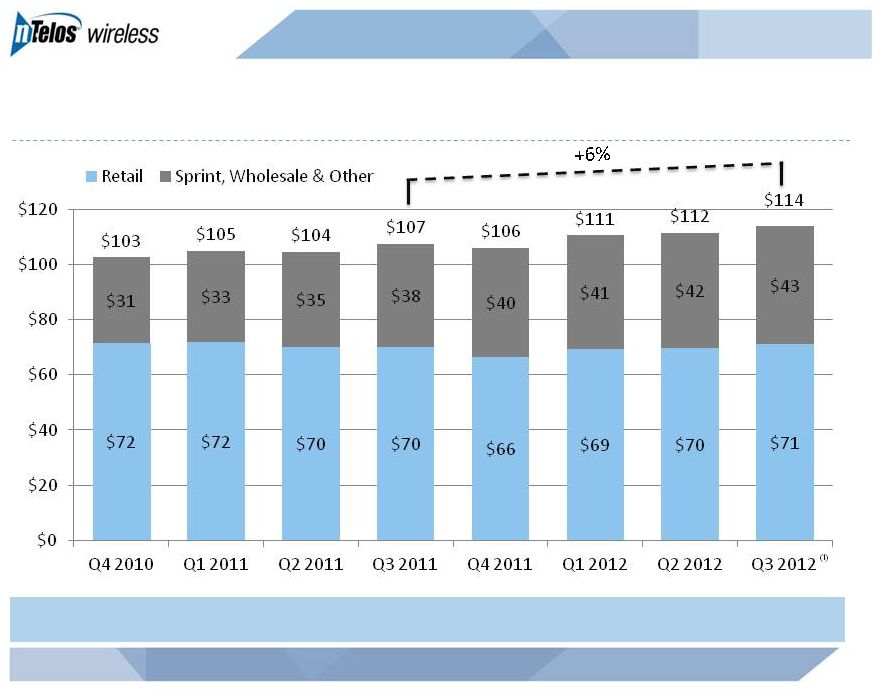 Operating Revenues
6
NASDAQ: NTLS
millions
Year-over-Year Revenue Increases
(1)
Denotes preliminary numbers |
 Growth Initiatives
NASDAQ: NTLS
7
NTELOS brand positioned as the best value in wireless: Savings, Simplicity,
Service Gaining subscriber share from competitors
“Brand
Awareness”
and
“Consideration”
scores
have
dramatically
improved
Churn improvement resulting in positive net add trends
Postpay churn decreased 57 bps from 2.56% in Q3 11 to 1.99% in Q3 12
Prepay churn down 178 bps from 6.47% in Q3 11 to 4.69% in Q3 12
Total churn down 81 bps from 3.69% in Q3 11 to 2.88% in Q3 12
Simplification of rate plans and handset pricing to better compete in local
marketplace
Smartphone penetration driving growth and profitability
Postpay Smartphone penetration increased from 28.3% in Q3 11 to 52.7% in Q3
12 Positive impact from iPhone launch in April 2012, followed by iPhone 5
launch in September Retail data ARPU growth of $4.19 from $15.46 in Q2 11 to
$19.65 in Q2 12 Leverage network investments to expand wholesale revenues and
margin beyond Sprint Network Alliance |
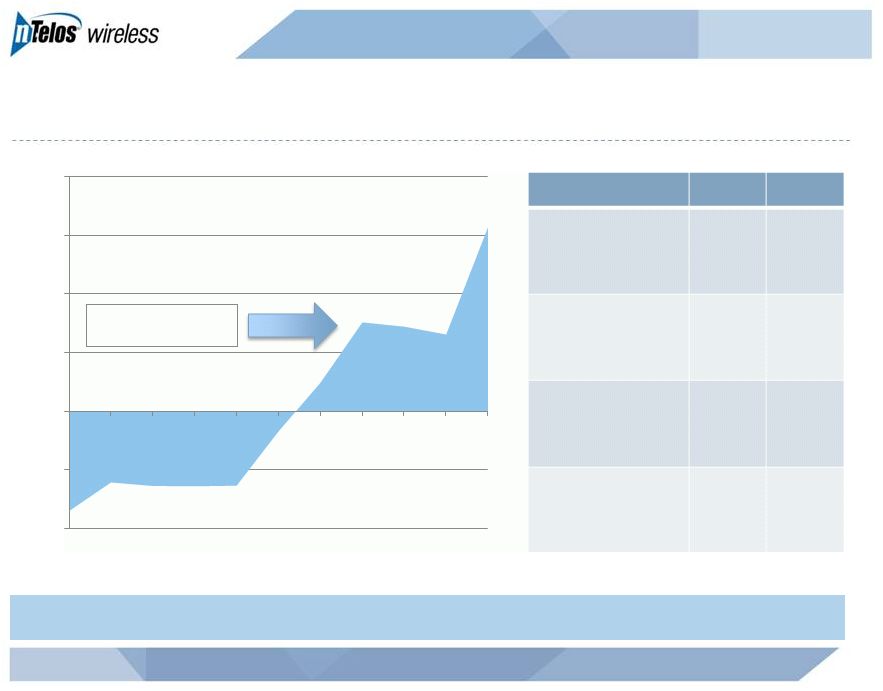 NTELOS Branding Resonating With Consumers
8
NASDAQ: NTLS
NTELOS Gaining Market Share
Positive net ports
vs. all other carriers
(1)
Denotes preliminary numbers
(1)
Source: Independent third-party research studies.
(4,000)
(2,000)
0
2,000
4,000
6,000
8,000
Q1
2010
Q2
2010
Q3
2010
Q4
2010
Q1
2011
Q2
2011
Q3
2011
Q4
2011
Q1
2012
Q2
2012
Q3
2012
Postpay Number Porting, Net Ports
3Q11
3Q12
Net Promoter
Score
33%
46%
Unaided
Awareness
24%
32%
Unaided Recall
16%
28%
Purchase
Consideration
12%
21% |
 Managing Postpaid Churn to Enhance Profitability
9
NASDAQ: NTLS
Churn Improvements Driving Greater Retail Profitability
1.0%
1.5%
2.0%
2.5%
3.0%
Q1 2011
Q2 2011
Q3 2011
Q4 2011
Q1 2012
Q2 2012
Q3 2012
Postpaid Churn
Predictive churn analytics driving
improved results
Brand positioning yielding better
credit quality customers
“CRM”
driving retention costs
down through more targeted
loyalty programs
“Best Value in Wireless”
rate
plans resonating with customers |
 Prepaid Churn
Simplified, tax-inclusive rate
plans at competitive prices
Expanded device line-up driving
better credit quality subscribers
Increased smartphone
penetration results in customer
“stickiness”
Lower churn in prepay base
improves ARPU and customer
profitability
Consistently Improving Prepaid Churn Metrics
10
NASDAQ: NTLS
Churn Improvements Driving Greater Retail Profitability
2%
4%
6%
8%
10%
Q1 2011
Q2 2011
Q3 2011
Q4 2011
Q1 2012
Q2 2012
Q3 2012 |
 Subscribers and ARPU –
Return to Growth
11
NASDAQ: NTLS
Q1
Q2
Q3
Q4
Q1
Q2
2011
2011
2011
2011
2012
2012
Postpay net additions comparison
Prepay net additions comparison
(8,000)
(4,000)
0
4,000
8,000
Q1
Q2
Q3
Q4
2011
2012
$0
$10
$20
$30
$40
$50
$60
Prepay Data ARPU
Prepay Voice ARPU
Postpay Data ARPU
Postpay Voice ARPU
(8,000)
(4,000)
0
4,000
8,000
12,000
16,000
Q1
Q2
Q3
Q4
2011
2012 |
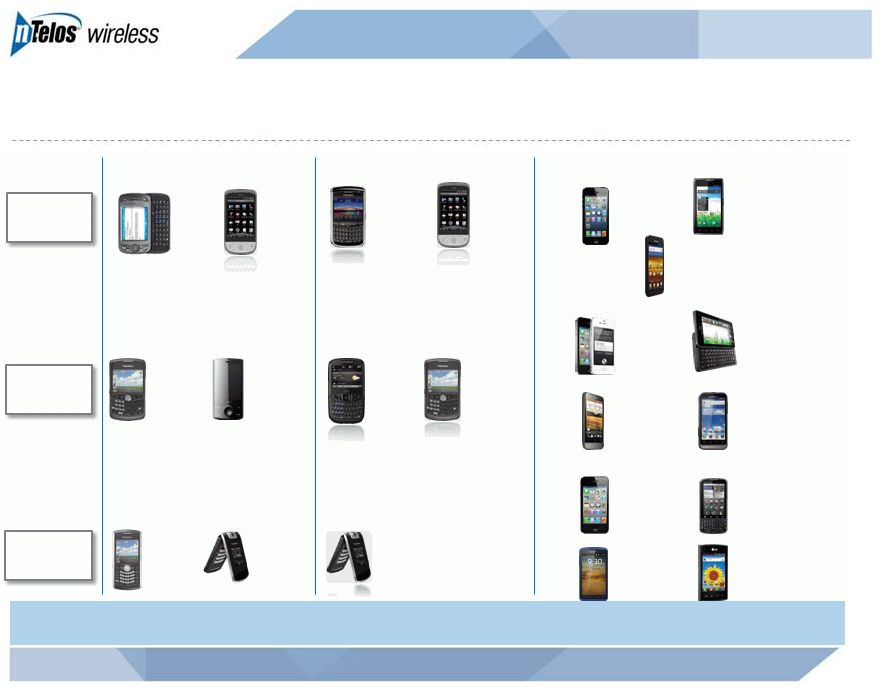 Closing the Device Gap on Competition
12
NASDAQ: NTLS
Best
Q4 2009
Q4 2010
Q4 2012
Better
Good
LG Optimus
Plus
Motorola
Defy XT
Alcatel One
Touch Ultra
Motorola
Milestone 3
HTC One V
Samsung Galaxy S II
Motorola
RAZR MAXX
Motorola
Milestone PLUS
iPhone 4
iPhone 4S
iPhone 5
BlackBerry
Curve 8330
BlackBerry
Pearl Flip
8230
HTC Hero
Android
BlackBerry
Pearl
8130
HTC 6800
HTC Touch
Diamond
BlackBerry
Curve 8330
BlackBerry
Pearl Flip
8230
HTC Snap
HTC Hero
Android
BlackBerry
Tour 9630
Evolution of Handsets to More Data-Centric Devices |
 iPhone Data –
Q2 2012 Snapshot (Launch Date April 20, 2012)
NASDAQ: NTLS
13
9,500 iPhones sold
26% of gross adds
56% of postpaid adds
54% of iPhones sold to new subscribers
6% penetration in postpaid subscriber base as of June 30, 2012
30% of iPhone upgrades paid early upgrade fee |
 Network Evolution
NASDAQ: NTLS
14
6.0mm covered POPs; 8.1mm licensed POPs
90% of covered POPs are served with 3G EV-DO
Rev. A
Primarily Alcatel Lucent equipment
1,396 cell sites deployed
Market level spectrum holdings ranging from 10
MHz to 50 MHz
PCS average depth of 23 MHz
AWS average depth of 20 MHz
Additional spectrum includes
Small amount of WCS, BRS and LMDS
Opportunities for additional spectrum and
spectrum sharing being evaluated
Upgrade history
1xRTT launched in 2002
EV-DO Rev A launched in 2008
LTE Drivers
Serve the needs of our retail subscribers
Maintain competitive position in
marketplace
Optimize long-term network operating cost
with new technology
Serve the needs of our largest wholesale
customer, Sprint
Deployment Plan
Launch first LTE markets in 2H 2013
Complete initial build-out by year-end 2014;
70% of covered POPs
Devices supporting Band Classes 2, 4 and
25
Estimated CapEx of approximately $60mm
to $65mm
Current network
4G LTE upgrade plans |
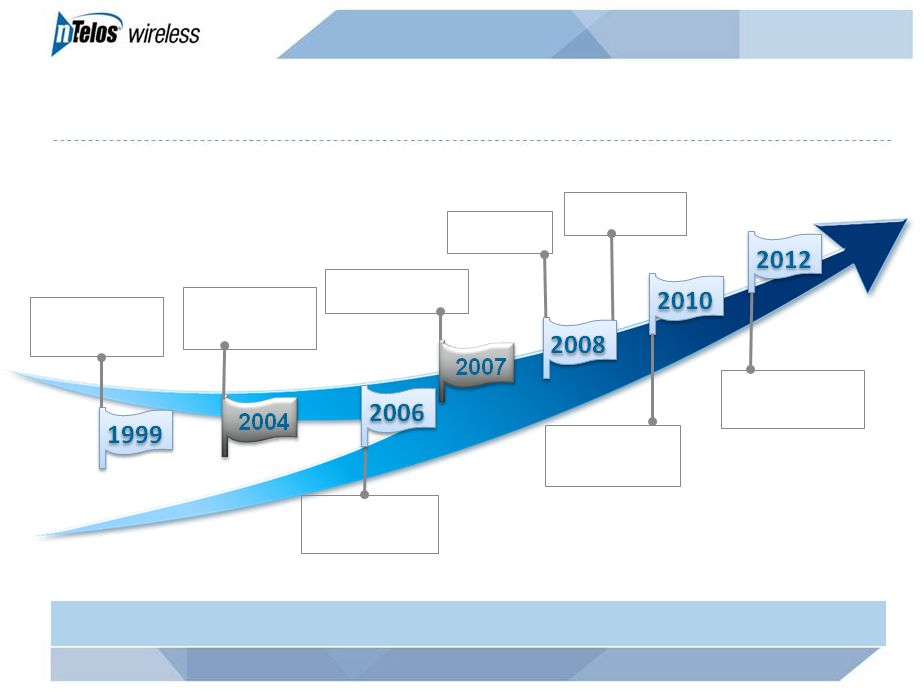 Sprint Strategic Network Alliance Evolution
15
NASDAQ: NTLS
NTELOS is a Key Partner to Sprint
8/1999:
Agreement
with Horizon PCS
(Sprint affiliate)
8/2004:
Horizon
bankruptcy; Sprint
agreement signed
10/2006:
Sprint
launches EV-DO
Rev A in San Diego
10/2010:
Sprint
announces
Network Vision
9/2012:
Sprint has
19 metropolitan areas
with 4G LTE
8/2007:
Amends
agreement with Sprint
3/2008:
Launch
of EV-DO
11/2008:
Completes
EV-DO build |
 Sprint Strategic Network Alliance Service
16
NASDAQ: NTLS
Exclusively provides 3G services to large number of Sprint home and travel
subscribers
Encompasses approximately:
2.0mm covered POPs in WV and Western VA
823 cell sites
36,800 square miles
Provides ~$40mm in quarterly revenues
Sprint relationship update
Continuing dialogue
Rate dispute previously outlined remains outstanding; estimated range
now ($8.0mm) to $8.0mm
Q3 $4.2mm dispute, isolated to historical billing issues only
|
 Sprint Strategic Network Alliance Leverages NTELOS’s Network
17
NASDAQ: NTLS
Strategic
Network
Alliance
revenues
(1)
Attractive Revenue Stream
(1)
Excludes roaming
(2)
Denotes preliminary numbers
Sprint Nextel Strategic Network Alliance
through at least July 2015
$9 million monthly minimum revenue
guarantee
Attractive contribution to margin
Growing Usage
Significant growth in data usage
since EV-DO launched
Voice continues to grow
Calculated revenues exceeded
the $9 million monthly minimum in
all quarters of 2011 and 2012 YTD
millions
(2)
$21
$22
$23
$23
$24
$24
$25
$10
$11
$13
$15
$16
$17
$17
$0
$5
$10
$15
$20
$25
Total Voice
Total Data
Q1 2011
Q2 2011
Q3 2011
Q4 2011
Q1 2012
Q2 2012
Q3 2012 |
 Strategic Network Alliance with Sprint
18
NASDAQ: NTLS
EV-DO amended agreement signed in August 2007
EV-DO network upgrade was catalyst for new agreement
Covers portions of WV and Western Virginia territories
Exclusive provider of wholesale CDMA network services
Separate rate structures for data and voice for home and roamer subscribers
Agreement through July 2015, with renewal options
Sprint
prohibited
from
beginning
“over-build”
until
January
1,
2014
(18
months prior) |
 Financial Overview
NASDAQ: NTLS |
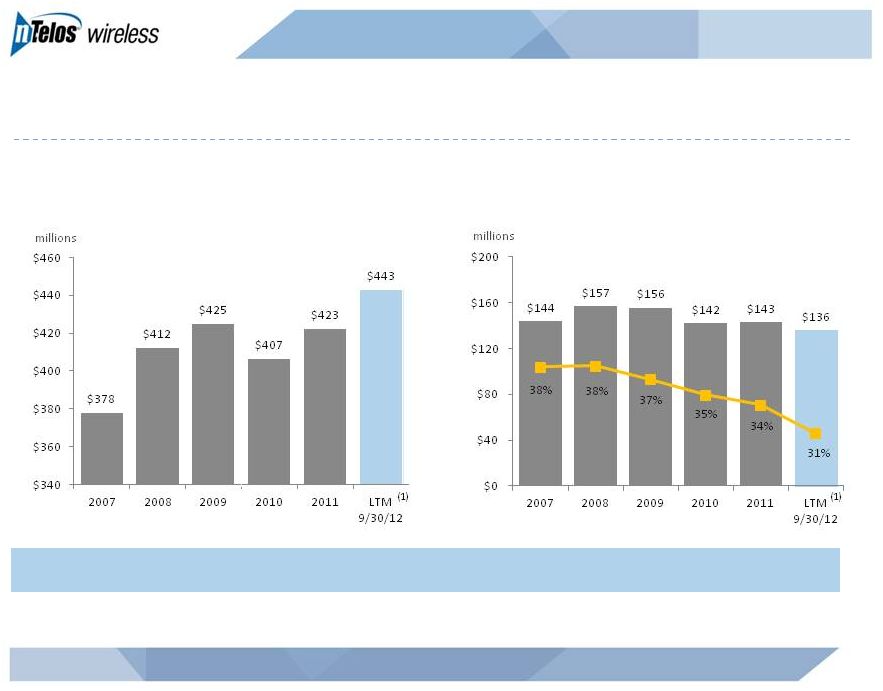 Strong Historical Financial Performance
20
NASDAQ: NTLS
Total Revenue
Total Adjusted EBITDA/Margin %
Driving Positive Results
Note: Historical operating results throughout this presentation exclude NTELOS’s former
wireline results which were spun off to Lumos Networks on 10/31/11 (1)
Denotes preliminary results |
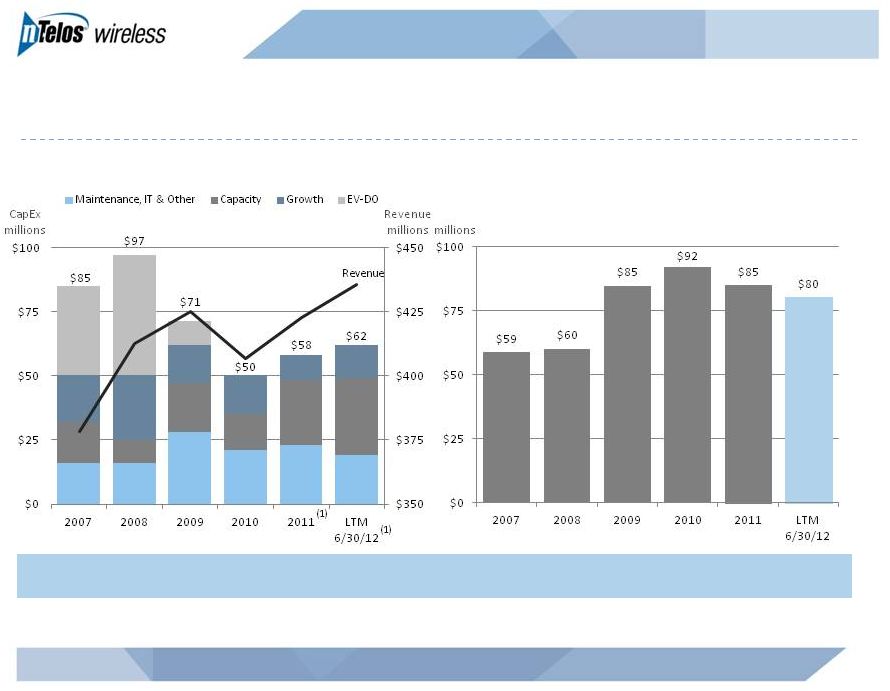 Managing Free Cash Flow with Disciplined Capital Investment
21
NASDAQ: NTLS
CapEx
EBITDA less CapEx
Note: Excludes wireline capex incurred prior to business separation
(1)
Includes $5mm of capex related to business separation
Network Upgrade to EV-DO Still Driving Revenue Growth |
 Summary
22
NASDAQ: NTLS
Competitive and diversified business model
Strategic asset set
Numerous catalysts for sustainable topline and adjusted EBITDA growth
High-margin wholesale revenue
Increased smartphone penetration
Improved distribution
Operational improvements
Focus on profitability and free cash flow growth
Experienced management team |
 Appendix
NASDAQ: NTLS |
 Adjusted EBITDA Reconciliation
24
NASDAQ: NTLS
Consolidated
2007
2008
2009
2010
2011
LTM 6/30/12
Net income Attributable to NTELOS Holdings Corp.
32,453
$
44,829
$
63,285
$
44,808
$
(23,715)
$
(33,814)
$
Net income attributable to noncontrolling interests
-
-
(851)
(1,417)
(1,769)
(1,600)
Net Income
32,453
$
44,829
$
64,136
$
46,225
$
(21,946)
$
(31,876)
$
Discontinued operations, net
12,638
16,002
18,054
16,882
(45,386)
(57,999)
Income from continuing operations
19,815
$
28,827
$
46,082
$
29,343
$
23,440
$
26,123
$
Interest expense
24,520
17,024
15,922
24,728
23,380
21,832
Loss (gain) on interest rate derivatives
3,527
9,531
(2,100)
147
264
18
Income taxes
17,161
20,787
26,526
20,251
16,363
17,030
Other expense (income), net
2,953
1,402
971
413
2,807
1,285
Operating income
67,976
$
77,571
$
87,401
$
74,882
$
66,254
$
66,288
$
Depreciation and amortization
70,102
75,982
63,015
58,016
63,083
63,695
Accretion of asset retirement obligations
746
914
695
770
658
631
Equity-based compensation
4,328
2,729
3,227
5,270
6,072
6,041
Acquisition related charges
570
-
1,477
2,815
-
-
Business separation charges
-
-
-
352
6,988
5,895
Adjusted EBITDA
143,721
$
157,196
$
155,815
$
142,105
$
143,054
$
142,549
$
(1)
Charges for legal and consulting services in connection with the separation of the
Company’s wireless and wireline operations
(1) |
 ARPU Reconciliation
25
NASDAQ: NTLS
Average Monthly Revenue per User (ARPU) ¹
2009
2010
2011
2012
2011
(In thousands, except for subscribers and ARPU)
Operating Revenues
425,057
$
406,793
$
422,629
$
222,125
$
209,229
$
Less: Equipment revenue from sales to new customers
(6,379)
(8,233)
(9,091)
(7,900)
(3,930)
Less: Equipment revenue from
sales to existing customers (18,453)
(14,893)
(17,793)
(8,306)
(9,292)
Less: Wholesale, other and
adjustments (119,219)
(116,575)
(143,477)
(81,897)
(66,436)
Gross subscriber revenue
281,006
267,092
252,268
$
124,022
129,571
Less: prepay subscriber revenue
(67,974)
(58,918)
(48,758)
(27,404)
(25,224)
Less: adjustments to prepay
subscriber revenue (483)
(276)
(1,175)
(1,035)
(636)
Gross
postpay subscriber revenue 212,549
$
207,898
$
202,335
$
95,583
$
103,711
$
Prepay subscriber revenue
67,974
58,918
48,758
27,404
25,224
Plus: adjustments to prepay
subscriber revenue 483
276
1,175
1,035
636
Gross prepay subscriber revenue
68,457
$
59,194
$
49,933
$
28,439
$
25,860
$
Average number of subscribers
440,207
437,735
422,256
419,721
428,624
Total ARPU
53.20
$
50.85
$
49.79
$
49.25
$
50.38
$
Average number of postpay
subscribers 310,852
303,986
298,992
286,940
302,403
Postpay ARPU
56.98
$
56.99
$
56.39
$
55.52
$
57.16
$
Average number of prepay
subscribers 129,356
133,750
123,264
132,781
126,222
Prepay ARPU
44.10
$
36.88
$
33.76
$
35.70
$
34.15
$
Gross subscriber revenue
281,006
267,092
252,268
124,022
129,571
Less: voice and other feature revenue
(232,271)
(203,657)
(171,882)
(75,287)
(91,015)
Data revenue
48,735
$
63,435
$
80,386
$
48,735
$
38,556
$
Average number of subscribers
440,207
437,735
422,256
419,721
428,624
Total Data ARPU
9.23
$
12.08
$
15.86
$
19.35
$
14.99
$
Gross postpay subscriber
revenue 212,549
207,898
202,335
95,583
103,711
Less: postpay voice and other feature
revenue (175,031)
(158,890)
(144,114)
(62,922)
(74,862)
Postpay data revenue
37,518
$
49,008
$
58,221
$
32,661
$
28,849
$
Gross prepay subscriber revenue
67,974
$
59,195
$
49,933
$
28,439
25,860
Less: prepay voice and other
feature revenue 56,756
(44,768)
(27,767)
(12,365)
(16,153)
Prepay data revenue
11,218
$
14,427
$
22,166
$
16,074
$
9,707
$
Average number of postpay
subscribers 310,852
303,986
298,992
286,940
302,403
Postpay data ARPU
10.06
$
13.43
$
16.23
$
18.97
$
15.90
$
Average number of prepay
subscribers 129,356
133,750
123,264
132,781
126,222
Prepay data ARPU
7.23
$
8.99
$
14.99
$
20.18
$
12.82
$
6 Months Ended June 30,
Year Ended December 31, |