Attached files
| file | filename |
|---|---|
| 8-K - 8-K - ATLANTIC POWER CORP | a12-23690_18k.htm |
Exhibit 99.1
|
|
Deutsche Bank’s 20th Annual Leveraged Finance Conference October 11, 2012 |
|
|
Cautionary Note Regarding Forward-looking Statements 2 To the extent any statements made in presentation contain information that is not historical, these statements are forward-looking statements or forward-looking information, as applicable, within the meaning of Section 27A of the U.S. Securities Act of 1933, as amended, and Section 21E of the U.S. Securities Exchange Act of 1934, as amended and under Canadian securities law (collectively “forward-looking statements”). These forward-looking statements relate to, among other things: Atlantic Power Corporation’s (“AT”, “Atlantic Power” or the “Company”) expectations regarding the outcome of recontracting discussions related to certain projects; expectations regarding project cash flows; expectations regarding the completion of construction at the Piedmont and Canadian Hills project and expected date for commercial operation thereof; expectations regarding growth, acquisitions and leverage related to such acquisitions; expectations regarding the availability of tax equity investments; and outlook on growth at Atlantic Power. Forward-looking statements can generally be identified by the use of words such as “should,” “intend,” “may,” “expect,” “believe,” “anticipate,” “estimate,” “continue,” “plan,” “project,” “will,” “could,” “would,” “target,” “potential” and other similar expressions. In addition, any statements that refer to expectations, projections or other characterizations of future events or circumstances are forward-looking statements. Although AT believes that the expectations reflected in such forward-looking statements are reasonable, such statements involve risks and uncertainties, should not be read as guarantees of future performance or results, and undue reliance should not be placed on such statements. Certain material factors or assumptions are applied in making forward-looking statements, including, but not limited to, third party projections of regional fuel and electric capacity and energy prices or cash flows that are based on assumptions about future economic conditions and courses of action as well as factors and assumptions set out below. Actual results may differ materially from those expressed or implied in such statements. Important factors that could cause actual results to differ materially from these expectations include, among other things: (i) the availability to AT of investment and acquisition opportunities; (ii) Atlantic Power’s access to capital and the state of the capital markets; (iii) the amount of distributions expected to be received from the company’s projects; (iv) the amount of dividends expected to be paid by AT in 2012; (v) construction risk for AT’s Canadian Hills project; (vi) availability of financing to complete the construction of AT’s Canadian Hills project; and (vii) the other risk factors relating to the Company and the power industry, as detailed from time to time in the Company’s filings with the SEC and Canadian securities regulators. Additional information about these factors and about the material factors or assumptions underlying such forward-looking statements may be found in the Company’s Form 10-K for the year ended December 31, 2011, as amended, under the section entitled “Risk Factors” and in the Company’s Form 10-Q for the quarters ended March 31, 2012 and June 30, 2012. These forward-looking statements are made as of the date of this communication and, except as expressly required by applicable law, AT assumes no obligation to update or revise them to reflect new events or circumstances. Disclaimer – Unaudited Pro Forma Financial Information All amounts in this presentation are in US$ unless otherwise stated. There are non-GAAP measures used in this communication, including Project Adjusted EBITDA and EBITDA. Atlantic Power believes that such non-GAAP measures are appropriate measures of the operating performance of Atlantic Power. Atlantic Power’s calculation of these measures may differ from the methodology used by other issuers and, accordingly, may not be comparable to other issuers. Project Adjusted EBITDA is defined as project income plus interest, taxes, depreciation and amortization (including non-cash impairment charges) and changes in fair value of derivative instruments. Project Adjusted EBITDA is not a measure recognized under GAAP and is therefore unlikely to be comparable to similar measures presented by other issuers and does not have a standardized meaning prescribed by GAAP. Management uses Project Adjusted EBITDA at the Project-level to provide comparative information about project performance. A reconciliation of Project Adjusted EBITDA to project income is provided on slide 26. Investors are cautioned that the Company may calculate this measure in a manner that is different from other issuers. Disclaimer – Non-GAAP Measures Atlantic Power completed its acquisition of Capital Power Income L.P. (renamed Atlantic Power Limited Partnership on February 1, 2012, the “Partnership”) on November 5, 2011. For the purposes of this presentation, 2011 Project Adjusted EBITDA is presented on an unaudited pro forma basis assuming the acquisition was effected on January 1, 2011 and that Atlantic Power received a full year of Project Adjusted EBITDA from the 18 Partnership projects. The unaudited pro forma information has been presented for informational purposes only and is not necessarily indicative of what the combined company’s results of operations and financial position would have been for the period presented. The pro forma information does not purport to project the future results of operations or financial position of the combined company and our results of operations may differ significantly from the unaudited pro forma information provided in this presentation. |
|
|
OVERVIEW Atlantic Power 3 |
|
|
Investment Overview 4 A Unique Power Infrastructure Company with an attractive yield Diversified fleet of 30 power generation projects totaling 2,117 MW of generating capacity in operation in 11 states and 2 provinces in North America An additional 352 MW under construction in Oklahoma and Georgia, commercial operations in Q4 2012 84 mile, 500 kilovolt transmission line in California Cash flows are largely contracted, producing stable cash flows to sustain a current monthly dividend (Cdn$1.15/share/year); current yield of approximately 7.8% Target accretive growth through proprietary / partnership development opportunities Current market capitalization of approximately $1.8 Bn and Enterprise Value of $3.6 Bn Excellent access to capital in public markets in the United States and Canada Listed on both the TSX (TSX:ATP) and NYSE (NYSE:AT) Average daily trading volume over the last 3 months across both exchanges was approx 585k shares Approximately 119.2 million shares outstanding Ownership: 35% Institutional (of which 52% Canada; 44% U.S.; 4% International) Top shareholders include: BlackRock Fund Advisors, TD Asset Management; BMO Asset Management |
|
|
Key Drivers of AT’s Business Model 5 Atlantic Power relies on its competitive strengths to pursue accretive growth opportunities to increase the value of the company while generating stable cash flows from operations to support dividend sustainability Experienced Generator with Stable, Diversified Cash Flows Unlike merchant generators, our power is sold under long-term Power Purchase Agreements (PPAs), which typically allow for variable cost pass-through and provide predictable revenue, margins and cash flows Owner/operator of over half of our fleet Executive team members each have over 25 years of power generation and energy experience Accretive Growth Opportunities Industry reputation and relationships yield proprietary investment opportunities Partner with and invest in experienced development companies to access late-stage development opportunities Track record of successful accretive acquisitions Broad access to public and private capital in Canada and the United States Proactive Risk Management Re-contracting expertise F/X, commodity, and interest rate hedging |
|
|
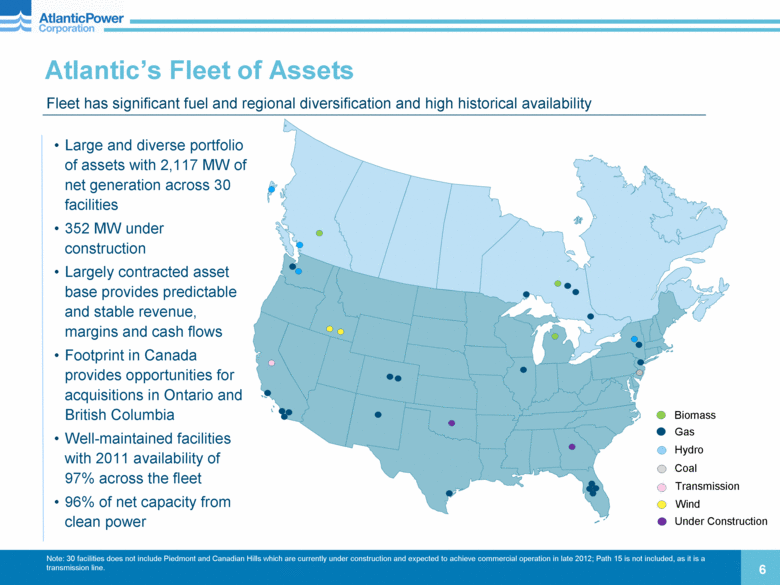
Large and diverse portfolio of assets with 2,117 MW of net generation across 30 facilities 352 MW under construction Largely contracted asset base provides predictable and stable revenue, margins and cash flows Footprint in Canada provides opportunities for acquisitions in Ontario and British Columbia Well-maintained facilities with 2011 availability of 97% across the fleet 96% of net capacity from clean power 6 Note: 30 facilities does not include Piedmont and Canadian Hills which are currently under construction and expected to achieve commercial operation in late 2012; Path 15 is not included, as it is a transmission line. Atlantic’s Fleet of Assets Fleet has significant fuel and regional diversification and high historical availability Biomass Gas Coal Transmission Wind Hydro Under Construction |
|
|
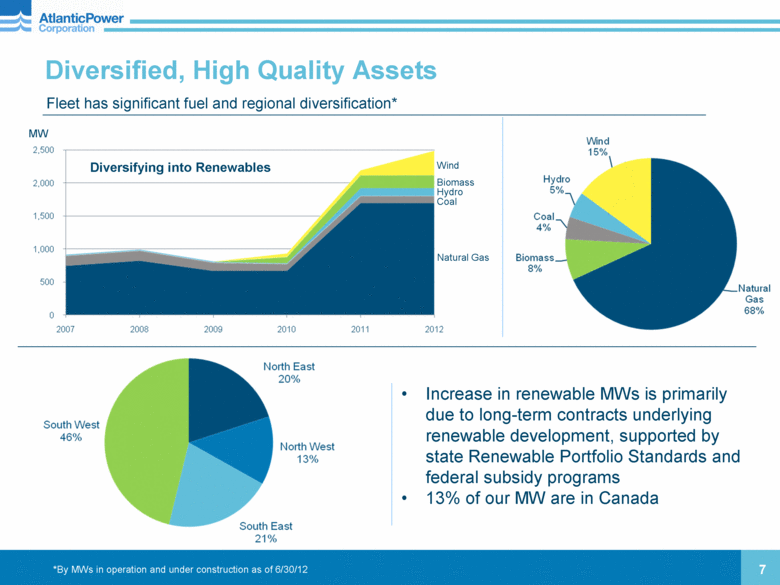
MW Wind 7 Biomass Hydro Coal Natural Gas Diversified, High Quality Assets Fleet has significant fuel and regional diversification* Diversifying into Renewables *By MWs in operation and under construction as of 6/30/12 Increase in renewable MWs is primarily due to long-term contracts underlying renewable development, supported by state Renewable Portfolio Standards and federal subsidy programs 13% of our MW are in Canada |
|
|
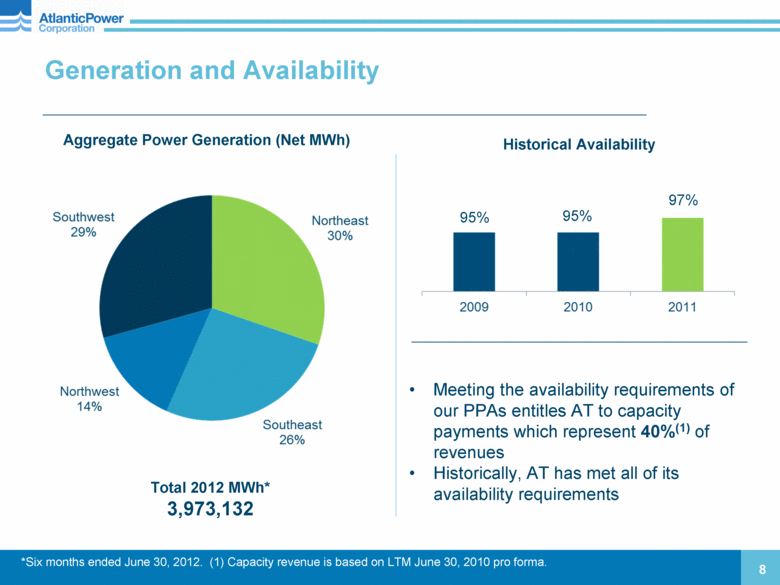
8 Generation and Availability Aggregate Power Generation (Net MWh) Total 2012 MWh* 3,973,132 95% 95% 97% Historical Availability *Six months ended June 30, 2012. (1) Capacity revenue is based on LTM June 30, 2010 pro forma. Meeting the availability requirements of our PPAs entitles AT to capacity payments which represent 40%(1) of revenues Historically, AT has met all of its availability requirements |
|
|
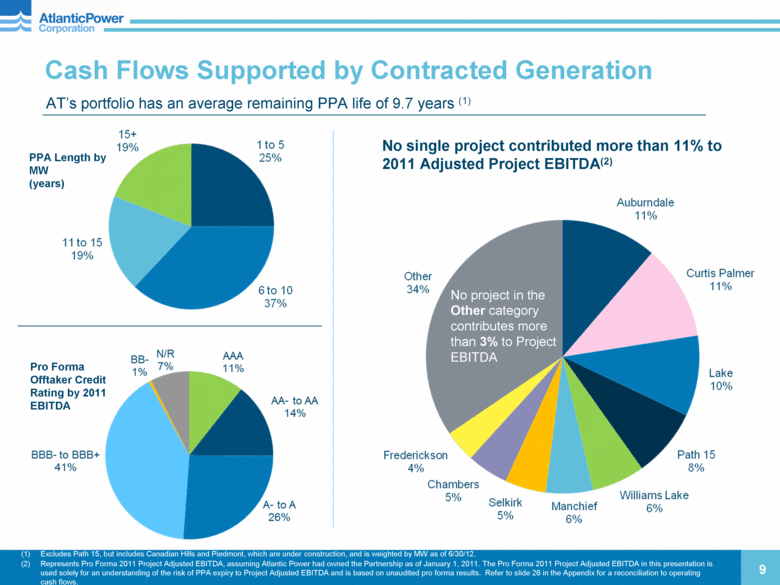
9 Cash Flows Supported by Contracted Generation AT’s portfolio has an average remaining PPA life of 9.7 years (1) Excludes Path 15, but includes Canadian Hills and Piedmont, which are under construction, and is weighted by MW as of 6/30/12. Represents Pro Forma 2011 Project Adjusted EBITDA, assuming Atlantic Power had owned the Partnership as of January 1, 2011. The Pro Forma 2011 Project Adjusted EBITDA in this presentation is used solely for an understanding of the risk of PPA expiry to Project Adjusted EBITDA and is based on unaudited pro forma results. Refer to slide 26 in the Appendix for a reconciliation to operating cash flows. PPA Length by MW (years) Pro Forma Offtaker Credit Rating by 2011 EBITDA No project in the Other category contributes more than 3% to Project EBITDA No single project contributed more than 11% to 2011 Adjusted Project EBITDA(2) |
|
|
OUTLOOK ON GROWTH Atlantic Power 10 |
|
|
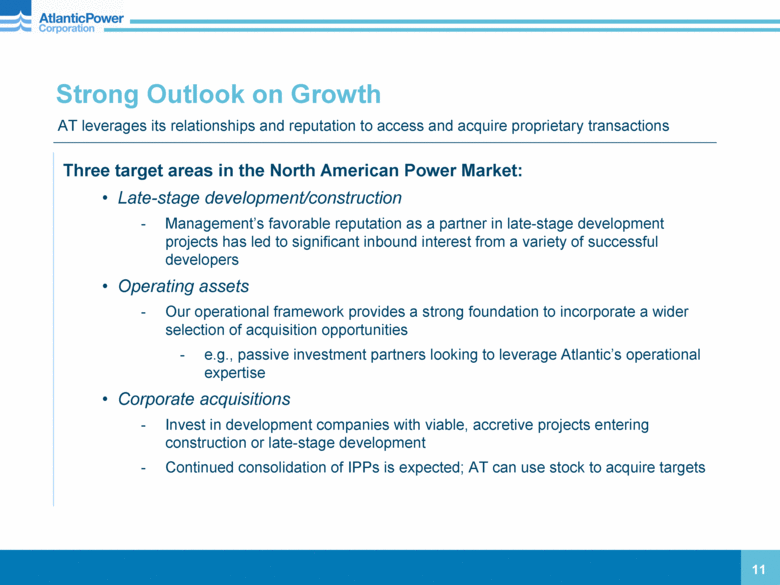
Strong Outlook on Growth 11 Three target areas in the North American Power Market: Late-stage development/construction Management’s favorable reputation as a partner in late-stage development projects has led to significant inbound interest from a variety of successful developers Operating assets Our operational framework provides a strong foundation to incorporate a wider selection of acquisition opportunities e.g., passive investment partners looking to leverage Atlantic’s operational expertise Corporate acquisitions Invest in development companies with viable, accretive projects entering construction or late-stage development Continued consolidation of IPPs is expected; AT can use stock to acquire targets AT leverages its relationships and reputation to access and acquire proprietary transactions |
|
|
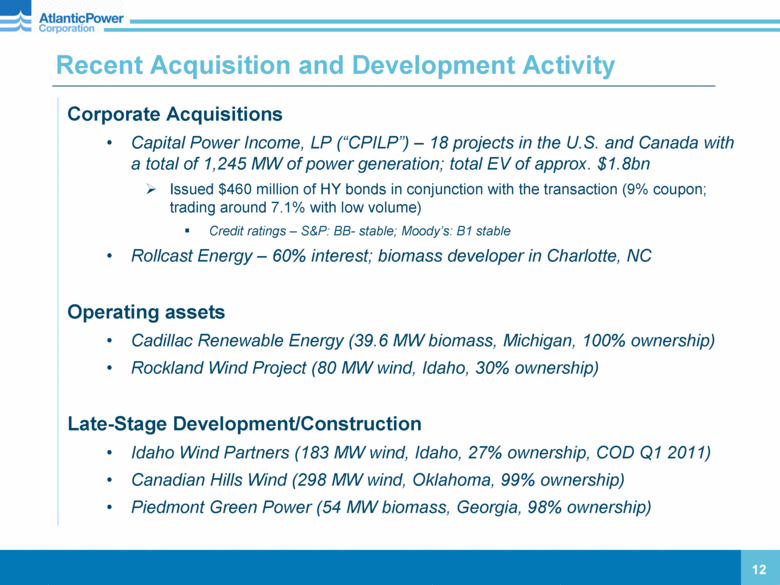
Recent Acquisition and Development Activity 12 Corporate Acquisitions Capital Power Income, LP (“CPILP”) – 18 projects in the U.S. and Canada with a total of 1,245 MW of power generation; total EV of approx. $1.8bn Issued $460 million of HY bonds in conjunction with the transaction (9% coupon; trading around 7.1% with low volume) Credit ratings – S&P: BB- stable; Moody’s: B1 stable Rollcast Energy – 60% interest; biomass developer in Charlotte, NC Operating assets Cadillac Renewable Energy (39.6 MW biomass, Michigan, 100% ownership) Rockland Wind Project (80 MW wind, Idaho, 30% ownership) Late-Stage Development/Construction Idaho Wind Partners (183 MW wind, Idaho, 27% ownership, COD Q1 2011) Canadian Hills Wind (298 MW wind, Oklahoma, 99% ownership) Piedmont Green Power (54 MW biomass, Georgia, 98% ownership) |
|
|
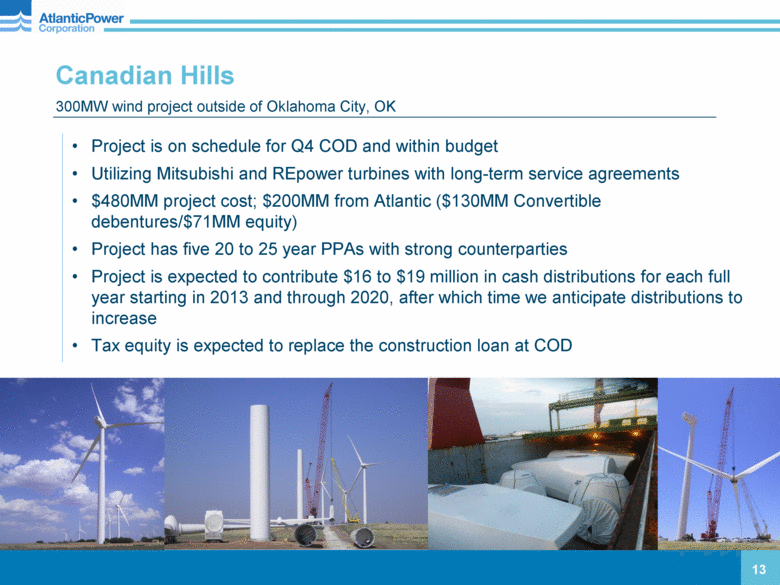
300MW wind project outside of Oklahoma City, OK Canadian Hills 13 Project is on schedule for Q4 COD and within budget Utilizing Mitsubishi and REpower turbines with long-term service agreements $480MM project cost; $200MM from Atlantic ($130MM Convertible debentures/$71MM equity) Project has five 20 to 25 year PPAs with strong counterparties Project is expected to contribute $16 to $19 million in cash distributions for each full year starting in 2013 and through 2020, after which time we anticipate distributions to increase Tax equity is expected to replace the construction loan at COD |
|
|
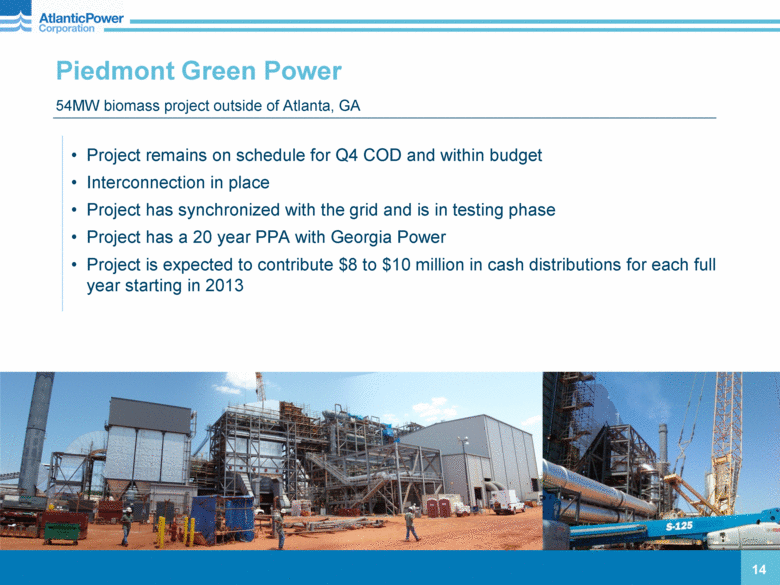
Piedmont Green Power 14 54MW biomass project outside of Atlanta, GA Project remains on schedule for Q4 COD and within budget Interconnection in place Project has synchronized with the grid and is in testing phase Project has a 20 year PPA with Georgia Power Project is expected to contribute $8 to $10 million in cash distributions for each full year starting in 2013 |
|
|
CAPITAL STRUCTURE Atlantic Power 15 |
|
|
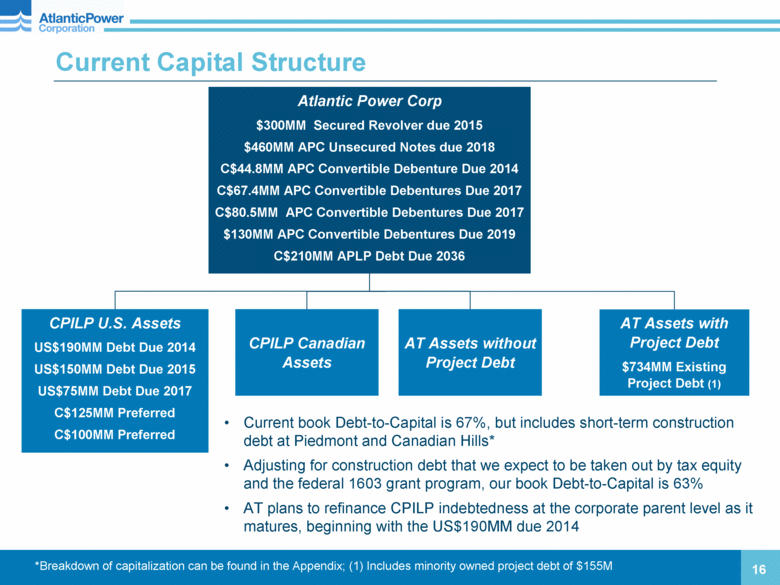
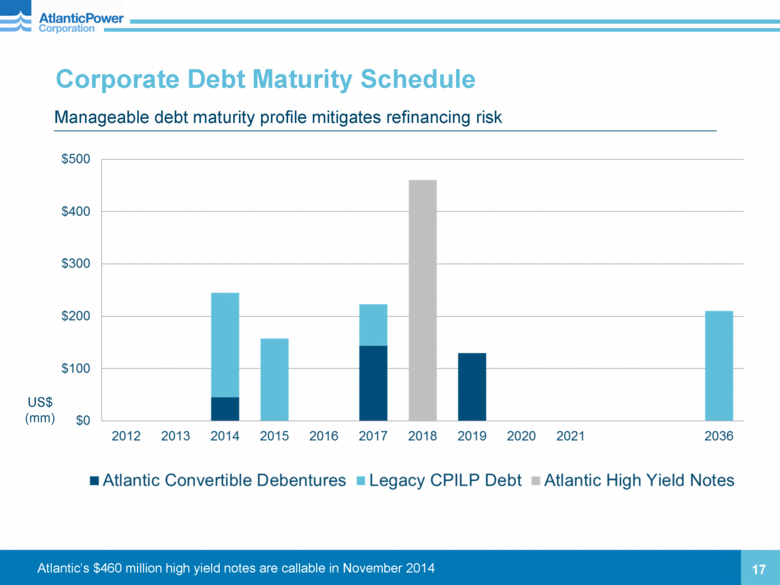
Current Capital Structure 16 Atlantic Power Corp $300MM Secured Revolver due 2015 $460MM APC Unsecured Notes due 2018 C$44.8MM APC Convertible Debenture Due 2014 C$67.4MM APC Convertible Debentures Due 2017 C$80.5MM APC Convertible Debentures Due 2017 $130MM APC Convertible Debentures Due 2019 C$210MM APLP Debt Due 2036 CPILP Canadian Assets CPILP U.S. Assets US$190MM Debt Due 2014 US$150MM Debt Due 2015 US$75MM Debt Due 2017 C$125MM Preferred C$100MM Preferred AT Assets without Project Debt AT Assets with Project Debt $734MM Existing Project Debt (1) *Breakdown of capitalization can be found in the Appendix; (1) Includes minority owned project debt of $155M Current book Debt-to-Capital is 67%, but includes short-term construction debt at Piedmont and Canadian Hills* Adjusting for construction debt that we expect to be taken out by tax equity and the federal 1603 grant program, our book Debt-to-Capital is 63% AT plans to refinance CPILP indebtedness at the corporate parent level as it matures, beginning with the US$190MM due 2014 16 |
|
|
Corporate Debt Maturity Schedule 17 Manageable debt maturity profile mitigates refinancing risk Atlantic’s $460 million high yield notes are callable in November 2014 US$ (mm) |
|
|
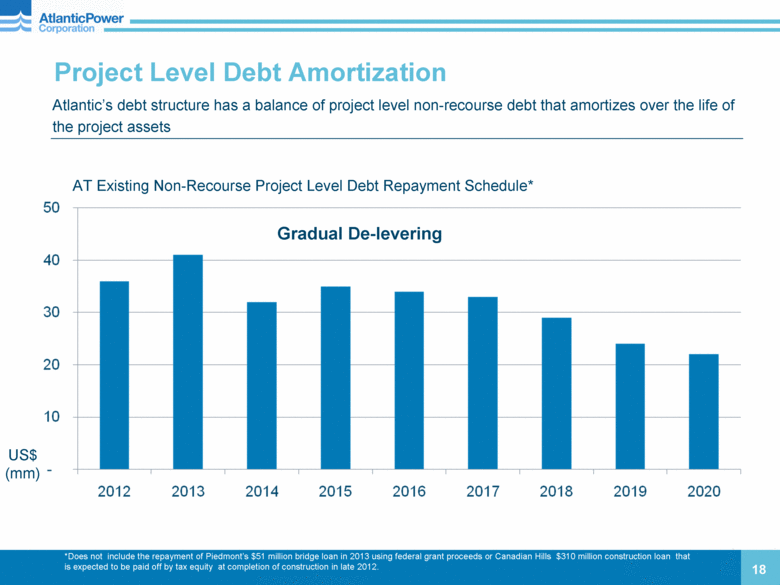
Project Level Debt Amortization 18 AT Existing Non-Recourse Project Level Debt Repayment Schedule* *Does not include the repayment of Piedmont’s $51 million bridge loan in 2013 using federal grant proceeds or Canadian Hills $310 million construction loan that is expected to be paid off by tax equity at completion of construction in late 2012. Gradual De-levering US$ (mm) Atlantic’s debt structure has a balance of project level non-recourse debt that amortizes over the life of the project assets |
|
|
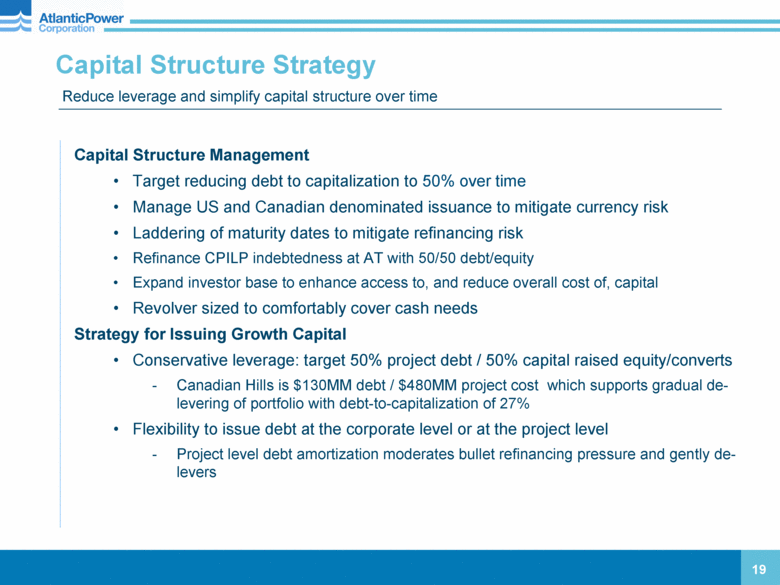
Capital Structure Strategy 19 Capital Structure Management Target reducing debt to capitalization to 50% over time Manage US and Canadian denominated issuance to mitigate currency risk Laddering of maturity dates to mitigate refinancing risk Refinance CPILP indebtedness at AT with 50/50 debt/equity Expand investor base to enhance access to, and reduce overall cost of, capital Revolver sized to comfortably cover cash needs Strategy for Issuing Growth Capital Conservative leverage: target 50% project debt / 50% capital raised equity/converts Canadian Hills is $130MM debt / $480MM project cost which supports gradual de-levering of portfolio with debt-to-capitalization of 27% Flexibility to issue debt at the corporate level or at the project level Project level debt amortization moderates bullet refinancing pressure and gently de-levers Reduce leverage and simplify capital structure over time |
|
|
RISK MANAGEMENT Atlantic Power 20 |
|
|
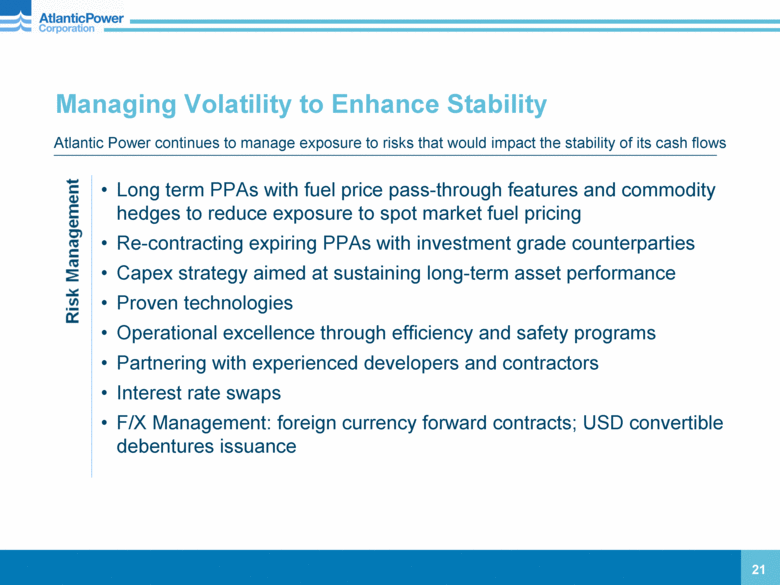
Managing Volatility to Enhance Stability 21 Atlantic Power continues to manage exposure to risks that would impact the stability of its cash flows Long term PPAs with fuel price pass-through features and commodity hedges to reduce exposure to spot market fuel pricing Re-contracting expiring PPAs with investment grade counterparties Capex strategy aimed at sustaining long-term asset performance Proven technologies Operational excellence through efficiency and safety programs Partnering with experienced developers and contractors Interest rate swaps F/X Management: foreign currency forward contracts; USD convertible debentures issuance |
|
|
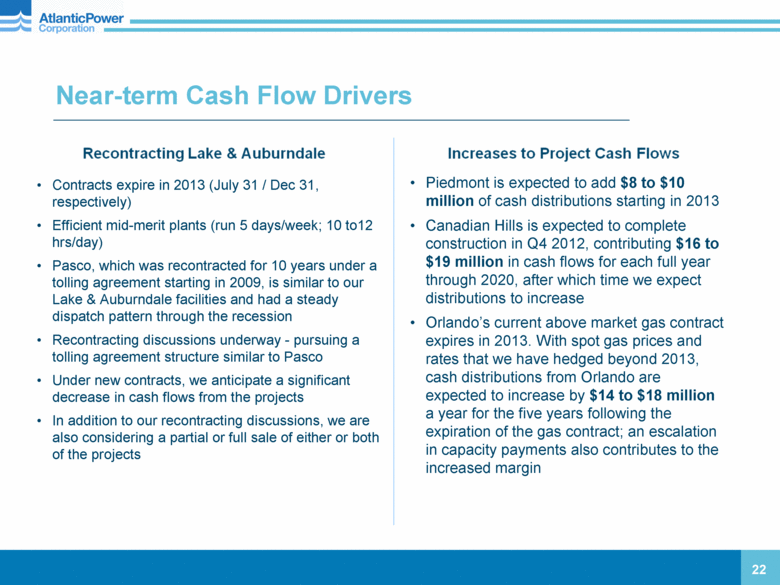
Near-term Cash Flow Drivers 22 Contracts expire in 2013 (July 31 / Dec 31, respectively) Efficient mid-merit plants (run 5 days/week; 10 to12 hrs/day) Pasco, which was recontracted for 10 years under a tolling agreement starting in 2009, is similar to our Lake & Auburndale facilities and had a steady dispatch pattern through the recession Recontracting discussions underway - pursuing a tolling agreement structure similar to Pasco Under new contracts, we anticipate a significant decrease in cash flows from the projects In addition to our recontracting discussions, we are also considering a partial or full sale of either or both of the projects Piedmont is expected to add $8 to $10 million of cash distributions starting in 2013 Canadian Hills is expected to complete construction in Q4 2012, contributing $16 to $19 million in cash flows for each full year through 2020, after which time we expect distributions to increase Orlando’s current above market gas contract expires in 2013. With spot gas prices and rates that we have hedged beyond 2013, cash distributions from Orlando are expected to increase by $14 to $18 million a year for the five years following the expiration of the gas contract; an escalation in capacity payments also contributes to the increased margin |
|
|
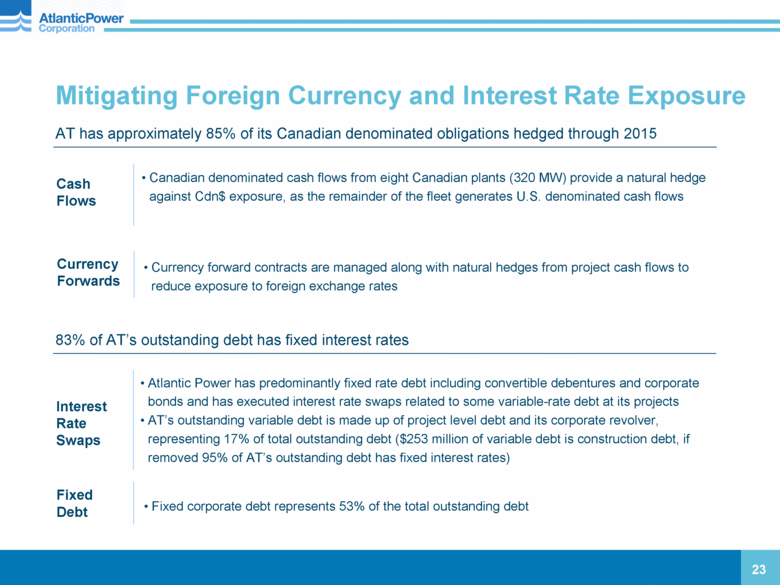
Mitigating Foreign Currency and Interest Rate Exposure 23 Canadian denominated cash flows from eight Canadian plants (320 MW) provide a natural hedge against Cdn$ exposure, as the remainder of the fleet generates U.S. denominated cash flows Currency forward contracts are managed along with natural hedges from project cash flows to reduce exposure to foreign exchange rates Cash Flows Currency Forwards AT has approximately 85% of its Canadian denominated obligations hedged through 2015 Atlantic Power has predominantly fixed rate debt including convertible debentures and corporate bonds and has executed interest rate swaps related to some variable-rate debt at its projects AT’s outstanding variable debt is made up of project level debt and its corporate revolver, representing 17% of total outstanding debt ($253 million of variable debt is construction debt, if removed 95% of AT’s outstanding debt has fixed interest rates) Fixed corporate debt represents 53% of the total outstanding debt Interest Rate Swaps Fixed Debt 83% of AT’s outstanding debt has fixed interest rates |
|
|
Summary of Key Credit Strengths 24 Diversified portfolio Contracted cash flow High credit quality counterparties Environmentally-friendly fuel mix Proactive asset management approach Conservative financial management Disciplined growth strategy |
|
|
Appendix 25 |
|
|
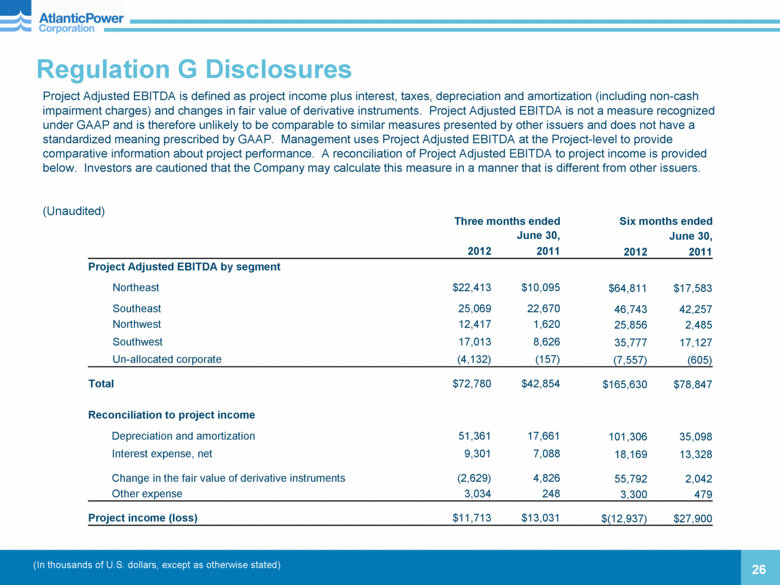
Regulation G Disclosures Project Adjusted EBITDA is defined as project income plus interest, taxes, depreciation and amortization (including non-cash impairment charges) and changes in fair value of derivative instruments. Project Adjusted EBITDA is not a measure recognized under GAAP and is therefore unlikely to be comparable to similar measures presented by other issuers and does not have a standardized meaning prescribed by GAAP. Management uses Project Adjusted EBITDA at the Project-level to provide comparative information about project performance. A reconciliation of Project Adjusted EBITDA to project income is provided below. Investors are cautioned that the Company may calculate this measure in a manner that is different from other issuers. (Unaudited) (In thousands of U.S. dollars, except as otherwise stated) 26 Three months ended June 30, Six months ended June 30, 2012 2011 2012 2011 Project Adjusted EBITDA by segment Northeast $22,413 $10,095 $64,811 $17,583 Southeast 25,069 22,670 46,743 42,257 Northwest 12,417 1,620 25,856 2,485 Southwest 17,013 8,626 35,777 17,127 Un-allocated corporate (4,132) (157) (7,557) (605) Total $72,780 $42,854 $165,630 $78,847 Reconciliation to project income Depreciation and amortization 51,361 17,661 101,306 35,098 Interest expense, net 9,301 7,088 18,169 13,328 Change in the fair value of derivative instruments (2,629) 4,826 55,792 2,042 Other expense 3,034 248 3,300 479 Project income (loss) $11,713 $13,031 $(12,937) $27,900 |
|
|
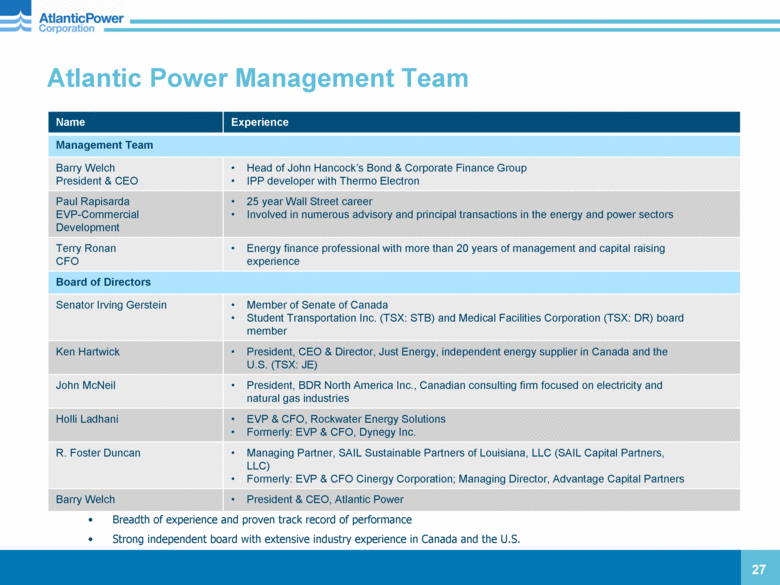
Atlantic Power Management Team 27 Breadth of experience and proven track record of performance Strong independent board with extensive industry experience in Canada and the U.S. Name Experience Management Team Barry Welch President & CEO Head of John Hancock’s Bond & Corporate Finance Group IPP developer with Thermo Electron Paul Rapisarda EVP-Commercial Development 25 year Wall Street career Involved in numerous advisory and principal transactions in the energy and power sectors Terry Ronan CFO Energy finance professional with more than 20 years of management and capital raising experience Board of Directors Senator Irving Gerstein Member of Senate of Canada Student Transportation Inc. (TSX: STB) and Medical Facilities Corporation (TSX: DR) board member Ken Hartwick President, CEO & Director, Just Energy, independent energy supplier in Canada and the U.S. (TSX: JE) John McNeil President, BDR North America Inc., Canadian consulting firm focused on electricity and natural gas industries Holli Ladhani EVP & CFO, Rockwater Energy Solutions Formerly: EVP & CFO, Dynegy Inc. R. Foster Duncan Managing Partner, SAIL Sustainable Partners of Louisiana, LLC (SAIL Capital Partners, LLC) Formerly: EVP & CFO Cinergy Corporation; Managing Director, Advantage Capital Partners Barry Welch President & CEO, Atlantic Power |
|
|
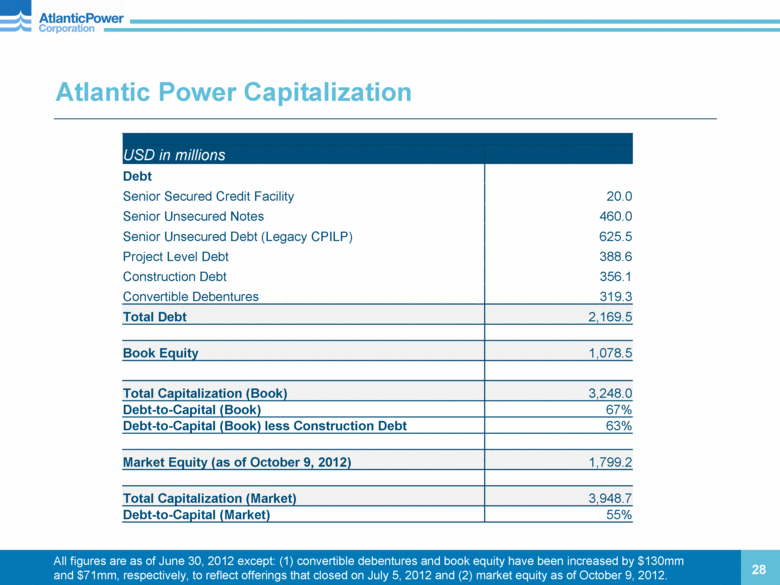
Atlantic Power Capitalization 28 USD in millions Debt Senior Secured Credit Facility 20.0 Senior Unsecured Notes 460.0 Senior Unsecured Debt (Legacy CPILP) 625.5 Project Level Debt 388.6 Construction Debt 356.1 Convertible Debentures 319.3 Total Debt 2,169.5 Book Equity 1,078.5 Total Capitalization (Book) 3,248.0 Debt-to-Capital (Book) 67% Debt-to-Capital (Book) less Construction Debt 63% Market Equity (as of October 9, 2012) 1,799.2 Total Capitalization (Market) 3,948.7 Debt-to-Capital (Market) 55% All figures are as of June 30, 2012 except: (1) convertible debentures and book equity have been increased by $130mm and $71mm, respectively, to reflect offerings that closed on July 5, 2012 and (2) market equity as of October 9, 2012. |
|
|
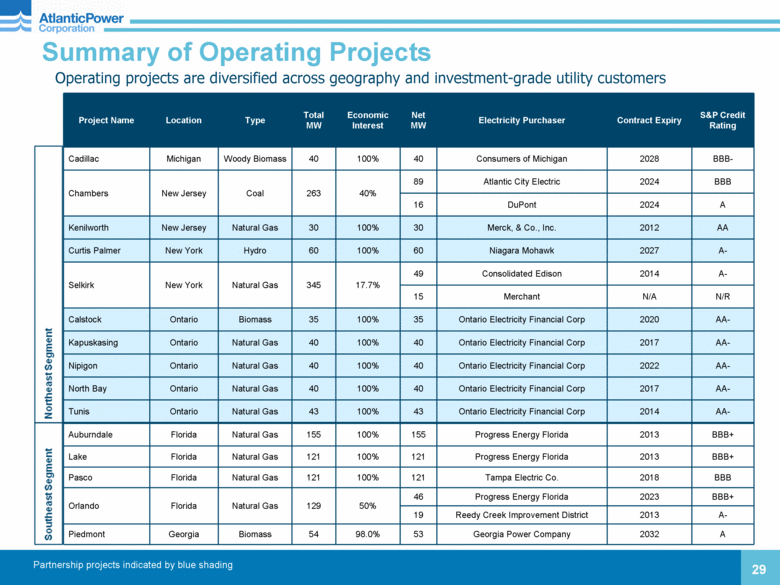
Project Name Location Type Total MW Economic Interest Net MW Electricity Purchaser Contract Expiry S&P Credit Rating Cadillac Michigan Woody Biomass 40 100% 40 Consumers of Michigan 2028 BBB- Chambers New Jersey Coal 263 40% 89 Atlantic City Electric 2024 BBB 16 DuPont 2024 A Kenilworth New Jersey Natural Gas 30 100% 30 Merck, & Co., Inc. 2012 AA Curtis Palmer New York Hydro 60 100% 60 Niagara Mohawk 2027 A- Selkirk New York Natural Gas 345 17.7% 49 Consolidated Edison 2014 A- 15 Merchant N/A N/R Calstock Ontario Biomass 35 100% 35 Ontario Electricity Financial Corp 2020 AA- Kapuskasing Ontario Natural Gas 40 100% 40 Ontario Electricity Financial Corp 2017 AA- Nipigon Ontario Natural Gas 40 100% 40 Ontario Electricity Financial Corp 2022 AA- North Bay Ontario Natural Gas 40 100% 40 Ontario Electricity Financial Corp 2017 AA- Tunis Ontario Natural Gas 43 100% 43 Ontario Electricity Financial Corp 2014 AA- Auburndale Florida Natural Gas 155 100% 155 Progress Energy Florida 2013 BBB+ Lake Florida Natural Gas 121 100% 121 Progress Energy Florida 2013 BBB+ Pasco Florida Natural Gas 121 100% 121 Tampa Electric Co. 2018 BBB Orlando Florida Natural Gas 129 50% 46 Progress Energy Florida 2023 BBB+ 19 Reedy Creek Improvement District 2013 A- Piedmont Georgia Biomass 54 98.0% 53 Georgia Power Company 2032 A Summary of Operating Projects 29 Operating projects are diversified across geography and investment-grade utility customers Partnership projects indicated by blue shading |
|
|
Summary of Operating Projects (continued) 30 Project Name Location Type Total MW Economic Interest Net MW Electricity Purchaser Contract Expiry S&P Credit Rating Mamquam B.C. Hydro 50 100% 50 BC Hydro 2027 AAA Moresby Lake B.C. Hydro 6 100% 6 BC Hydro 2022 AAA Williams Lake B.C. Biomass 66 100% 66 BC Hydro 2018 AAA Idaho Wind Idaho Wind 183 27.6% 50 Idaho Power Company 2030 BBB Rockland Idaho Wind 80 30% 24 Idaho Power Company 2036 BBB Frederickson Washington Natural Gas 250 50% 125 3 Public Utility Districts 2022 A Koma Kulshan Washington Hydro 13 49.8% 7 Puget Sound Energy 2037 BBB Naval Station California Natural Gas 47 100% 47 San Diego Gas & Electric 2019 A Naval Training Center California Natural Gas 25 100% 25 San Diego Gas & Electric 2019 A North Island California Natural Gas 40 100% 40 San Diego Gas & Electric 2019 A Oxnard California Natural Gas 49 100% 49 Southern California Edison 2020 BBB+ Path 15 California Transmission N/A 100% N/A California Utilities via CAISO 2034 BBB+ to A Greeley Colorado Natural Gas 72 100% 72 Public Service Company of Colorado 2013 A- Manchief Colorado Natural Gas 300 100% 300 Public Service Company of Colorado 2022 A- Morris Illinois Natural Gas 177 100% 77 Merchant N/A NR 100 Equistar 2023 B+ Delta-Person New Mexico Natural Gas 132 40% 53 Public Service of New Mexico 2020 BBB- Canadian Hills Oklahoma Wind 298.5 99% 200 Southwestern Electric Power Co. 2032 BBB 49 Oklahoma Municipal Power Authority 2037 N/R 48 Grand River Dam Authority 2032 N/R Gregory Texas Natural Gas 400 17.1% 59 Fortis Energy Marketing and Trading 2013 A- 9 Sherwin Alumina 2020 N/R Partnership projects indicated by blue shading |

