Attached files
| file | filename |
|---|---|
| EX-99.1 - EXHIBIT 99.1 - Spectrum Brands Legacy, Inc. | eh1201089_ex9901.htm |
| 8-K - FORM 8-K - Spectrum Brands Legacy, Inc. | eh1201089_8k-sbhi.htm |
EXHIBIT 99.2
Acquisition of October 9, 2012
Forward - Looking Statements 2 Certain matters discussed in this presentation and other oral and written statements by representatives of the Company regarding the HHI acquisition and matters such as expected sales, adjusted EBITDA, other measures of financial performance, and the financial impact of the HHI acquisition and other acquisitions may be forward - looking statements within the meaning of the Private Securities Litigation Reform Act of 1995. These statements are subject to a number of risks and uncertainties that could cause results to differ materially from those ant icipated as of the date of this release. Actual results may differ materially as a result of (1) Spectrum Brands Holdings' ability to manage and ot herwise comply with its covenants with respect to its significant outstanding indebtedness, including the additional indebtedness that it will in cur in connection with the HHI acquisition (2) the inability to integrate, and to realize synergies from, the combined businesses of Spectrum Brands and it s acquired companies, HHI, FURminator , Russell Hobbs and other acquisitions, (3) risks that changes and developments in external competitive market factors, such as introduction of new product features or technological developments, development of new competitors or compet iti ve brands or competitive promotional activity or spending, (4) changes in consumer demand for the various types of products Spectrum Brand s H oldings offers, (5) unfavorable developments in the global credit markets, (6) the impact of overall economic conditions on consumer spending , ( 7) fluctuations in commodities prices, the costs or availability of raw materials or terms and conditions available from suppliers, (8) changes in the general economic conditions in countries and regions where Spectrum Brands Holdings does business, such as stock market prices, interest rates , c urrency exchange rates, inflation and consumer spending, (9) Spectrum Brands Holdings' ability to successfully implement manufacturin g, distribution and other cost efficiencies and to continue to benefit from its cost - cutting initiatives, (10) Spectrum Brands Holdings' ability to identify, develop and retain key employees, (11) unfavorable weather conditions and various other risks and uncertainties, including those discusse d h erein and those set forth in Spectrum Brands Holdings' and Spectrum Brands' securities filings, including the most recently filed Annual Repo rt on Form 10 - K for Spectrum Brands, Inc. or Quarterly Reports on Form 10 - Q. Spectrum Brands Holdings also cautions the reader that its estimates of trends, market share, retail consumption of its products and reasons for changes in such consumption are based solely on limited data availa ble to Spectrum Brands Holdings and management's reasonable assumptions about market conditions, and consequently may be inaccurate, or may n ot reflect significant segments of the retail market. Spectrum Brands Holdings also cautions the reader that undue reliance should not be placed on any forward - looking statements, wh ich speak only as of the date of this release. Spectrum Brands Holdings undertakes no duty or responsibility to update any of these for war d - looking statements to reflect events or circumstances after the date of this report or to reflect actual outcomes.
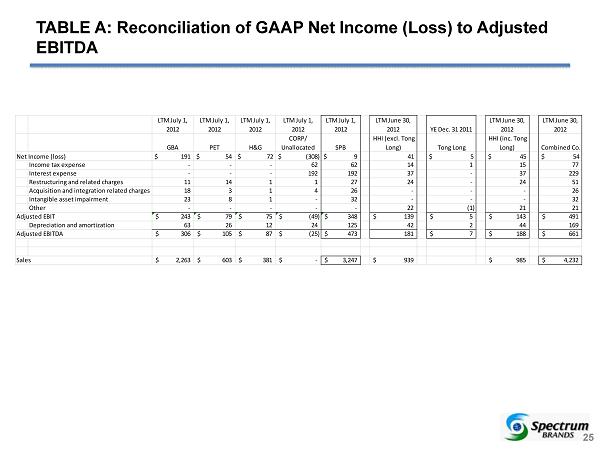
Non - GAAP Measurements 3 Non - GAAP Measurements Management believes that certain non - GAAP financial measures may be useful in certain instances to provide additional meaningful comparison s between current results for the Company, current results for HHI, and current results on a pro - forma basis of the combined opera tions of the Company and HHI. Within this release, including the tables attached hereto, reference is made to adjusted earnings before int ere st, taxes, depreciation and amortization (Adjusted EBITDA). See attached Table A, “Reconciliation of GAAP Net Income (Loss) to Adjusted EBITDA,” for a reconciliation of GAAP Net Income (Loss) to adjusted EBITDA. Adjusted EBITDA is a metric used by management and frequently us ed by the financial community which provides insight into an organization’s operating trends and facilitates comparisons between peer c omp anies, since interest, taxes, depreciation and amortization can differ greatly between organizations as a result of differing capital stru ctu res and tax strategies. Adjusted EBITDA also can be a useful measure of a company’s ability to service debt and is one of the measures used for deter min ing the Company’s debt covenant compliance. Adjusted EBITDA excludes certain items that are unusual in nature or not comparable from per iod to period. The Company provides this information to investors to assist in comparisons of past, present and future operating results and to assist in highlighting the results of on - going operations. While the Company’s management believes that non - GAAP measurements are useful s upplemental information, such adjusted results are not intended to replace the Company’s GAAP financial results and should be read in con jun ction with those GAAP results.
Speakers 4 ▪ Spectrum Brands ▪ David Lumley – Chief Executive Officer ▪ Hardware & Home Improvement Group ▪ Greg Gluchowski – President

Transaction Overview David Lumley DRAFT
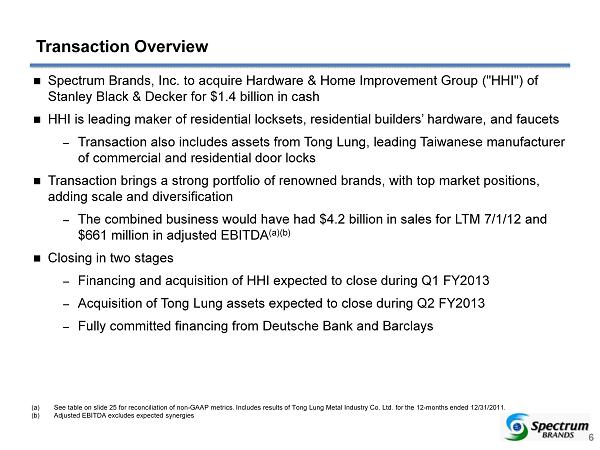
6 Transaction Overview ' Spectrum Brands, Inc. to acquire Hardware & Home Improvement Group ("HHI") of Stanley Black & Decker for $ 1.4 billion in cash / HHI is leading maker of residential locksets, residential builders’ hardware, and faucets – Transaction also includes assets from Tong Lung, leading Taiwanese manufacturer of commercial and residential door locks / Transaction brings a strong portfolio of renowned brands, with top market positions, adding scale and diversification – The combined business would have had $4.2 billion in sales for LTM 7/1/12 and $661 million in adjusted EBITDA (a)(b) / Closing in two stages – Financing and acquisition of HHI expected to close during Q1 FY2013 – Acquisition of Tong Lung assets expected to close during Q2 FY2013 – Fully committed financing from Deutsche Bank and Barclays (a) See table on slide 25 for reconciliation of non - GAAP metrics. Includes results of Tong Lung Metal Industry Co. Ltd. for the 12 - months ended 12/31/2011 . (b) Adjusted EBITDA excludes expected synergies
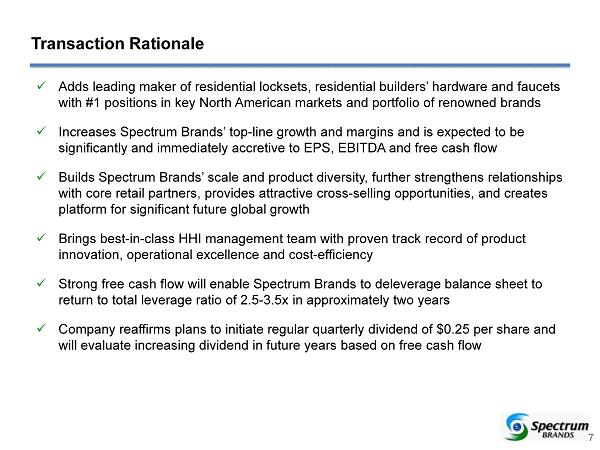
7 7 x Adds leading maker of residential locksets, residential builders ’ hardware and faucets with #1 positions in key North American markets and portfolio of renowned brands x Increases Spectrum Brands’ top - line growth and margins and is expected to be significantly and immediately accretive to EPS, EBITDA and free cash flow x Builds Spectrum Brands’ scale and product diversity, further strengthens relationships with core retail partners, provides attractive cross - selling opportunities, and creates platform for significant future global growth x Brings best - in - class HHI management team with proven track record of product innovation, operational excellence and cost - efficiency x Strong free cash flow will enable Spectrum Brands to deleverage balance sheet to return to total leverage ratio of 2.5 - 3.5x in approximately two years x Company reaffirms plans to initiate regular quarterly dividend of $0.25 per share and will evaluate increasing dividend in future years based on free cash flow Transaction Rationale
Spectrum Brands Overview David Lumley
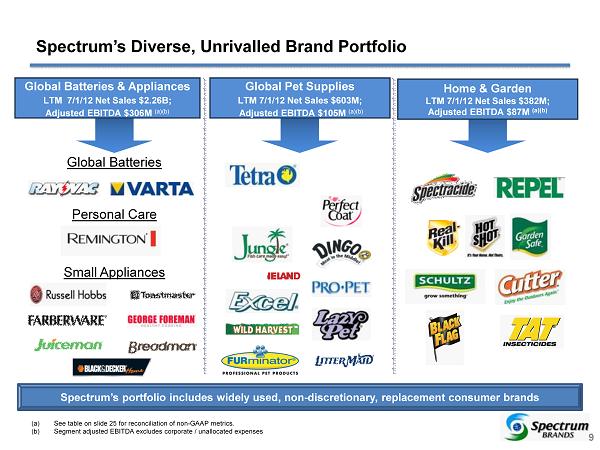
Spectrum’s Diverse, Unrivalled Brand Portfolio 9 Global Batteries Personal Care Small Appliances Global Batteries & Appliances LTM 7/1/12 Net Sales $2.26B; Adjusted EBITDA $ 306M (a)(b) Global Pet Supplies LTM 7/1/12 Net Sales $603M; Adjusted EBITDA $ 105M (a)(b) Home & Garden LTM 7/1/12 Net Sales $382M; Adjusted EBITDA $ 87M (a)(b) Spectrum’s portfolio includes widely used, non - discretionary, replacement consumer brands (a) See table on slide 25 for reconciliation of non - GAAP metrics. (b) Segment adjusted EBITDA excludes corporate / unallocated expenses
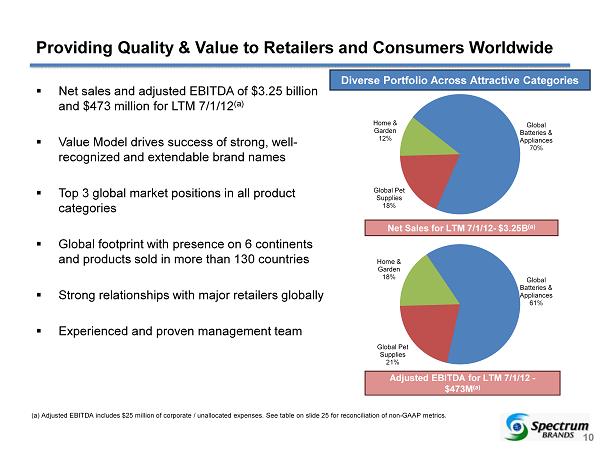
10 10 Global Batteries & Appliances 61% Global Pet Supplies 21% Home & Garden 18% Global Batteries & Appliances 70% Global Pet Supplies 18% Home & Garden 12% Providing Quality & Value to Retailers and Consumers Worldwide ▪ Net sales and adjusted EBITDA of $3.25 billion and $473 million for LTM 7/1/12 (a) ▪ Value Model drives success of strong, well - recognized and extendable brand names ▪ Top 3 global market positions in all product categories ▪ Global footprint with presence on 6 continents and products sold in more than 130 countries ▪ Strong relationships with major retailers globally ▪ Experienced and proven management team Diverse Portfolio Across Attractive Categories Net Sales for LTM 7/1/12 - $3.25B (a ) Adjusted EBITDA for LTM 7/1/12 - $473M (a) 10 (a) Adjusted EBITDA includes $25 million of corporate / unallocated expenses. See table on slide 25 for reconciliation of non - GAAP metrics.
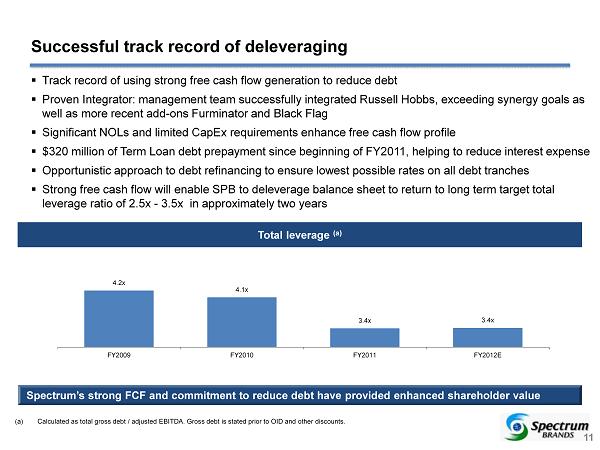
Spectrum’s strong FCF and commitment to reduce debt have provided enhanced shareholder value ▪ Track record of using strong free cash flow generation to reduce debt ▪ Proven Integrator: management team successfully integrated Russell Hobbs, exceeding synergy goals as well as more recent add - ons Furminator and Black Flag ▪ Significant NOLs and limited CapEx requirements enhance free cash flow profile ▪ $320 million of Term Loan debt prepayment since beginning of FY2011, helping to reduce interest expense ▪ Opportunistic approach to debt refinancing to ensure lowest possible rates on all debt tranches ▪ Strong free cash flow will enable SPB to deleverage balance sheet to return to long term target total leverage ratio of 2.5x - 3.5x in approximately two years Total leverage (a) (a) Calculated as total gross debt / adjusted EBITDA. Gross debt is stated prior to OID and other discounts . Successful track record of deleveraging 11 4.2x 4.1x 3.4x 3.4x FY2009 FY2010 FY2011 FY2012E
HHI Business Review Greg Gluchowski
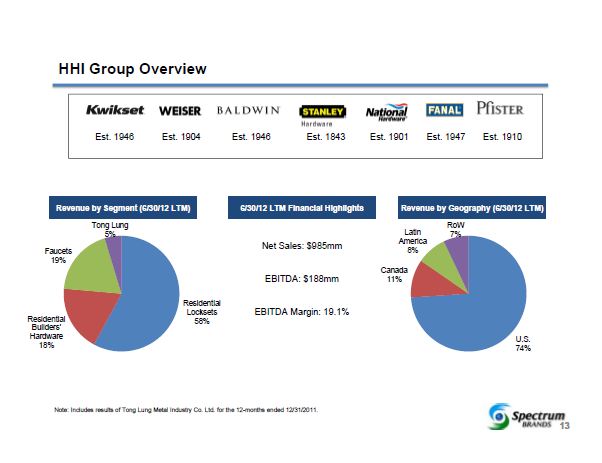
13 13 Revenue by Segment (6/30/12 LTM) Revenue by Geography (6/30/12 LTM) HHI Group Overview Est. 1946 Est. 1904 Est. 1946 Est. 1843 Est. 1901 Est. 1947 Est. 1910 Est. 1910 Est. 1946 Est. 1904 Est. 1946 Est. 1843 Est. 1901 Est. 1947 Est. 1910 Est. 1946 Est. 1904 Est. 1946 Est. 1843 Est. 1901 Est. 1947 Net Sales: $985mm EBITDA: $188mm EBITDA Margin: 19.1% 6/30/12 LTM Financial Highlights Note: Includes results of Tong Lung Metal Industry Co. Ltd. for the 12 - months ended 12/31/2011. Residential Locksets 58% Residential Builders ' Hardware 18% Faucets 19% Tong Lung 5% U.S. 74% Canada 11% Latin America 8% RoW 7%
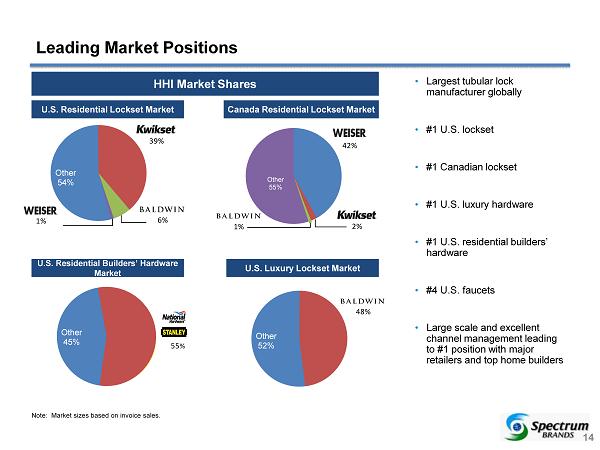
14 14 42% Other 55% 1% 2% 48% Other 52% 39% 1% 6% Other 54% 55 % Other 45% Leading Market Positions HHI Market Shares • Largest tubular lock manufacturer globally • #1 U.S. lockset • #1 Canadian lockset • #1 U.S. luxury hardware • #1 U.S. residential builders’ hardware • #4 U.S. faucets • Large scale and excellent channel management leading to #1 position with major retailers and top home builders Note: Market sizes based on invoice sales. U.S. Residential Lockset Market U.S. Luxury Lockset Market U.S. Residential Builders’ Hardware Market Canada Residential Lockset Market Other 54% Other 45% Other 52% Other 55%
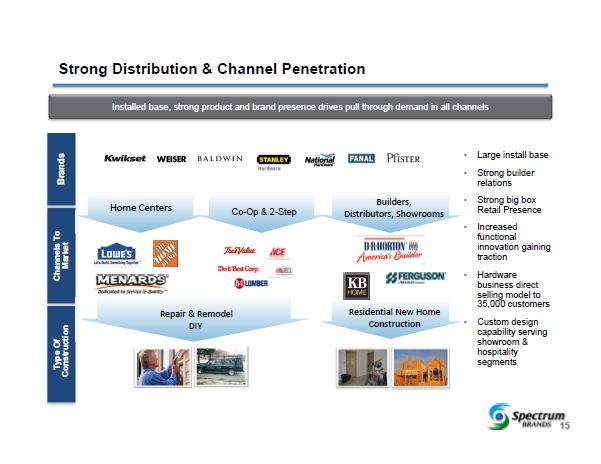
15 15 Strong Distribution & Channel Penetration Channels To Market Type Of Construction Home Centers Builders, Distributors, Showrooms Residential New Home Construction Repair & Remodel DIY Co - Op & 2 - Step • Large install base • Strong builder relations • Strong big box Retail Presence • Increased functional innovation gaining traction • Hardware business direct selling model to 35,000 customers • Custom design capability serving showroom & hospitality segments Brands Installed base, strong product and brand presence drives pull through demand in all channels Est. 1910 Est. 1946 Est. 1904 Est. 1946 Est. 1843 Est. 1901 Est. 1947 Est. 1910 Est. 1946 Est. 1904 Est. 1946 Est. 1843 Est. 1901 Est. 1947
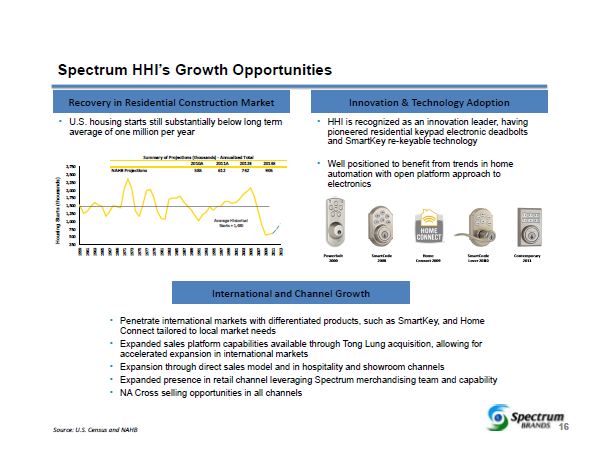
16 16 250 500 750 1,000 1,250 1,500 1,750 2,000 2,250 2,500 2,750 1959 1961 1963 1965 1967 1969 1971 1973 1975 1977 1979 1981 1983 1985 1987 1989 1991 1993 1995 1997 1999 2001 2003 2005 2007 2009 2011 2013 Housing Starts (thousands) Average Historical Starts = 1,480 2010A 2011A 2012E 2013E NAHB Projections 585 612 742 905 Summary of Projections (thousands) - Annualized Total Spectrum HHI’s Growth Opportunities Recovery in Residential Construction Market Innovation & Technology Adoption International and Channel Growth • U.S. housing starts still substantially below long term average of one million per year • HHI is recognized as an innovation leader, having pioneered residential keypad electronic deadbolts and SmartKey re - keyable technology • Well positioned to benefit from trends in home automation with open platform approach to electronics • Penetrate international markets with differentiated products, such as SmartKey , and Home Connect tailored to local market needs • Expanded sales platform capabilities available through Tong Lung acquisition, allowing for accelerated expansion in international markets • Expansion through direct sales model and in hospitality and showroom channels • Expanded presence in retail channel leveraging Spectrum merchandising team and capability • NA Cross selling opportunities in all channels Source: U.S. Census and NAHB Powerbolt 2000 Next Gen SmartCode 2013 Next Gen Keyless 2012 Smartphone Access 2013 4 Year Sales G rowth A Decade of I nnovation Powerbolt 2000 SmartCode 2008 SmartCode Lever 2010 Home Connect 2009 Contemporary 2011 Future Products to Drive Growth Next Gen SmartCode 2013 Next Gen Keyless 2012 Smartphone Access 2013 4 Year Sales G rowth A Decade of I nnovation Powerbolt 2000 SmartCode 2008 SmartCode Lever 2010 Home Connect 2009 Contemporary 2011 Future Products to Drive Growth Next Gen SmartCode 2013 Next Gen Keyless 2012 Smartphone Access 2013 4 Year Sales G rowth A Decade of I nnovation Powerbolt 2000 SmartCode 2008 SmartCode Lever 2010 Home Connect 2009 Contemporary 2011 Future Products to Drive Growth Next Gen SmartCode 2013 Next Gen Keyless 2012 Smartphone Access 2013 4 Year Sales G rowth A Decade of I nnovation Powerbolt 2000 SmartCode 2008 SmartCode Lever 2010 Home Connect 2009 Contemporary 2011 Future Products to Drive Growth Next Gen SmartCode 2013 Next Gen Keyless 2012 Smartphone Access 2013 4 Year Sales G rowth A Decade of I nnovation Powerbolt 2000 SmartCode 2008 SmartCode Lever 2010 Home Connect 2009 Contemporary 2011 Future Products to Drive Growth SmartCode 2008 Home Connect 2009 SmartCode Lever 2010 Contemporary 2011
17 17 The Combined Company David Lumley +
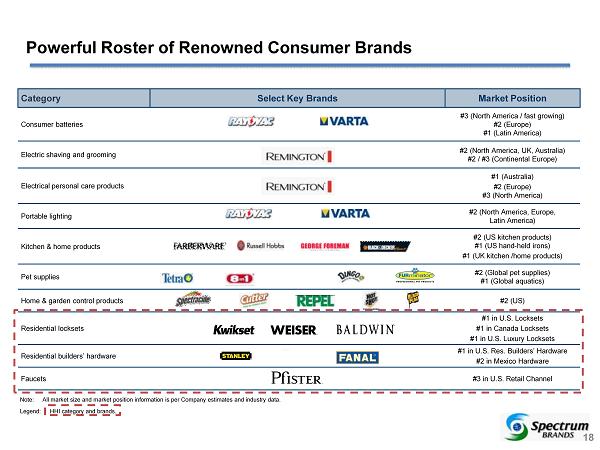
Powerful Roster of Renowned Consumer Brands Category Select Key Brands Market Position Consumer batteries #3 (North America / fast growing) #2 (Europe) #1 (Latin America) Electric shaving and grooming #2 (North America, UK, Australia) #2 / #3 (Continental Europe) Electrical personal care products #1 (Australia) #2 (Europe) #3 (North America) Portable lighting #2 (North America, Europe, Latin America) Kitchen & home products #2 (US kitchen products) #1 (US hand - held irons) #1 (UK kitchen /home products) Pet supplies #2 (Global pet supplies) #1 (Global aquatics) Home & garden control products #2 (US) Residential locksets #1 in U.S. Locksets #1 in Canada Locksets #1 in U.S. Luxury Locksets Residential builders’ hardware #1 in U.S. Res. Builders’ Hardware #2 in Mexico Hardware Faucets #3 in U.S. Retail Channel Note: All market size and market position information is per Company estimates and industry data. 18 HHI category and brands. Legend:
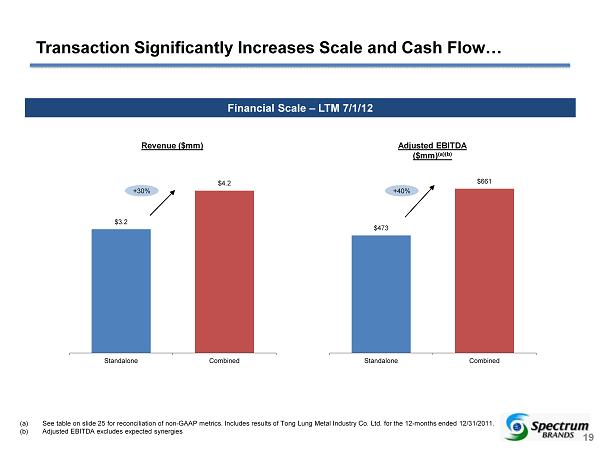
19 19 $3.2 $4.2 Standalone Combined $473 $661 Standalone Combined Transaction Significantly Increases Scale and Cash Flow… 19 Financial Scale – LTM 7/1/12 +30% Revenue ($mm) Adjusted EBITDA ($mm) (a)(b) +40% (a) See table on slide 25 for reconciliation of non - GAAP metrics. Includes results of Tong Lung Metal Industry Co. Ltd. for the 12 - months ended 12/31/2011 . (b) Adjusted EBITDA excludes expected synergies
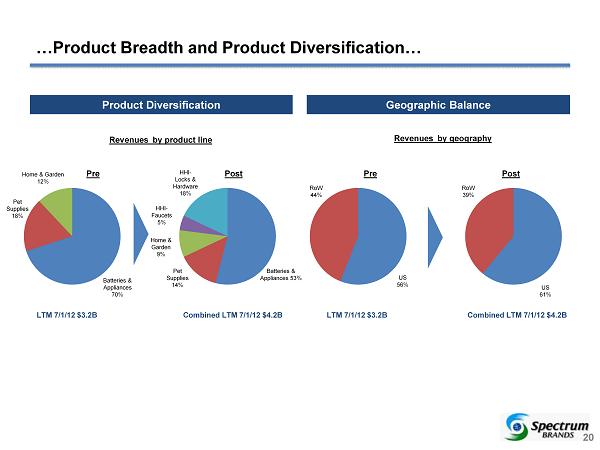
20 20 …Product Breadth and Product Diversification… 20 Product Diversification Geographic Balance LTM 7/1/12 $3.2B Combined LTM 7/1/12 $4.2B Pre Post Pre Post Batteries & Appliances 70% Pet Supplies 18% Home & Garden 12% Batteries & Appliances 53% Home & Garden 9% Pet Supplies 14% HHI - Faucets 5% HHI - Locks & Hardware 18% US 61% RoW 39% US 56% RoW 44% Revenues by product line Revenues by geography LTM 7/1/12 $3.2B Combined LTM 7/1/12 $4.2B
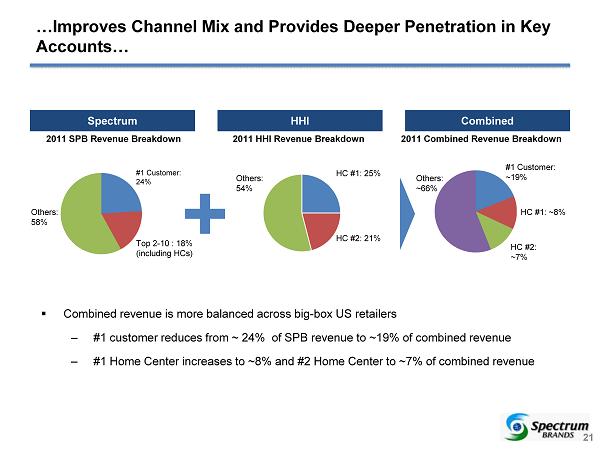
…Improves Channel Mix and Provides Deeper Penetration in Key Accounts… 21 Spectrum 2011 HHI Revenue Breakdown Others: 54% HC #1: 25% HC #2: 21% 2011 SPB Revenue Breakdown Others: 58% #1 Customer: 24% Top 2 - 10 : 18% (including HCs) 2011 Combined Revenue Breakdown #1 Customer: ~19% HC #1: ~8% HC #2: ~7% Others: ~66% HHI Combined ▪ Combined revenue is more balanced across big - box US retailers – #1 customer reduces from ~ 24 % of SPB revenue to ~19% of combined revenue – #1 Home Center increases to ~ 8 % and #2 Home Center to ~7% of combined revenue
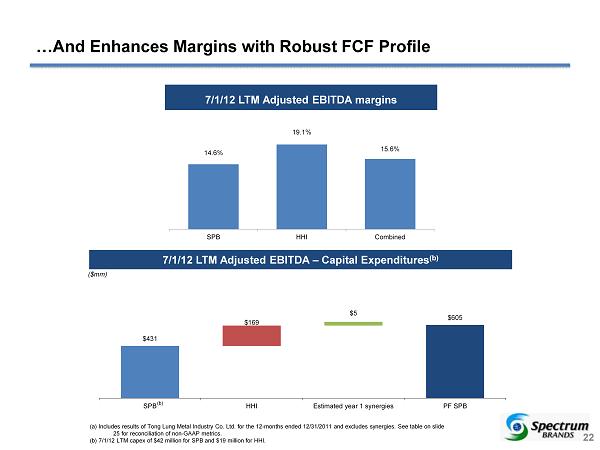
…And Enhances Margins with Robust FCF Profile 22 7/1/12 LTM Adjusted EBITDA margins 7/1/12 LTM Adjusted EBITDA – Capital Expenditures (b) (a) Includes results of Tong Lung Metal Industry Co. Ltd. for the 12 - months ended 12/31/2011 and excludes synergies. See table on slide 25 for reconciliation of non - GAAP metrics. (b) 7/1/12 LTM capex of $42 million for SPB and $19 million for HHI. 14.6% 19.1% 15.6% SPB HHI Combined ($mm) $169 $5 $431 $605 SPB HHI Estimated year 1 synergies PF SPB (b)
23 23 x Adds leading maker of residential locksets, residential builders ’ hardware and faucets with #1 positions in key North American markets and portfolio of renowned brands x Increases Spectrum Brands’ top - line growth and margins and is expected to be significantly and immediately accretive to EPS, EBITDA and free cash flow x Builds Spectrum Brands’ scale and product diversity, further strengthens relationships with core retail partners, provides attractive cross - selling opportunities, and creates platform for significant future global growth x Brings best - in - class HHI management team with proven track record of product innovation, operational excellence and cost - efficiency x Strong free cash flow will enable Spectrum Brands to deleverage balance sheet to return to total leverage ratio of 2.5 - 3.5x in approximately two years x Company reaffirms plans to initiate regular quarterly dividend of $0.25 per share and will evaluate increasing dividend in future years based on free cash flow +
Appendix