Attached files
| file | filename |
|---|---|
| 8-K - FORM 8-K - MOSAIC CO | d421418d8k.htm |
| EX-99.1 - TRANSCRIPT OF CONFERENCE CALL - MOSAIC CO | d421418dex991.htm |
 The Mosaic Company
Earnings Conference Call –
1st Quarter Fiscal 2013
October 2, 2012
Jim Prokopanko, President and Chief Executive Officer
Larry
Stranghoener,
Executive
Vice
President
and
Chief
Financial
Officer
Laura Gagnon, Vice President Investor Relations
Exhibit 99.2 |
 2
Safe Harbor Statement
This presentation contains forward-looking statements within the meaning of
the Private Securities Litigation Reform
Act
of
1995.
Such
statements
include,
but
are
not
limited
to,
statements
about
future
financial
and
operating results. Such statements are based upon the current beliefs and
expectations of The Mosaic Company’s management and are subject to
significant risks and uncertainties. These risks and uncertainties include but are
not limited to the predictability and volatility of, and customer expectations
about, agriculture, fertilizer, raw material, energy and transportation
markets that are subject to competitive and other pressures and economic and
credit market conditions; the level of inventories in the distribution channels
for crop nutrients; changes in foreign currency and exchange rates;
international trade risks; changes in government policy; changes in environmental
and other governmental regulation, including greenhouse gas regulation,
implementation of the U.S. Environmental
Protection
Agency’s
numeric
water
quality
standards
for
the
discharge
of
nutrients
into
Florida
lakes and streams or possible efforts to reduce the flow of excess nutrients into
the Gulf of Mexico; further developments in judicial or administrative
proceedings; difficulties or delays in receiving, increased costs of or
challenges to necessary governmental permits or approvals or increased financial
assurance requirements; resolution of global tax audit activity; the
effectiveness of the Company’s processes for managing its strategic
priorities; adverse weather conditions affecting operations in Central Florida or
the Gulf Coast of the United States, including potential hurricanes or
excess rainfall; actual costs of various items differing from management’s current
estimates, including, among others, asset retirement, environmental remediation,
reclamation or other environmental regulation, or Canadian resources taxes
and royalties; accidents and other disruptions involving Mosaic’s
operations, including brine inflows at its Esterhazy, Saskatchewan potash mine and other potential mine
fires, floods, explosions, seismic events or releases of hazardous or volatile
chemicals, as well as other risks and uncertainties reported from time to
time in The Mosaic Company’s reports filed with the Securities and Exchange
Commission. Actual results may differ from those set forth in the
forward-looking statements. |
 |
 4
First Quarter Financial Highlights
$1.01 in Earning per Share
$0.02 loss from notable items
$2.5 billion
$610 million
Revenue
Phosphates
Potash
$1,561
$960
$208
$416
Operating Earnings |
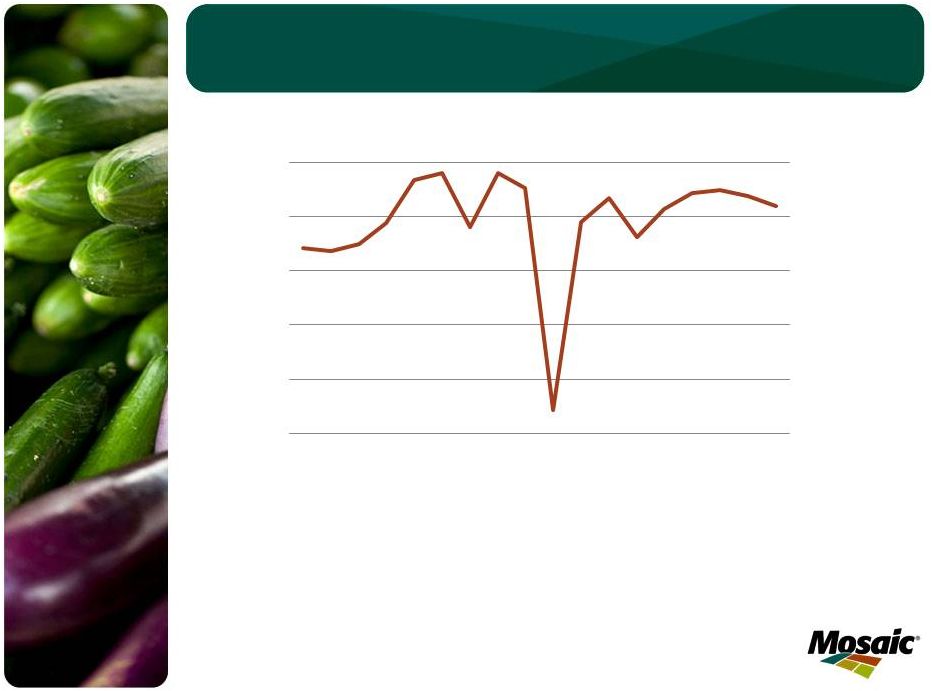
 5
Grain and Oilseed Stocks at Critical Levels
70
72
74
76
78
80
82
84
86
88
90
92
94
96
98
00
02
04
06
08
10
12F
Actual
Average
Crop Year
14%
16%
18%
20%
22%
24%
26%
28%
30%
32%
34%
Source: USDA
Global
Grain
and
Oilseed
Stocks-To-Use
Percentage |
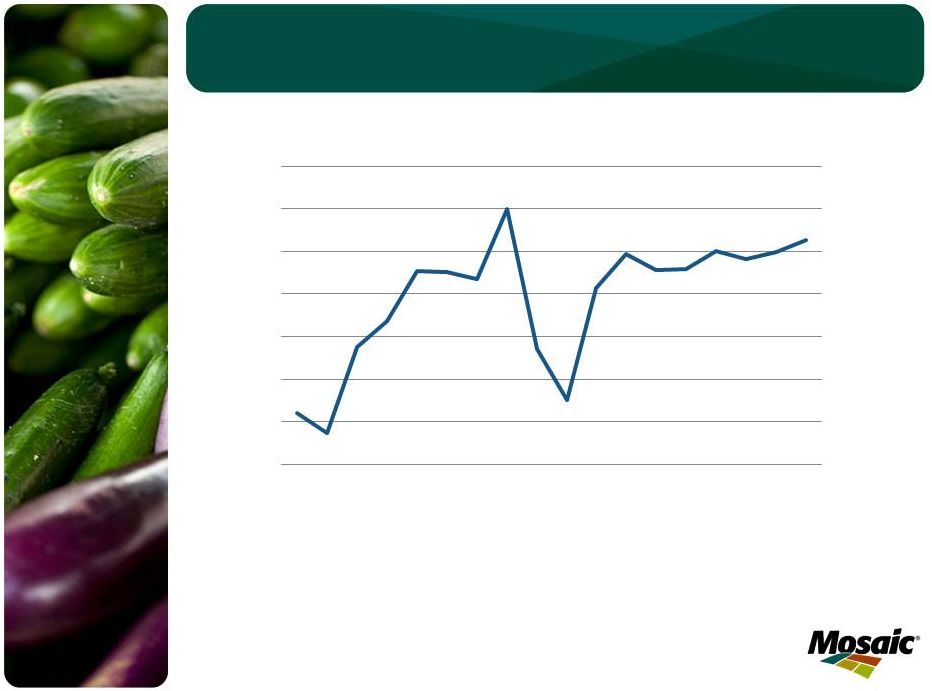
 6
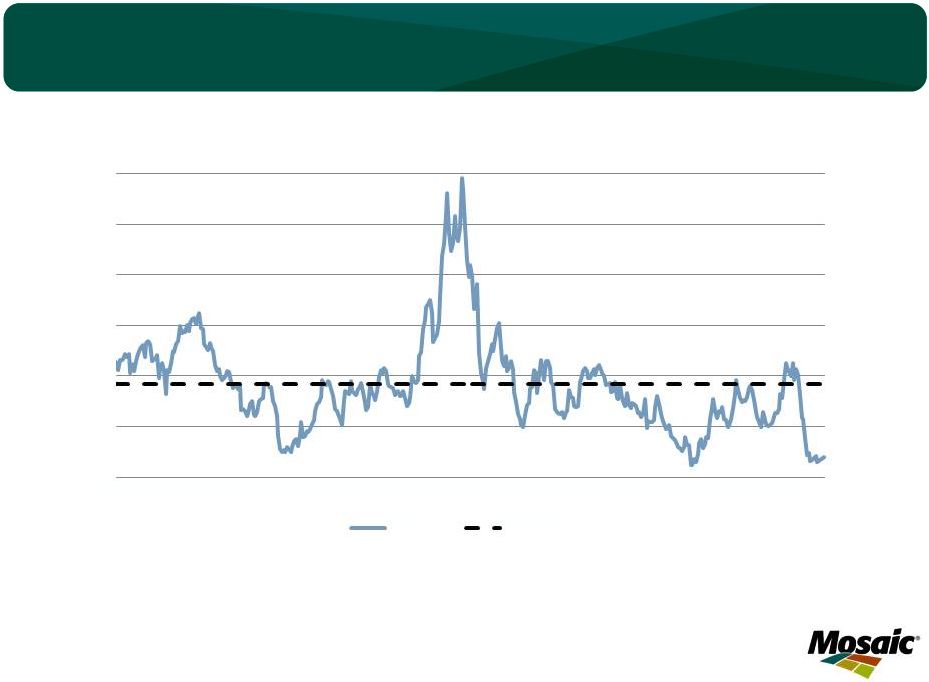
Crop Nutrients are Highly Affordable
0.50
0.70
0.90
1.10
1.30
1.50
1.70
05
06
07
08
09
10
11
12
Crop Nutrient Price Index/Crop Price Index Ratio
Ratio
Average
Our homemade Plant Nutrient Affordability metric is a ratio of a plant nutrient price index and a crop
price index. The plant nutrient price index is a weighted average of indices for urea,
DAP and MOP prices. These indices are calculated using weekly published spot prices at key U.S.
pricing points. Weights are N, P, and K percentages of total U.S. nutrient use from 2005 to
2007. The crop price index is a weighted average of indices for corn, soybeans and
wheat. These indices are calculated using the daily closing price of the front month futures contract. Weights
are the shares of total U.S. production of these three crops from 2005 to 2007. The base year
for all indices is 2005. Source: Mosaic
|
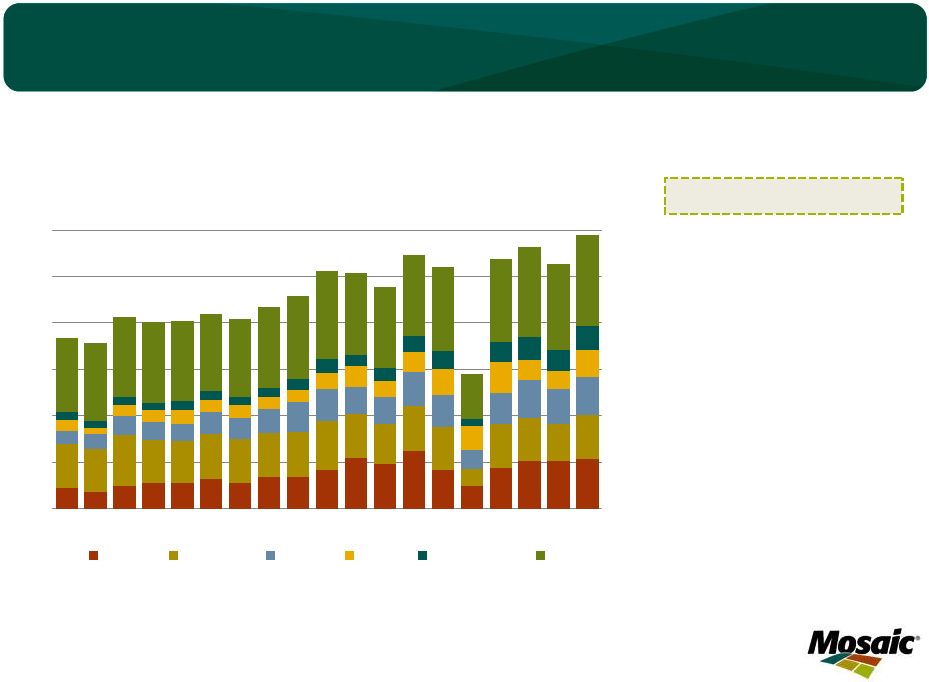
 Global Farm Economics at Historical Highs
•
Increases in cash payments
•
Improving farmer returns,
despite higher at the farm
fertilizer costs
North America
India
•
Record farm cash income
•
~$25B in crop insurance
payouts
Brazil
•
Record acreage expected
for beans and corn
0
20
40
60
80
100
120
140
80
82
84
86
88
90
92
94
96
98
00
02
04
06
08
10
12F
$ in billions
U.S. Net Cash Farm Income
From Government Payments
From Farming
Source: USDA
0
10,000
20,000
30,000
40,000
50,000
60,000
70,000
80,000
2005
2006
2007
2008
2009
2010
2011
2012
INR hectare
Source: Mosaic
Indian Farm Economics
Estimated Revenue after Variable Cost
Rice
Punjab/Haryana
Wheat
Punjab/Haryana
-
- |
 8
Grain Rally and Fertilizer Pricing
•
Caution in the value chain
•
India P&K subsidy changes
•
Weaker macro environment
•
Greater supply certainty
Why haven’t fertilizer prices followed the grain
rally, like we saw in 2008? |
 9
Sentiment and Fundamentals
•
Declining potash producer inventories
•
Phosphate supply uncertainties
•
Elimination of drought-related
uncertainties
Potential catalysts to changing market
sentiment: |
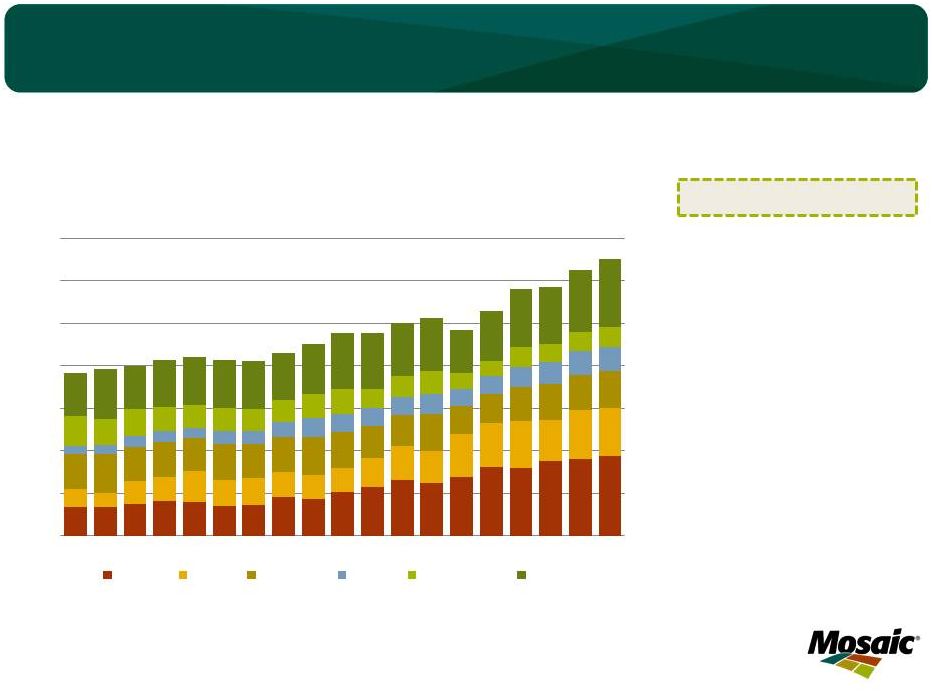
 10
Potash Market Correcting:
Poised for Recovery in 2013
Dynamics
•
China/India delaying
purchasing
•
North American
inventories declined for
3
rd
month in a row
0
10
20
30
40
50
60
95
96
97
98
99
00
01
02
03
04
05
06
07
08
09
10
11
12F
13F
China
North Am
Brazil
India
Indo/Malay
Other
Source: Fertecon
and Mosaic
World Muriate of Potash Shipments
Million tonnes
KCL |
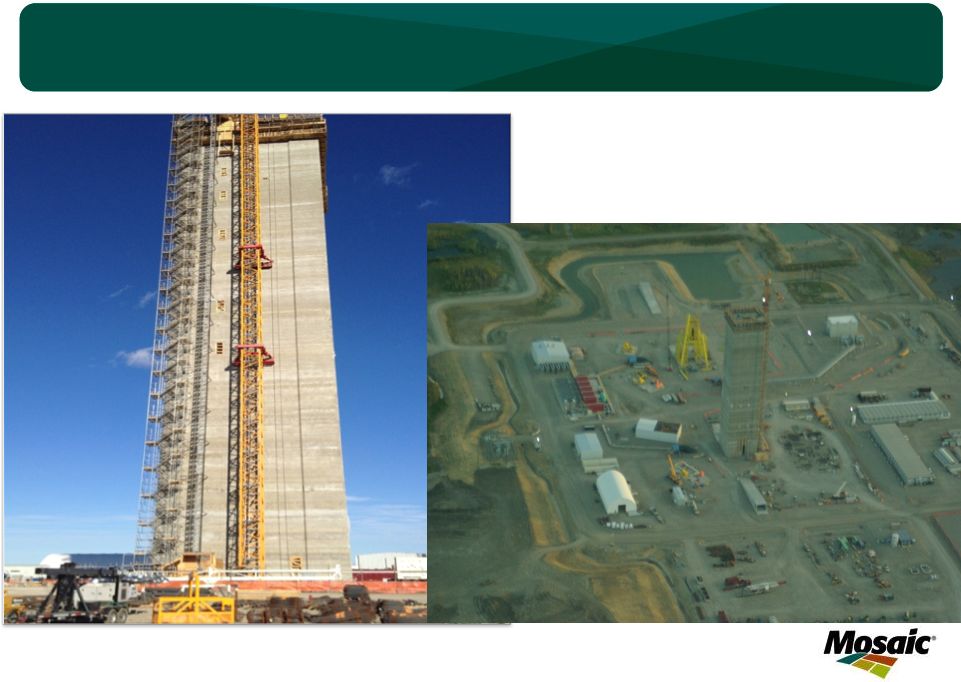 11
Head Frame at Esterhazy K3 |
 Potash Operating Rates
Source: Fertecon demand assumptions, Assumes global MOP demand grows to 69 million
tonnes in 2017 and effective capacity increases to 75 million tonnes
in 2017. •
Better than expected balance during the next five years
•
More capacity later in decade
•
Some projects more likely than others
50%
60%
70%
80%
90%
100%
00
02
04
06
08
10
12F
14F
16F
Global MOP Operating Rates
Source: Mosaic
12 |
 Phosphates is a Tight Market
•
Very low North
American producer
inventories
•
Drought-related, low
river levels impacting
timing of North
American shipping
•
Global supply
uncertainty
0
10
20
30
40
50
60
70
95
96
97
98
99
00
01
02
03
04
05
06
07
08
09
10
11
12F
13F
Million tonnes
DAP/MAP/TSP
World Processed Phosphate Shipments
China
India
North Am
Brazil
Europe/FSU
Other
Dynamics
13
Source:
Fertecon
and
Mosaic |
 Phosphate Operating Rates in the
Short and Near Term
Source: Fertecon demand assumptions, Mosaic estimates of capacity additions of 11
million tonnes expansion plans, including: Ma’aden on line in 2011,
doubling in 2017. •
Expected new capacity just keeps pace with projected
demand growth
•
Supply uncertainties
•
Growing demand
65%
68%
70%
73%
75%
78%
80%
83%
00
01
02
03
04
05
06
07
08
09
10
11
12F
13F
14F
15F
16F
17F
Global Phosphoric Acid Operating Rates
Source: Mosaic
14
of phosphoric acid in Middle East, North Africa, China and Latin America based on announced |
 Financial Results Review |
 16
First Quarter Financial Performance
In millions, except per share amounts
Three Months Ended
August 31,
2012
2011
Net Sales
$2,505
$3,083
Gross Margin
$747
$848
% of net sales
30%
28%
Net Earnings
$429
$526
% of net sales
17%
17%
Diluted EPS
$1.01
$1.17
Effective Tax Rate
28%
28%
Cash Flow Provided by Operations
$339
$554
Cash and Cash Equivalents
$3,595
$4,038 |
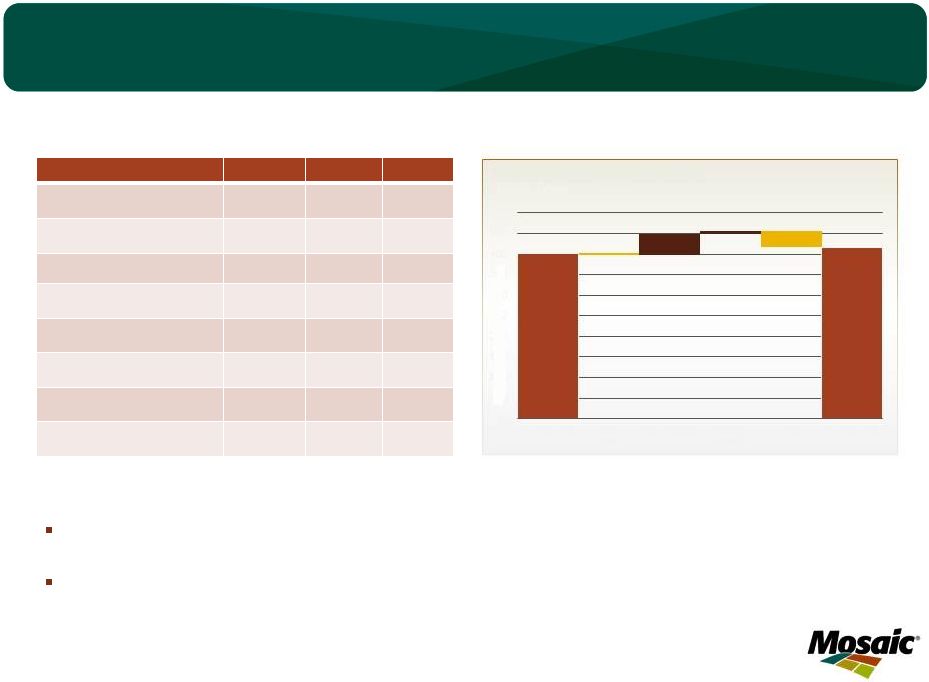 17
Potash Segment Highlights
In millions, except MOP price
Q1 FY13
Q4 FY12
Q1 FY12
Net sales
$960
$1,037
$873
Gross Margin
$459
$514
$444
Percent of net sales
48%
50%
51%
Operating earnings
$416
$464
$402
Sales volumes
1.9
2.0
1.8
Production volume
1.5
1.9
1.9
Production operating rate
65%
85%
81%
Avg MOP selling price
$444
$455
$446
First quarter highlights:
Gross margins were impacted by increased brine
management expenses, longer shut-downs and higher depreciation,
partially offset by mark-to-market gains on derivatives.
Brine management costs were $28M higher than last year’s quarter, reflecting
higher expenses related to advanced technologies, such as horizontal
drilling. 0
50
100
150
200
250
300
350
400
450
500
Q1 FY12 OE
Sales Sales volumes
price
Resource
taxes
Other
Q1 FY13 OE
OPERATING EARNINGS BRIDGE
$ IN MILLIONS |
 18
Tolling Agreement and Canpotex
Allocation Process
Tolling Agreement Impact on P&L
•
Effective January 1, 2013
•
Canpotex allocation change: from 37% to 43% *
Canpotex Allocation Process
•
Current rules based on peaking capacities in effect at that time
•
Adjusted based on proving runs
•
Entitlements reviewed twice a year (January/July)
* Excluding any expansions |
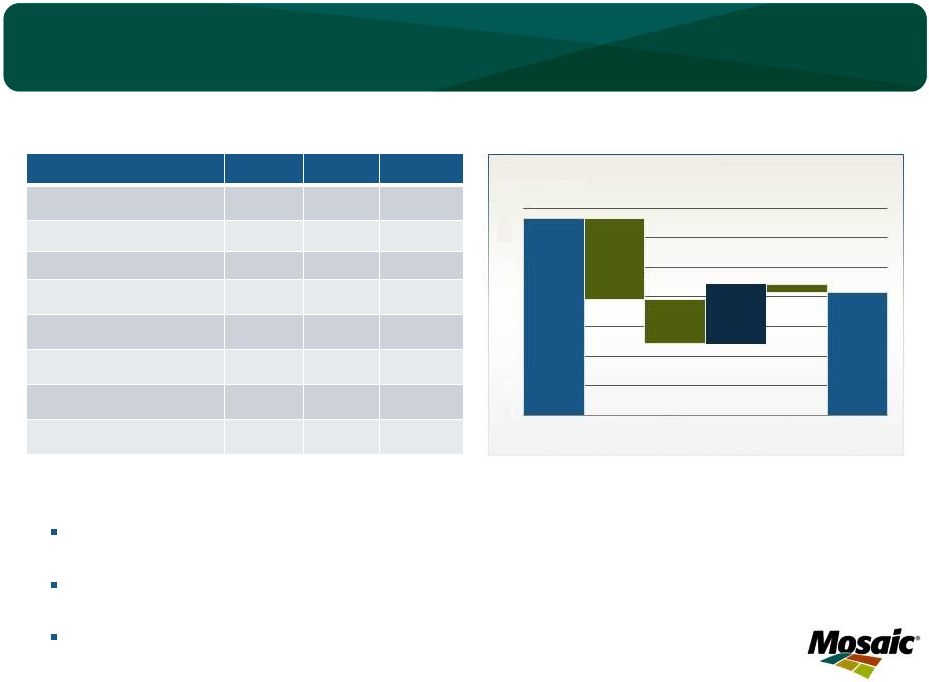 19
Phosphates Segment Highlights
In millions, except DAP price
Q1 FY13
Q4 FY12
Q1 FY12
Net sales
$1,561
$1,789
$2,220
Gross Margin
$288
$322
$410
Percent of net sales
18%
18%
18%
Operating earnings
$208
$224
$333
Sales volumes
2.7
2.9
3.2
NA production volume
(a)
2.0
2.1
2.2
Finished product operating rate
81%
86%
89%
Avg DAP selling price
$529
$494
$576
(a)
Includes crop nutrient dry concentrates and animal feed ingredients
First quarter highlights:
Sales volumes impacted by limited inventory availability and transportation
logistics related to Mississippi river water levels.
Margins reflect lower rock costs due to startup of South Fort Meade, lower ammonia
costs; offset by lower concentrate operating rates and a higher mix of lower
margin blend products. South Fort Meade is fully operational; expect to start
shipping rock across the Gulf to our Louisiana facilities.
0
50
100
150
200
250
300
350
Q1 FY12
OE
Sales
price
Sales
volumes
Raw
materials
Other
Q1 FY13
OE
OPERATING EARNINGS BRIDGE
$ IN MILLIONS |
 20
Financial Guidance Summary
Category
Guidance
–
Fiscal
2013
Potash
Q2
Sales
volume
1.6
-
1.9
million
tonnes
Q2
MOP
selling
price
$420
-
$450
per
tonne
Q2 Operating rate above 70 percent
Phosphates
Q2
Sales
volume
3.0
-
3.4
million
tonnes
Q2
DAP
selling
price
$520
-
$550
per
tonne
Q2 Operating rate above 80 percent
Capital Expenditures
$1.5
-
$1.8
billion
Canadian Resource Taxes
and Royalties
$320
-
$380
million
SG&A
$420
-
$445
million
Effective Tax Rate
Upper 20 percent range |
 21
Fiscal Year 2013 Outlook
Post drought demand
River levels
India and China
Record farmer
economics
Tight grain & oilseed
stocks-to-use
Capital deployment |
 22
Progress Towards Fiscal Year 2013 Goals
Safety Performance
ROIC/Momentum
Sustainability
Premium Products
Sustainability
On Time, on Budget
Capacity Timing
Ammonia Investment
TSR focus
Potash Expansion
Innovation
Operational Excellence
Capital |
 |
 24
FY13 Q1
Actual
Change
FY13 Q1
Margin %
Actual
% Impact on
Segment
Margin
Pre-Tax
Impact
EPS
Impact
Marketing
MOP Price ($/tonne)
$444
$50
47.9%
9.2%
$88
$0.15
Potash Volume
(million tonnes)
1.9
0.5
47.9%
16.9%
$162
$0.27
DAP Price ($/tonne)
$529
$50
18.4%
6.3%
$98
$0.17
Phosphate Volume
(million tonnes)
2.7
0.5
18.4%
5.8%
$90
$0.15
Raw Materials
Sulfur ($/lt)
$196
$50
18.4%
2.6%
$40
$0.07
Ammonia ($/tonne)
$449
$50
18.4%
1.4%
$22
$0.04
(a)
These factors do not change in isolation; actual results could vary from the above
estimates (b)
Assumes no change to KMAG pricing
(b)
Earnings
Sensitivity
to
Key
Drivers
(a) |
 25
Raw Material Cost Detail
The company is currently implementing a new inventory valuation system. After
implementation, the company expects to include this information in its
performance data disclosures. Q1 FY2013
%
Ammonia
Realized in COGS
$ 449
Average Purchase Price
$ 664
Sulfur
Realized in COGS
$ 196
Average Purchase Price
$ 189
Phosphate rock (used in production)
('000 metric tonnes)
US mined rock
2,895
88%
Purchased Miski Mayo rock
150
5%
Other purchased rock
251
8%
Total
3,296
100%
Average cost / tonne consumed rock
$ 64
|