Attached files
| file | filename |
|---|---|
| 8-K - FORM 8-K - UNITED AIRLINES, INC. | d421003d8k.htm |
 Credit Suisse Global
Credit Products
Conference
United Continental
Holdings, Inc.
October 5, 2012
Exhibit 99.1 |
 Ted
North Managing Director –
Corporate Finance |
| Safe
Harbor Statement Certain statements included in this presentation are
forward-looking and thus reflect our current expectations and beliefs with
respect to certain current and future events and financial performance. Such
forward-looking statements are and will be subject to many risks and
uncertainties relating to our operations and business environment that may cause actual results to differ materially
from
any
future
results
expressed
or
implied
in
such
forward-looking
statements.
Words
such
as
“expects,”
“will,”
“plans,”
“anticipates,”
“indicates,”
“believes,”
“forecast,”
“guidance,”
“outlook”
and similar expressions are intended to identify forward-
looking
statements.
Additionally,
forward-looking
statements
include
statements
which
do
not
relate
solely
to
historical
facts,
such as statements which identify uncertainties or trends, discuss the possible
future effects of current known trends or uncertainties, or which indicate
that the future effects of known trends or uncertainties cannot be predicted, guaranteed or
assured. All forward-looking statements in this presentation are based upon
information available to us on the date of this presentation. We undertake no
obligation to publicly update or revise any forward-looking statement, whether as a result of new
information, future events, changed circumstances or otherwise, except as required by
applicable law. Our actual results could differ materially from these
forward-looking statements due to numerous factors including, without limitation, the following: our
ability to comply with the terms of our various financing arrangements; the costs and
availability of financing; our ability to maintain
adequate
liquidity;
our
ability
to
execute
our
operational
plans;
our
ability
to
control
our
costs,
including
realizing
benefits
from our resource optimization efforts, cost reduction initiatives and fleet
replacement programs; our ability to utilize our net operating losses; our
ability to attract and retain customers; demand for transportation in the markets in which we operate; an
outbreak of a disease that affects travel demand or travel behavior; demand for
travel and the impact that global economic conditions have on customer travel
patterns; excessive taxation and the inability to offset future taxable income; general economic
conditions (including interest rates, foreign currency exchange rates, investment or
credit market conditions, crude oil prices, costs of aircraft fuel and energy
refining capacity in relevant markets); our ability to cost-effectively hedge against increases in the
price of aircraft fuel; any potential realized or unrealized gains or losses related
to fuel or currency hedging programs; the effects of any hostilities, act of
war or terrorist attack; the ability of other air carriers with whom we have alliances or partnerships to
provide
the
services
contemplated
by
the
respective
arrangements
with
such
carriers;
the
costs
and
availability
of
aviation
and
other
insurance;
the
costs
associated
with
security
measures
and
practices;
industry
consolidation
or
changes
in
airline
alliances;
competitive pressures on pricing and demand; our capacity decisions and the capacity
decisions of our competitors; U.S. or foreign governmental legislation,
regulation and other actions (including open skies agreements and environmental regulations);
labor
costs;
our
ability
to
maintain
satisfactory
labor
relations
and
the
results
of
the
collective
bargaining
agreement
process
with
our union groups; any disruptions to operations due to any potential actions by our
labor groups; weather conditions; the possibility that expected merger
synergies will not be realized or will not be realized within the expected time period; and other
risks and uncertainties set forth under Item 1A., Risk Factors of the Company’s
Annual Report on Form 10-K, as well as other risks and uncertainties set
forth from time to time in the reports we file with the SEC. Consequently, forward-looking statements should
not
be
regarded
as
representations
or
warranties
by
us
that
such
matters
will
be
realized.
3
3 |
 United
is transforming Broad,
business-centric
network
Capacity
discipline &
business
flexibility
Strengthening
the balance
sheet
Investing in
our people,
customers,
products &
technology
Growing
high-margin
businesses
4
We are building a new airline |
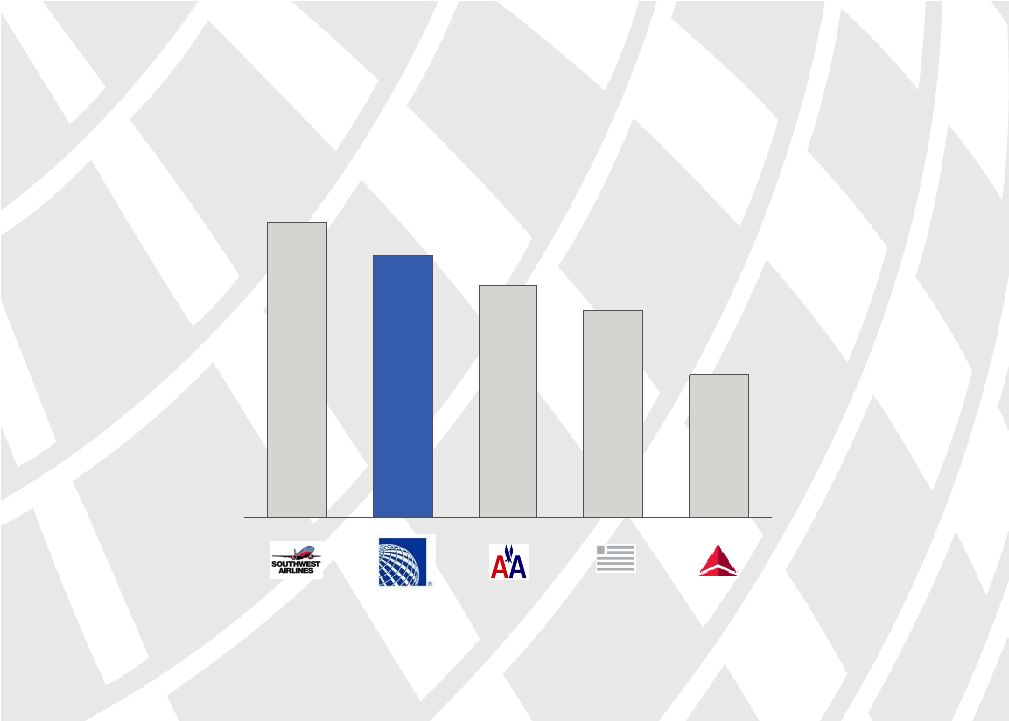
 The
world’s best network Serving the most destinations of any global
carrier Hubs in the four largest U.S. cities
50 of Fortune 100 companies headquartered in hubs
Rankings for US carriers by TME 2Q 2012 scheduled ASMs
Source: OAG
5
Best Network for Business Customers |
 Industry-leading unit revenue
1. Consolidated PRASM numbers for carriers other than UAL adjusted for length of haul
versus UAL’s length of haul Source: Earnings releases and SEC
filings 6
TME 2Q 2012 PRASM
1
(in cents)
8.86
10.60
11.94
12.06
13.12 |
 1.
Source: Kiodex – Platts US Gulf Coast Jet
2. Source: Earnings releases and SEC filings; Excludes special, one-time items.
See non-GAAP reconciliation in Appendix B; Results prior to 4Q10 proforma
Pre-tax Earnings/(Loss) ($B)
2
7
$1.1
($2.3)
TME 2Q12
2008
Average Jet A ($/bbl)
1
TME 2Q12
$127.4
2008
$124.7
Generating solid earnings despite elevated fuel prices |
 ROIC
goal of 10% over the business cycle Return on Invested Capital
8
Note: Results proforma prior to 4Q 2010; ROIC calculation available in Appendix A and
on our website: http//:ir.united.com Source: SEC filings
1. Source: Kiodex –
Platts US Gulf Coast Jet
10.3%
11.3%
7%
8%
9%
10%
11%
12%
13%
14%
TME 2Q 2012
2010 -
2Q 2012
10%
Threshold
Jet A Price ($/bbl)
1
Achieved 10% ROIC goal in most recent twelve month period despite elevated fuel
prices
70
80
90
100
110
120
130
140
Jan. 2011
Jan. 2010
Sep. 2012
Jan. 2012 |
 9
Note: Rolling consolidated capacity for prior twelve months; industry includes AMR,
DAL, LUV and LCC; capacity proforma for merged carriers Source: Earnings
releases and SEC filings (10%)
(5%)
0%
5%
Industry
ex-UAL
4Q08
4Q10
4Q09
2Q12
4Q06
4Q07
4Q11
Maintaining capacity discipline is core to our long-term
success |
 Source: SEC filings and investor updates
Consolidated Capacity Trend
(Year-over-Year % Change in ASMs)
2010
1
2011
(0.2%)
(1.75%)
2012E
2
(0.75%)
1.1%
Expect FY 2013 consolidated capacity to decline
approximately 1% year-over-year
10
Reducing capacity in response to economic outlook
Results proforma prior to 4Q 2010
Updated from July 2012 investor Update
1.
2. |
 Solid liquidity position
1. Cash,
short-term
investments
and
undrawn
credit
facilities
divided
by
TME
2Q
2012
revenue
Source: SEC filings
11
TME 2Q 2012 Liquidity
(as % of revenue)
14.6%
18.5%
20.0%
21.8%
23.8%
1 |
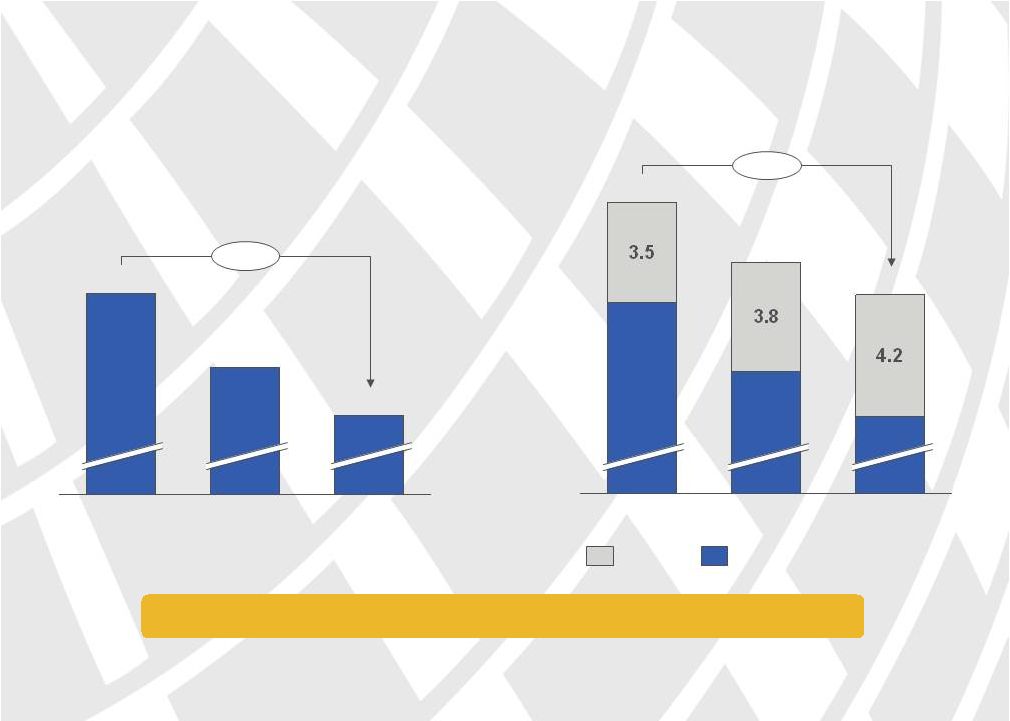 Note: Results prior to 4Q 2010 pro forma
Source: Earnings releases, SEC filings and July 2012 Investor Update
Net Debt
1
($B)
12
Net Debt
1
incl. Pension
2
($B)
2012 interest expense
3
expected to decline more than 20% vs. 2010
Committed to strengthening the balance sheet
$12.0
2009
$13.5
2010
$15.9
($3.9)
2011
2010
($3.2)
2011
$17.3
$16.2
12.0
15.9
$19.4
2009
13.5
Net Debt
Pension
1. Year end balances; Includes aircraft rent capitalized at 7
times 2. Pension includes the under-funded
portion of pension and post-retirement liabilities
3. 2012 interest expense is midpoint of non-operating
expense guidance from July 2012 Investor Update |
 $4B
of non-aircraft debt coming due through 2016 13
Scheduled Debt & Capital Lease Payments ($B)
0.4
1.0
1.2
1.0
2016
$1.1
0.7
0.0
2015
$2.1
0.9
2014
$2.3
1.0
2013
$1.9
0.8
2012
$1.5
0.8
0.4
0.1
0.2
0.1
0.3
Aircraft Amortization
Non-Aircraft
Aircraft Maturities
Note: As of September 26, 2012; Includes 2012-2 EETC financing
|
 Opportunity to increase unencumbered asset base
14
$11.3
$7.7
$5.1
$3.0
2015
2014
2013
2012
Potential Unencumbered Asset Balance ($B)
Note: Cumulative total of assets generally accepted as collateral in financing
transactions and not then encumbered; Asset values derived from historical
appraisals and company estimates; 2012 amount includes currently available assets and assets expected to become
unencumbered by 2012 year-end |
 Boeing 737
MAX 9
Highly efficient
Great fit for network
Unrivaled customer
experience
Boeing 787
Dreamliner
Investing in our fleet
15 |
 Record low coupon in September 2012 EETC financing
16
Finances
21
aircraft
to
be
delivered
November
2012
–
July
2013
18 Boeing 737-900ER
3 Boeing 787-8 Dreamliners
1. Without the benefit of an insurance policy to support repayment of principal
LTV of 55.0%
$712M of proceeds
4% fixed-rate coupon, lowest in
A Tranche
B Tranche
LTV of 65.2%
$132M of proceeds
5 ½% fixed-rate coupon
Blended fixed-rate coupon of 4.16% lowest EETC coupon ever achieved
1
history |
 Investing in our product and technology
New United
Club in
ORD T-2
Boeing
Sky
Interior
Enhanced
Agent
Interface
Global
Satellite
Wi-Fi |
 Growing high margin components of our business
18
90 million members worldwide
100+ partnerships to earn
Unmatched redemption opportunities
Up to 5 more inches of space in coach
Ancillary Revenue
Economy Plus
Value-add products & services
Dynamic pricing
Improved CRM targeting
® |
 19
Getting the basics right
Working Together culture
Direct, open & honest communication
Dignity & respect
We are a customer service business |
 United is transforming
We are building a new airline
Broad,
business-centric
network
Capacity
discipline &
business
flexibility
Strengthening
the balance
sheet
Investing in
our people,
customers,
products &
technology
Growing
high-margin
businesses
20 |
 21
Appendix A: ROIC calculation
TME 2Q12
$1,146
870
490
166
(6)
$2,666
TME 2Q12
$38,726
7,077
(19,863)
$25,940
10.3%
Source: Earnings releases and SEC filings;
1.Excludes special, one-time items. See non-GAAP reconciliation in Appendix
B 2.Interest components of NOPAT include tax effect at annualized cash tax
rate Net Operating Profit After Tax (“NOPAT”) ($M)
Adjusted Pre-Tax Income
+ Interest Expense
+ Interest Component of Capitalized Aircraft Rent
+ Net Interest on Pension
Adjusted for Cash Taxes
NOPAT
Invested Capital ($M)
Total Assets
+ Capitalized Aircraft Rent (@ 7.0x)
-
Non-Interest Bearing Liabilities
Average Invested Capital
Return on Invested Capital
2
2
2
1 |
 22
Appendix B: Non-GAAP Financial Reconciliation
S-UA
S-CO
UAL
UAL
($5,427)
($695)
($6,122)
$407
3,654
181
3,835
739
($1,773)
($514)
($2,287)
$1,146
$20,194
$15,241
$35,435
$37,640
(8.8%)
(3.4%)
(6.5%)
3.0%
Note: Non-GAAP financial measures are presented because they provide management
and investors with the ability to measure and monitor UAL’s performance
using similar criteria on a consistent basis. UAL believes that adjusting for special
items is useful to investors because they are non-recurring items not indicative
of UAL’s on-going performance. Special items relate to activities
that are not central to UAL’s ongoing operations or are unusual in nature.
2008
2008
2008
TME 2Q12
Pre-tax Margin
($ millions)
Earnings / (Loss) Before Income Taxes
Add: Special Items
Adjusted Earnings / (Loss) Before Income Taxes
Total Operating Revenue
Adjusted Pre-tax Margin |