Attached files
| file | filename |
|---|---|
| 8-K - 8-K - FARMERS NATIONAL BANC CORP /OH/ | d419345d8k.htm |
| 1 Farmers National Banc Corp. Canfield, OH (NASDAQ: FMNB) Investor Presentation June 30, 2012 Exhibit 99.1 |
| 2 Disclosure Statement Forward-Looking Statements This presentation contains forward-looking statements within the meaning of the Private Securities Litigation Reform Act of 1995. Forward-looking statements express management's current expectations, forecasts of future events or long-term-goals and, by their nature, are subject to assumptions, risks and uncertainties. Actual results could differ materially from those indicated. Farmers National Banc Corp. ("Farmers") refers you to its periodic reports and registration statements filed with the Securities and Exchange Commission, including its Annual Report on Form 10-K for the year ended December 31, 2011 and Quarterly Report on Form 10-Q for the period ended June 30, 2012 which have been filed with the Securities and Exchange Commission and are available on Farmers' website (www.farmersbankgroup.com) and on the Securities and Exchange Commission's website (www.sec.gov), for additional discussion of these assumptions, risks and uncertainties. Forward-looking statements are not guarantees of future performance and should not be relied upon as representing management's views as of any subsequent date. Farmers undertakes no obligation to update forward-looking statements, whether as a result of new information, future events or otherwise, except as may be required by law. Use of Non-GAAP Financial Measures This presentation contains certain financial information determined by methods other than in accordance with accounting principles generally accepted in the United States ("GAAP"). These non-GAAP financial measures include "Core Deposits" and "Pre-tax, Pre-provision Earnings". Farmers believes that these non-GAAP financial measures provide both management and investors a more complete understanding of the Company's deposit profile and profitability. These non-GAAP financial measures are supplemental and are not a substitute for any analysis based on GAAP financial measures. Because not all companies use the same calculation of "Core Deposits" and "Pre-tax, Pre- provision Earnings", this presentation may not be comparable to other similarly titled measures as calculated by other companies. |
| 3 Sound franchise with many opportunities for growth Profitable throughout cycle and growing tangible book value per share Diversified and growing revenue streams Stable asset quality and strong core deposit franchise Strong capital position and did not take TARP CPP Operational excellence and brand development Seasoned management team with knowledge of the Northeast Ohio marketplace Commenced trading on NASDAQ effective September 15, 2011 ("FMNB") Entered the Russell 3000, Russell 2000 and Russell MicroCap indices in June of 2012 Declared Special $0.03 per share cash dividend payable on February 28, 2012 to shareholders of record at February 13, 2012 Compelling valuation: 1.04x of tangible book value 8.1x LTM pre-tax pre-provision earnings Farmers offers a unique and strong platform for growth Investment Highlights 11.5x LTM EPS 1.93% dividend yield |
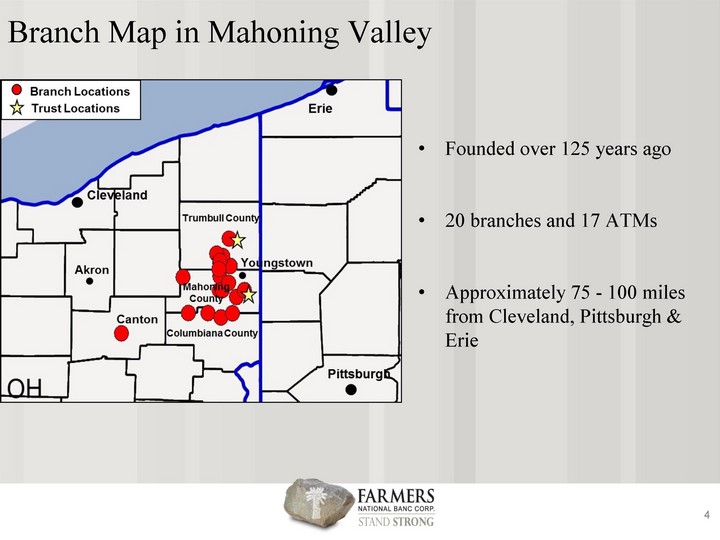
| 4 Founded over 125 years ago 20 branches and 17 ATMs Approximately 75 - 100 miles from Cleveland, Pittsburgh & Erie Branch Map in Mahoning Valley |
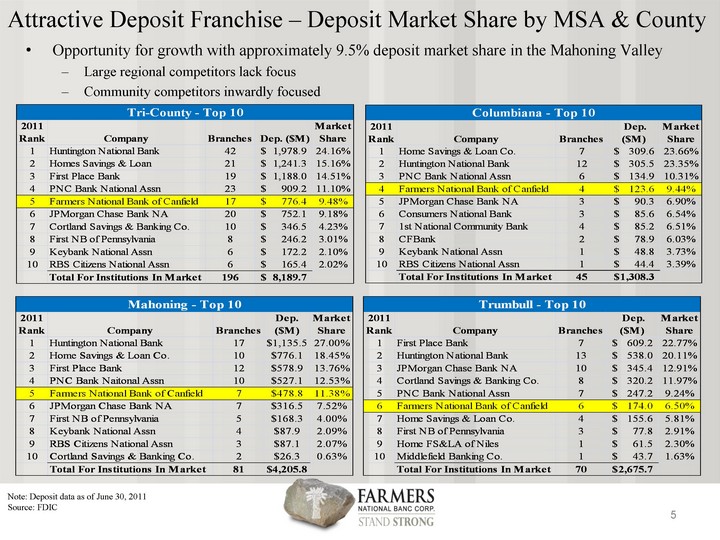
| 5 Note: Deposit data as of June 30, 2011 Source: FDIC Opportunity for growth with approximately 9.5% deposit market share in the Mahoning Valley Large regional competitors lack focus Community competitors inwardly focused Attractive Deposit Franchise - Deposit Market Share by MSA & County |
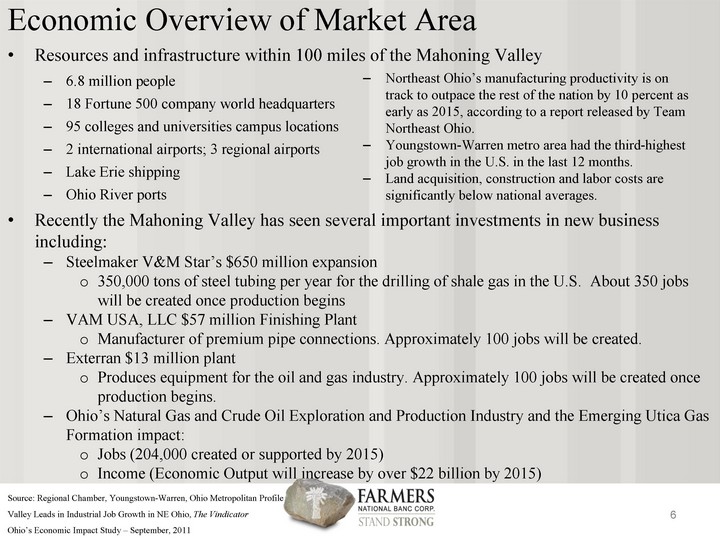
| 6 Source: Regional Chamber, Youngstown-Warren, Ohio Metropolitan Profile Valley Leads in Industrial Job Growth in NE Ohio, The Vindicator Ohio's Economic Impact Study - September, 2011 Resources and infrastructure within 100 miles of the Mahoning Valley Recently the Mahoning Valley has seen several important investments in new business including: Steelmaker V&M Star's $650 million expansion 350,000 tons of steel tubing per year for the drilling of shale gas in the U.S. About 350 jobs will be created once production begins VAM USA, LLC $57 million Finishing Plant Manufacturer of premium pipe connections. Approximately 100 jobs will be created. Exterran $13 million plant Produces equipment for the oil and gas industry. Approximately 100 jobs will be created once production begins. Ohio's Natural Gas and Crude Oil Exploration and Production Industry and the Emerging Utica Gas Formation impact: Jobs (204,000 created or supported by 2015) Income (Economic Output will increase by over $22 billion by 2015) Economic Overview of Market Area 6.8 million people 18 Fortune 500 company world headquarters 95 colleges and universities campus locations 2 international airports; 3 regional airports Lake Erie shipping Ohio River ports Northeast Ohio's manufacturing productivity is on track to outpace the rest of the nation by 10 percent as early as 2015, according to a report released by Team Northeast Ohio. Youngstown-Warren metro area had the third-highest job growth in the U.S. in the last 12 months. Land acquisition, construction and labor costs are significantly below national averages. |
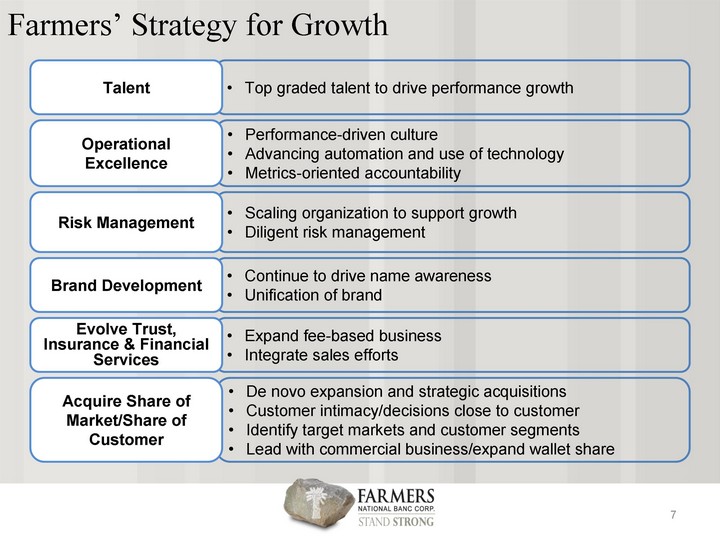
| 7 Performance-driven culture Advancing automation and use of technology Metrics-oriented accountability Scaling organization to support growth Diligent risk management Expand fee-based business Integrate sales efforts Continue to drive name awareness Unification of brand Top graded talent to drive performance growth De novo expansion and strategic acquisitions Customer intimacy/decisions close to customer Identify target markets and customer segments Lead with commercial business/expand wallet share Acquire Share of Market/Share of Customer Operational Excellence Risk Management Evolve Trust, Insurance & Financial Services Brand Development Talent Farmers' Strategy for Growth |
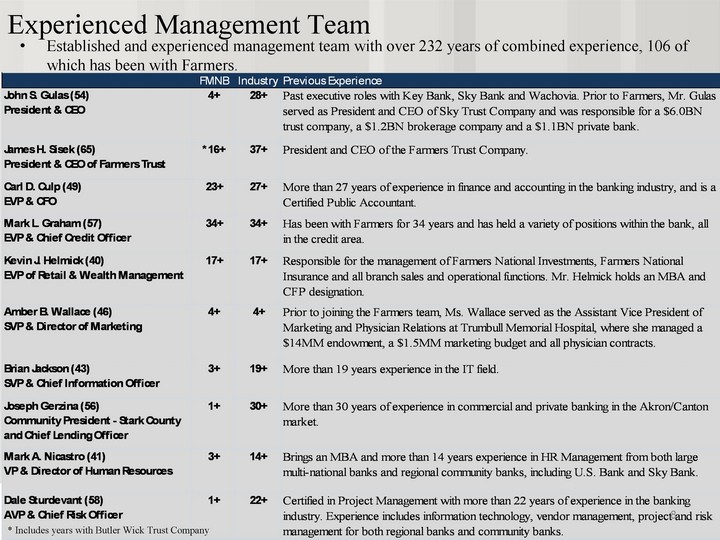
| 8 Established and experienced management team with over 232 years of combined experience, 106 of which has been with Farmers. Experienced Management Team * Includes years with Butler Wick Trust Company |
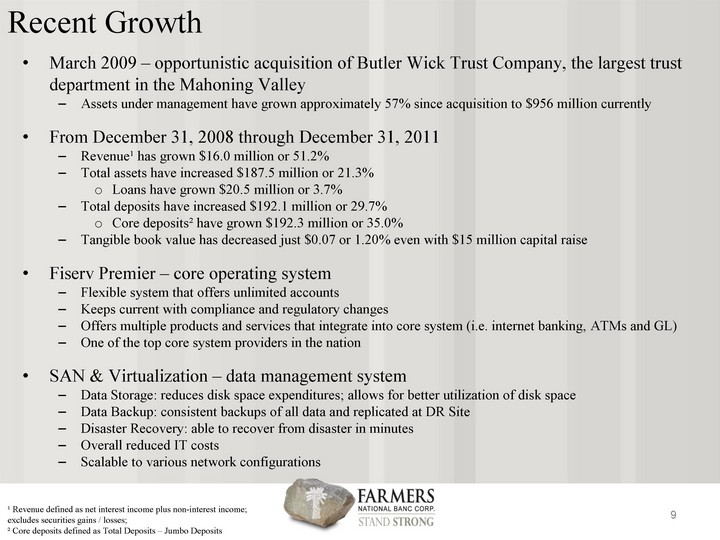
| 9 March 2009 - opportunistic acquisition of Butler Wick Trust Company, the largest trust department in the Mahoning Valley Assets under management have grown approximately 57% since acquisition to $956 million currently From December 31, 2008 through December 31, 2011 Revenue1 has grown $16.0 million or 51.2% Total assets have increased $187.5 million or 21.3% Loans have grown $20.5 million or 3.7% Total deposits have increased $192.1 million or 29.7% Core deposits2 have grown $192.3 million or 35.0% Tangible book value has decreased just $0.07 or 1.20% even with $15 million capital raise Fiserv Premier - core operating system Flexible system that offers unlimited accounts Keeps current with compliance and regulatory changes Offers multiple products and services that integrate into core system (i.e. internet banking, ATMs and GL) One of the top core system providers in the nation SAN & Virtualization - data management system Data Storage: reduces disk space expenditures; allows for better utilization of disk space Data Backup: consistent backups of all data and replicated at DR Site Disaster Recovery: able to recover from disaster in minutes Overall reduced IT costs Scalable to various network configurations 1 Revenue defined as net interest income plus non-interest income; excludes securities gains / losses; 2 Core deposits defined as Total Deposits - Jumbo Deposits Recent Growth |
| 10 Butler Wick Trust Company Acquisition Acquired from United Community Financial Corporation for cash on March 31, 2009 Only locally owned trust company in the Mahoning Valley Rebranded to Farmers Trust Company Assets increased approximately 57% since acquisition Contributed $5.4 million to non-interest income in 2011 Farmers Trust Company |
| 11 Meaningfully profitable every quarter during this cycle Always paid quarterly cash dividend Special one-time additional $0.03 cash dividend payable on February 28, 2012 to shareholders of record as of February 13, 2012 High net interest margin which has exceeded national banks1 peer average 3.85% June 30, 2012 Strong record of profitability Average ROAA and ROAE from 2007 through 2011 of 0.75% and 8.43%, respectively Continue to invest in operations to support ongoing growth, yet maintain a strong balance sheet Historical Operating Results 1 Selected Capital & Credit Quality Banks with Assets $800 Million - $2.0 Billion; No TARP; TCE / TA >= 7.0%; NPAs / Assets < 2.5% and Positive LTM Net Income Source: SNL Financial |
| 12 Improved Net Income and Strong Deposit Growth Net income for second quarter of 2012 increased 8% to $2.3 million from $2.1 million for the second quarter of 2011 118 consecutive quarters of positive earnings Deposits increased 15% from June 30, 2011 to June 30, 2012 Strong Capital Levels Tangible book value per share improved to $5.99 at June 30, 2012 from $5.45 at June 30, 2011 Stockholders' equity increased 10% from June 30, 2011 to June 30, 2012 Stable Asset Quality Provision for loan losses for the second quarter of 2012 decreased $675 thousand from the second quarter of 2011 Loans 30 - 89 days delinquent decreased to $2.8 million at June 30, 2012 from $3.8 million at June 30, 2011 Continued Strong Results - Overview of Q2 2012 |
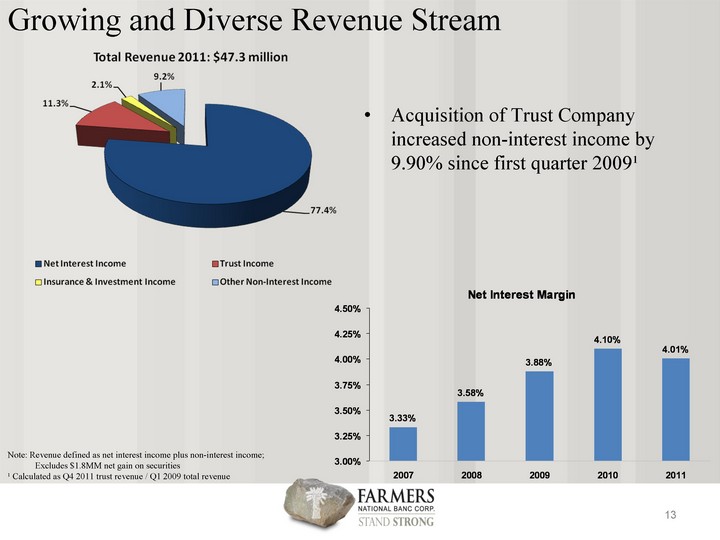
| 13 Acquisition of Trust Company increased non-interest income by 9.90% since first quarter 20091 Growing and Diverse Revenue Stream Note: Revenue defined as net interest income plus non-interest income; Excludes $1.8MM net gain on securities 1 Calculated as Q4 2011 trust revenue / Q1 2009 total revenue 2007 2008 2009 2010 2011 Net Interest Margin (GAAP) 3.33 3.58 3.88 4.1 4.01 |
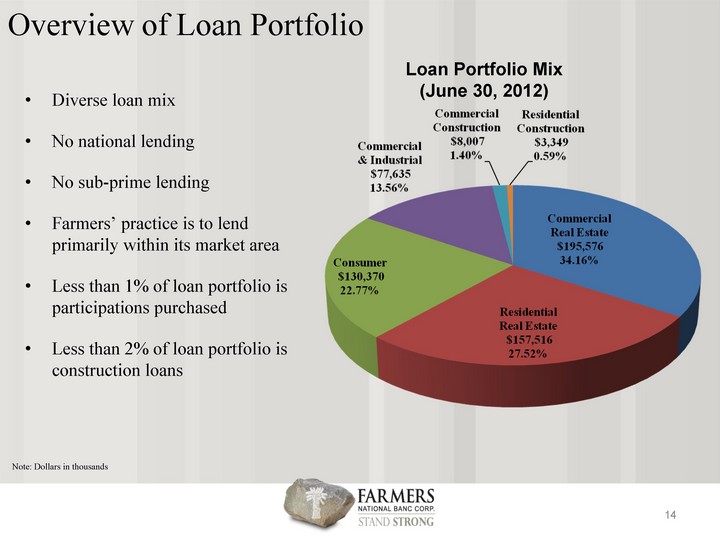
| 14 Diverse loan mix No national lending No sub-prime lending Farmers' practice is to lend primarily within its market area Less than 1% of loan portfolio is participations purchased Less than 2% of loan portfolio is construction loans Loan Portfolio Mix (June 30, 2012) Overview of Loan Portfolio Note: Dollars in thousands |
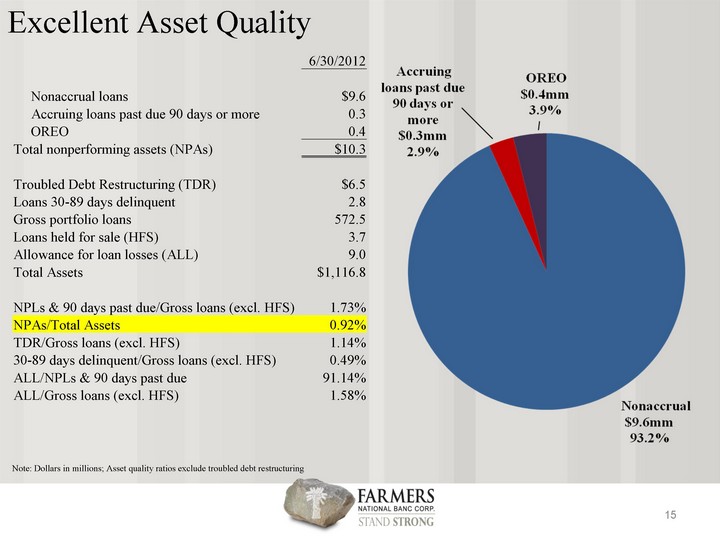
| 15 Excellent Asset Quality Note: Dollars in millions; Asset quality ratios exclude troubled debt restructuring 6/30/2012 Nonaccrual loans $9.6 Accruing loans past due 90 days or more 0.3 OREO 0.4 Total nonperforming assets (NPAs) $10.3 Troubled Debt Restructuring (TDR) $6.5 Loans 30-89 days delinquent 2.8 Gross portfolio loans 572.5 Loans held for sale (HFS) 3.7 Allowance for loan losses (ALL) 9.0 Total Assets $1,116.8 NPLs & 90 days past due/Gross loans (excl. HFS) 1.73% NPAs/Total Assets 0.92% TDR/Gross loans (excl. HFS) 1.14% 30-89 days delinquent/Gross loans (excl. HFS) 0.49% ALL/NPLs & 90 days past due 91.14% ALL/Gross loans (excl. HFS) 1.58% |
| 16 |