Attached files
| file | filename |
|---|---|
| 8-K - FORM 8-K - NAUTILUS, INC. | d418657d8k.htm |
 October
2012 Charting the Course
to Profitable Growth
Exhibit 99.1 |
 Safe Harbor
Statement This presentation includes forward-looking statements
(statements which are not historical facts) within the meaning of the Private
Securities Litigation Reform Act of 1995, including statements concerning the
Company's prospects, resources, capabilities, current or future financial
trends or operating results, demand for the Company's objectives, expectations, products, future plans for introduction
of new products and the anticipated outcome of new business initiatives. Factors
that could cause Nautilus, Inc.'s actual results to differ materially
from
these
forward-looking
statements
include
our
ability
to
acquire
inventory
from
sole
source
foreign
manufacturers
at
acceptable
costs,
within
timely
delivery
schedules
and
that
meet
our
quality
control
standards,
availability
and
price
of
media
time
consistent with our cost and audience profile parameters, a decline in consumer
spending due to unfavorable economic conditions in one or more of our
current or target markets, an adverse change in the availability of credit for our customers who finance their
purchases, our ability to pass along vendor raw material price increases and
increased shipping costs, our ability to effectively develop, market and
sell future products, our ability to protect our intellectual property, and the introduction of competing products. Additional
assumptions, risks and uncertainties are described in detail in our registration
statements, reports and other filings with the Securities and Exchange
Commission, including the "Risk Factors" set forth in our Annual Report on Form 10-K, as supplemented by our
quarterly reports on Form 10-Q. Such filings are available on our website or at
www.sec.gov. You are cautioned that such statements are
not
guarantees
of
future
performance
and
that
actual
results
or
developments
may
differ
materially
from
those
set
forth
in
the
forward-looking statements. We undertake no obligation to publicly update or
revise forward-looking statements to reflect subsequent events or
circumstances. Unless otherwise indicated, all information regarding our
operating results pertain to continuing operations. 2
|
 Plans and strategies are in place to deliver…
Nautilus Fall 2012 Update -
Highlights
•
The Business has been successfully transformed into a simplified, much
more focused and profitable, growth oriented model
•
Significant momentum on key initiatives which began last year are starting
to pay dividends
•
Stepped up new product development efforts are getting traction
Pipeline of new launches starting Q3 2012 through 2013
•
Operating expense controls and leverage potential are evident
First half operating ratio was 42.7% of sales versus 45.2% last year
•
Balance sheet is well positioned to support business growth
All remaining debt paid off in March 2012
Cash balance at $16.1M as of June 2012
3
growth
above the industry average
profitability
in
line
with
top
consumer
durables
companies |
 Nautilus Fall
2012 Update Recent Financial Performance Improvement
Recent Business Initiative Results
Objectives and Strategies for the Future
Themes of Execution
Summary
Other Background Information
Nautilus Business Profile
Historical Perspective
4 |
 Business Model
Transformation Complex
Lack of Focus
Significant Infrastructure
Globally
Years of Financial Losses
Weak Balance Sheet
Simplified
Focused on Home Use
Markets
Lean Operations
Strong Balance Sheet
2007
2007
2012
2012
5
Remain Simplified; but with
stepped up product innovation
and brand utilization
Remain Focused; but with more
diversified product lines
Continue; but with even greater
leverage
of
current
infrastructure
Continue; building towards
higher operating margin
Maintain and Build; utilize to
improve shareholder value
GOAL
GOAL
Profitable and Positioned
for Further Improvement |
 Recent Financial
Performance Improvement * Remaining debt was paid off in March 2012 ($5.5M)
6
METRIC
YOY First Half 2012
Last Twelve Months -
Q2 2012
•
Revenue
Growth
increased
–
Direct
–
Retail
+ 9.4%
+ 10.9%
+ 8.1%
+ 7.4%
+ 10.1%
+ 3.6%
•
Gross Margin
Direct
Retail
+ 110 bps
+ 230 bps
-
100
bps
+ 10 bps
+ 150 bps
-
310 bps
•
Operating
Expense
ratio
Improved
45.2% to 42.7%
44.9% to 40.5%
•
June Cash net of debt
improved
$16.1M vs
$9.6M Last
Year
*
---
•
Income from Continuing Operations
increased
Loss of $1.1M to gain of
$2.2M
Loss of $1.5M to gain of $5.7M
improved |
 Operating Income
Progress Continuing Operations Only
*2012 LTM results shown are for the last twelve month’s actual performance which includes
July 2011 through June 2012 Results of Restructuring
and Focus on Consumer
Market
7
-25.00%
-20.00%
-15.00%
-10.00%
-5.00%
0.00%
5.00%
2008
2009
2010
2011
2012 LTM*
Operating Income / Loss
(% of Net Revenue) |
 Operating Income
Progress Continuing Operations -
Quarterly results are unaudited
8
Operating Income / Loss by Quarter
-$5.0
-$4.0
-$3.0
-$2.0
-$1.0
$0.0
$1.0
$2.0
$3.0
$4.0
'09
'10
'11
'12
-16.0
-14.0
-12.0
-10.0
-8.0
-6.0
-4.0
-2.0
0.0
'09
'10
'11
'12
-3.5
-3.0
-2.5
-2.0
-1.5
-1.0
-0.5
0.0
'09
'10
'11
-10.0
-8.0
-6.0
-4.0
-2.0
0.0
2.0
4.0
6.0
'09
'10
Q4
Q3
Q2
Q1
'11 |
 Recent Business
Initiative Results – Significant Momentum
•
Top line growth and margin improvement from new products
New line of TCs, CBR, Retail items introduced in 2011 / 2012
•
Milestone consumer and brand research study completed
Setting brand strategy; improved product positioning
Filtering and better targeting of new products
Focus licensing opportunities
•
Increased new product development resources have been put in place
Advanced Development Group created
New disciplines to enhance product innovation
•
New product pipeline filling for 2013 and beyond
Back
half
2012
planned
launches
include
DVD
program,
more
Retail
items,
digital
caloric
tracking device
•
Secured back half 2012 price increases to help mitigate product cost pressures
•
Significantly advanced diversification of supply base and negotiated more
favorable payment terms
First Half 2012
9 |
 Recent
Business
Initiative
Results
(cont.)
•
Placements secured with new Retail customers
•
Cost improvement initiatives being institutionalized
Focus on products, processes, and services
•
Remaining debt was paid off in March ($5.5M)
•
Organizational progress:
New CFO (Linda Pearce) joined in August this year
Significant talent added throughout R&D
Move to lower cost office completed in August
Redesigned incentive plan for better alignment with performance to long term goals
First Half 2012
Significant momentum on key initiatives begun last year
and we are beginning to harvest gains from those efforts
10 |
 New Product
Development Progress – Stepped up pace
•
In
2012
we
have
launched
several
new
products
(many
shown
below)
with
more
on the way:
Coming in Q4:
DVD Workout Program
and a Digital Caloric Tracking Device
Schwinn AD6 Airdyne
Bowflex 445 Dumbbells
Schwinn A40 and 425 Elliptical
Schwinn 520 Recumbent Elliptical
CoreBody Reformer
Creative Refresh
11 |
 Brand Research
Findings – Significant Opportunity
•
In early 2012 we
engaged in a large
nationwide survey of
attitudes and
behaviors toward
fitness across all
geographic, age,
gender, and income
demographics
•
We confirmed that
we hold industry
leading brands, and
also gained valuable
insights into
consumer attitudes
toward modalities,
desired goals, and
shopping
preferences
1,500+ respondents
maintaining journals of
activity and answering
questions regarding
fitness equipment
modalities and brands
12
1,500+ respondents
maintaining journals of
activity and answering
questions regarding
fitness equipment
modalities and brands
Bowflex ranks #1 in
awareness
Nautilus and Schwinn also
rank near top of awareness
Universal is untapped
opportunity
All brands ranked at the top
of the industry for quality,
durability, and company
reputation
Bowflex: Innovative, Quick
and Proven Results
Nautilus: Serious Fitness
Schwinn: Quality Cardio
Differentiated brands allow
greater market flexibility
Unique consumer segments
•
•
•
•
•
•
•
•
•
and product opportunities for
each brand
Roadmap established to drive
licensing direction
•
Recognized
Brands
Desired
Attributes
Market
Opportunities |
 Objectives and
Strategies – Getting to the Goal
STRATEGIES/METRICS
How we grow and compete
Added core competencies
How we do what we do
The scorecard
13
KEY
ELEMENTS
Business Strategies
Operational Capabilities
Organizational
Financials
Plans to achieve the desired business profile
are being implemented
OUR
EXPECTATIONS
FOR
THE
FUTURE |
 Business
Strategy for the Future –
Ideal State
•
New products focus / diversified product line offering
Expanded cardio and alternative fitness
Stabilized and growing strength business
•
Brands further developed via internal marketing and licensing
•
Expanded International sales; growth on a paced, low risk basis
Represents <1% today
•
Expanded Licensing opportunities to extend brand building and increase
royalty stream
•
Further built-in resilience to consumer credit environment via product
diversification
•
Maximized shareholder return including optimal use of cash
•
Achieved desired level of Organizational Excellence
Culture of improvement, innovation, and execution
14 |
 Targeted
Financial Objectives – Potential for the Future
•
Revenue growth pace approximating 9% / year for both Retail and Direct
Direct: Keeping current pace a low double digit / year
Retail: Slower start but achieving 8-9 % / year as we continue to execute and the
consumer spending environment improves
•
Gross margin improvement of 3-4% points
Retail:
Turnaround
trend
expected
to
begin
second
half
2012
and
build
from
there
over
the
longer
term
Direct: Further modest gains possible
•
Operating expense: Greater leverage is possible 1-3% points
S&M investment for new product launches is mostly scalable
Gradual continued R&D investment
Investment in brand development
Operating income range approximating 7-10% (versus 2% in 2011) *
* Excludes oppty’s / changes in licensing royalty stream
15
Although we are not yet positioned to identify precise timeframes for achievement
of our objectives, we believe that with continued execution of our
strategy we can deliver long term financial performance in-line with
top performing peers |
 Levers to
Generate Growth and Increased Profitability Unique
Multi-Channel
Business Model
Capabilities
Cost
Opportunities in
Supply Chain
Strongest Brands
in the Industry
(Including #1)
Balance Sheet
Provides
Flexibility
for Growth
Re-invigorated New
Product Development and
Diversification
Strong
Company
Culture
Overhead
Structure is Highly
Leverage-able
Very Efficient
Working Capital
Model
Significant
Licensing
Royalty
Stream
Low Market
Share in Retail
Un-penetrated
International
Markets
16 |
 Revenue
Growth
Margin
Improvements
Operating
Expense
New Product Pipeline
(more, and more diverse)
Brand Leverage
Increased Retail Share
International
Increased Licensing
Supply Chain Efficiencies
Cost Improvements
Leveraging Overhead Structure
Marketing and Media Efficiency
Strong Company Culture
(continuous improvement)
Generating Long Term EPS Growth
17 |
 •
Deliver short term improvements while building for the future
–
Build in sustainable improvements
•
Exploit
our
competitive
advantages
in
brands,
product
quality
and
innovation,
marketing
expertise,
and
customer
loyalty
•
Diagnose, plan, deploy, and course correct when necessary
–
Create culture of optimization and search out opportunities
•
Tight controls on operating expense and working capital
Themes of Execution
18
These underlying themes of execution will enable us to
advance our initiatives with pace |
 Summary
•
We have built a strong foundation for execution of our strategies to achieve
the ideal state and to realize the potential in the business
•
Management team is focused on key strategies and initiatives to deliver the
mid-term financial objectives
•
Additional
underpinnings
to
support
our
longer
term
strategy
for
growth
are
being implemented in 2012 / 2013
Product development and diversification
Brand development and penetration, including licensing
Cost structure and operational capabilities
Organizational Excellence
•
Always mindful of return to shareholders via EPS growth and capital
allocation
19
The potential is there, the plan is clear, the trajectory is good
|
 Summary
– Long Term EPS Growth Potential
20
Strong EPS growth / year
Operating Expense Leverage 1-3 pts lower
Gross Margin Improvement 3-4 pts higher
Revenue Growth –
Sustaining 9-10% / year
Operating Income @ 7-10% and increasing at double digit pace
+
Cash generation
We are focused on delivering value to our shareholders through sustained EPS
growth. By executing our strategies, we expect to deliver strong EPS
growth over the long term. |
 Nautilus
Business Profile Historical Perspective
21 |
 Nautilus Cardio
Product Lines TreadClimber by Bowflex
Schwinn Fitness
Nautilus
CoreBody Reformer
22 |
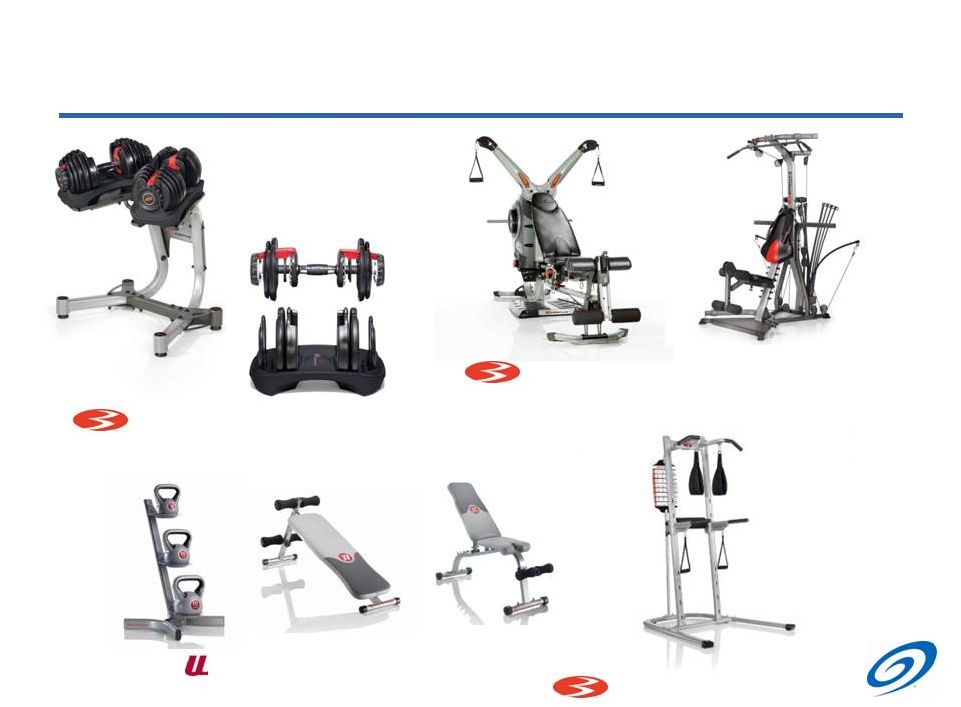 Nautilus
Strength Product Lines Bowflex / Nautilus
SelectTech Dumbbells
Bowflex Revolution and Rod Based
Home Gyms
Universal Strength Accessories
Bowflex BodyTower
23 |
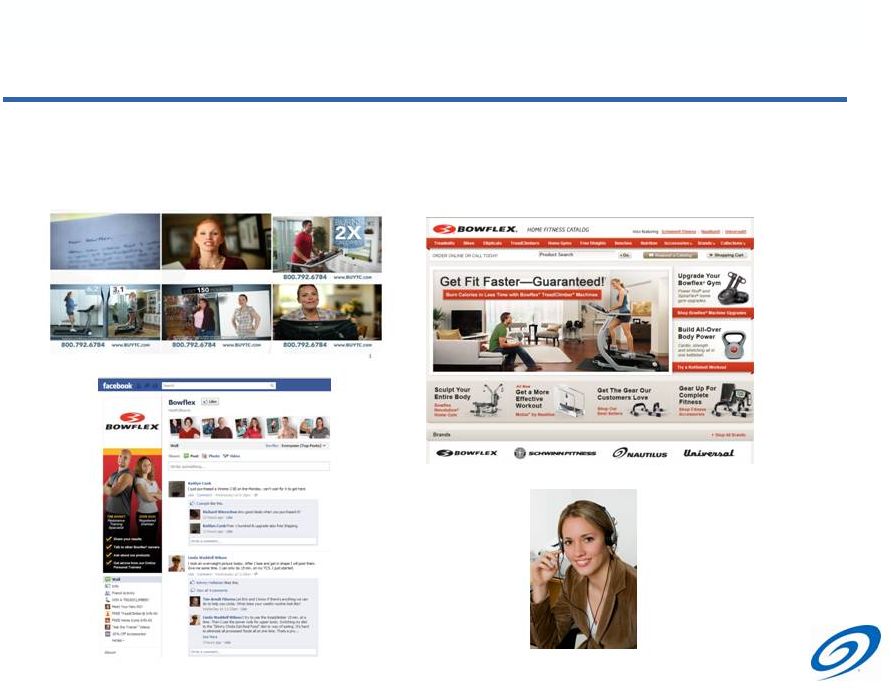 •
Direct to Consumer
–
Our direct to consumer business utilizes television and online advertising, in
addition to social media, to drive sales via our websites and call center
Consumer Reach -
Direct
24 |
 Consumer Reach
– Retail
•
Retail
–
Distributes products via multiple third-party retailers located in the US and
Canada, as well as through leading e-commerce sites such as Amazon.com
25 |
 Nautilus
History •
Revenues peaked at $ 680M* in 2006, however profitability was eroding, cash dwindling
and debt was rising
•
Economic downturn in 2008 / 2009 negatively affected consumer discretionary purchases
•
Commercial and Pearl Izumi businesses divested in 2008 / 2009 and largely eliminated
debt while shoring up the balance sheet
•
Restructured in 2009-2010 to focus on the consumer market
Direct to consumer via TV / Internet
Retail via both traditional store placement and leading e-commerce sites
*Includes income from discontinued and continuing operations
26
1986:
Founded as
Bowflex of
America
1993:
DRTV
marketing
begins
1999:
Acquired
Nautilus Inc -
expansion
into
commercial
clubs
2001:
Acquired
Schwinn Fitness
and entered
retail market
2005:
Acquired
Pearl iZumi
with plans to
expand into
fitness apparel
market
2006:
Peak
revenues
as sales
exceed
$600M
2008:
Sold Pearl
iZumi
business
2009:
Divested
commercial
brands via sale
and licensing
agreements
2010:
Restructured
to focus on
consumer
markets
2011:
Achieved
annual
profitability for
first time since
2006 |
 Revenue and
Income from both Discontinued and Continuing Operations *2012 LTM results shown are for
the last twelve month’s actual performance which includes July 2011 through June 2012
27
Net Income Progress
($100)
($80)
($60)
($40)
($20)
$0
$20
$40
$0
$100
$200
$300
$400
$500
$600
$700
$800
2005
2006
2007
2008
2009
2010
2011
2012 LTM*
Net Revenue
Net Income / (Loss)
$631
$680
$569
$439
$264
$181
$181
$188
$23
$29
($56)
($91)
($53)
($23)
$1
$5
Revenue and Net Income
($ Millions) |
  |