Attached files
| file | filename |
|---|---|
| 8-K - FORM 8-K - Edgen Group Inc. | d419270d8k.htm |
Exhibit 99.1
The following tables present certain summary historical financial information and other data of Edgen Group Inc. (“Edgen Group” or “we” or “our”) for each of the years ended December 31, 2011, 2010 and 2009, the six months ended June 30, 2012 and 2011 and the twelve months ended June 30, 2012. The summary historical statement of operations and other financial data for the years ended December 31, 2011, 2010 and 2009 and the summary historical consolidated balance sheet data at December 31, 2011 and 2010 are derived from Edgen Group’s audited combined consolidated financial statements. The summary historical consolidated statement of operations and other financial data for the six months ended June 30, 2012 and 2011 are derived from Edgen Group’s unaudited consolidated/combined consolidated financial statements. The summary historical consolidated statement of operations and other financial data and balance sheet data for and at the twelve months ended June 30, 2012 are derived from Edgen Group’s audited combined consolidated financial statements for the year ended December 31, 2011 and Edgen Group’s unaudited consolidated/combined consolidated financial statements for the six months ended June 30, 2012. The summary historical consolidated balance sheet data at December 31, 2009 are derived from the audited consolidated financial statements of Edgen Group’s accounting predecessor, Edgen Murray II, L.P. All information presented in the tables below is in thousands, except for per share data.
Basis of Financial Statement Presentation
Edgen Group did not own any assets prior to its initial public offering (“IPO”) and corporate reorganization completed in connection with the IPO (the “Reorganization”). As required by GAAP for common control transactions, all assets and liabilities transferred to us as part of the Reorganization were recorded in our financial statements at carryover basis.
For periods prior to the IPO and the Reorganization, the combined consolidated financial information presented below reflects the Reorganization as if it had occurred on July 19, 2010, the date that Edgen Murray II, L.P. and Bourland &Leverich Holdings LLC, the former owner of the business of Bourland & Leverich Supply Co. LLC (collectively, the “Predecessor”) came under the common control of affiliates of Jefferies Capital Partners. As such, the periods prior to the IPO reflect the combined assets, liabilities and operations of the historical businesses of the Predecessor. Because a single direct owner relationship did not exist among the owners of the Predecessor, the net deficit of the Predecessor is shown in lieu of partners’ or shareholders’ deficit for periods prior to the IPO.
For periods subsequent to the IPO and the Reorganization, the consolidated financial information presented below includes our accounts and those of our majority-owned subsidiaries in which we have a controlling interest, after the elimination of intercompany accounts and transactions. We also consolidate other entities in which we possess a controlling financial interest or in which we have the power to direct the activities that most significantly affect the entities’ performance. Specifically, we only own 42% of the total equity interests of EDG Holdco LLC (“EDG LLC”), an intermediate holding company through which the equity interests of our operating subsidiaries are owned. However, because we control 100% of the voting power of EDG LLC, and indirectly the operating companies EDG LLC owns, the results of operations of such operating companies are reflected in our consolidated financial information.
| Twelve | ||||||||||||||||||||||||
| Months | ||||||||||||||||||||||||
| Years ended December 31, | Six months ended June 30, | Ended June | ||||||||||||||||||||||
| (in thousands) | 2009 | 2010 | 2011 | 2011 | 2012 | 30, 2012 | ||||||||||||||||||
| Statements of Operations: |
||||||||||||||||||||||||
| Sales |
$ | 773,323 | $ | 866,328 | $ | 1,675,209 | $ | 742,116 | $ | 1,002,329 | $ | 1,935,422 | ||||||||||||
| Gross profit (exclusive of deprecation and amortization) |
100,728 | 118,007 | 210,941 | 97,468 | 117,076 | 230,549 | ||||||||||||||||||
| Income (loss) from operations |
9,899 | (42,636 | ) | 84,364 | 37,764 | 49,517 | 96,117 | |||||||||||||||||
| Net income (loss) |
(20,889 | ) | (92,824 | ) | (4,226 | ) | (6,357 | ) | (9,722 | ) | (7,591 | ) | ||||||||||||
| Other Financial Data: |
||||||||||||||||||||||||
| EBITDA |
$ | 23,959 | $ | (16,742 | ) | $ | 121,953 | $ | 57,398 | $ | 49,109 | $ | 113,664 | |||||||||||
| Adjusted EBITDA |
72,011 | 47,402 | 125,490 | 58,660 | 70,519 | 137,349 | ||||||||||||||||||
| December 31, | June 30, | |||||||||||||||
| 2009 | 2010 | 2011 | 2012 | |||||||||||||
| Balance Sheet Data: |
||||||||||||||||
| Cash and cash equivalents |
$ | 65,733 | $ | 62,864 | $ | 26,269 | $ | 25,399 | ||||||||
| Working capital |
262,745 | 310,840 | 329,309 | 436,097 | ||||||||||||
| Property, plant and equipment-net |
43,342 | 50,382 | 46,647 | 45,816 | ||||||||||||
| Total assets |
563,460 | 785,379 | 900,740 | 962,774 | ||||||||||||
| Long term debt and capital leases |
483,503 | 682,639 | 683,845 | 614,810 | ||||||||||||
| Twelve | ||||||||||||||||||||||||
| Months | ||||||||||||||||||||||||
| Years ended December 31, | Six months ended June 30, | Ended June | ||||||||||||||||||||||
| 2009 | 2010 | 2011 | 2011 | 2012 | 30, 2012 | |||||||||||||||||||
| Reconciliation of GAAP net income (loss) to non-GAAP EBITDA and non-GAAP Adjusted EBITDA |
||||||||||||||||||||||||
| NET INCOME (LOSS) |
$ | (20,889 | ) | $ | (92,824 | ) | $ | (4,226 | ) | $ | (6,357 | ) | $ | (9,722 | ) | $ | (7,591 | ) | ||||||
| Income tax expense |
(22,373 | ) | (22,125 | ) | 4,088 | 2,122 | 1,139 | 3,105 | ||||||||||||||||
| Interest expense—net |
47,085 | 72,664 | 86,480 | 43,785 | 41,567 | 84,262 | ||||||||||||||||||
| Depreciation and amortization expense |
20,136 | 25,543 | 35,611 | 17,848 | 16,125 | 33,888 | ||||||||||||||||||
|
|
|
|
|
|
|
|
|
|
|
|
|
|||||||||||||
| EBITDA |
23,959 | (16,742 | ) | 121,953 | 57,398 | 49,109 | 113,664 | |||||||||||||||||
| Strategic inventory liquidation (1) |
12,656 | — | — | — | — | — | ||||||||||||||||||
| Lower of cost or market adjustments to inventory (2) |
22,469 | — | — | — | — | — | ||||||||||||||||||
| Transaction costs (3) |
3,339 | — | 905 | — | — | 905 | ||||||||||||||||||
| Loss on prepayment of debt (4) |
7,523 | — | — | — | 17,005 | 17,005 | ||||||||||||||||||
| Impairment of goodwill (5) |
— | 62,805 | — | — | — | — | ||||||||||||||||||
| Equity based compensation (6) |
2,065 | 1,339 | 2,632 | 1,262 | 4,405 | 5,775 | ||||||||||||||||||
|
|
|
|
|
|
|
|
|
|
|
|
|
|||||||||||||
| ADJUSTED EBITDA |
$ | 72,011 | $ | 47,402 | $ | 125,490 | $ | 58,660 | $ | 70,519 | $ | 137,349 | ||||||||||||
|
|
|
|
|
|
|
|
|
|
|
|
|
|||||||||||||
| (1) | Includes a loss of $12.7 million recorded in 2009 due to strategic inventory liquidation (at prices below cost) of inventory primarily related to products for the North American midstream oil and natural gas market. |
| (2) | Includes an inventory write-down of $22.5 million in 2009 related to selling prices falling below our average cost of inventory in some of our markets. |
| (3) | Includes costs of $0.9 million in 2011 associated with the IPO that were not able to be capitalized under GAAP and $3.3 million in 2009 of accumulated registration costs expensed during the year. |
| (4) | Includes costs of $17.0 million and $7.5 million representing prepayment penalties and the write off of deferred debt issuance costs and unamortized discount associated with certain indebtedness repaid in 2012 and 2009, respectively. |
| (5) | Includes a goodwill impairment charge of $62.8 million recorded in 2010 as a result of the fair value of certain of our reporting units falling below the carrying value. |
| (6) | Includes non-cash compensation expense related to the issuance of equity-based awards. |
LTM 6/30/12 Pro Forma Credit Statistics
| Adjusted EBITDA |
$ | 137.3 | ||
| Capital Expenditures |
(2.4 | ) | ||
|
|
|
|||
| Unlevered Free Cash Flow (1) |
$ | 134.9 | ||
| (1) | Unlevered free cash flow is defined as Adjusted EBITDA less Capital Expenditures. |
| Year Ended | 6 Months Ended | LTM | ||||||||||||||||||||||
| December 31, | June 30, | June 30, | ||||||||||||||||||||||
| 2009 | 2010 | 2011 | 2011 | 2012 | 2012 | |||||||||||||||||||
| Adjusted EBITDA |
$ | 72,011 | $ | 47,402 | $ | 125,490 | $ | 58,660 | $ | 70,519 | $ | 137,349 | ||||||||||||
| Less: CapEx exexpenditures |
(4,140 | ) | (14,038 | ) | (2,998 | ) | (2,614 | ) | (2,031 | ) | (2,415 | ) | ||||||||||||
|
|
|
|
|
|
|
|
|
|
|
|
|
|||||||||||||
| Unlevered Free Cash Flow |
$ | 67,871 | $ | 33,364 | $ | 122,492 | $ | 56,046 | $ | 68,488 | $ | 134,934 | ||||||||||||
|
|
|
|
|
|
|
|
|
|
|
|
|
|||||||||||||
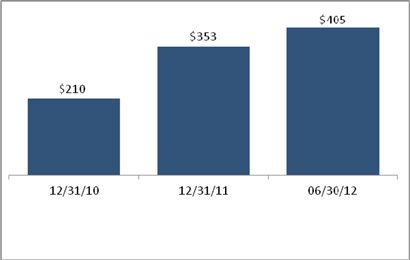
Backlog - E&I Segment (SMM)
Use of Non-GAAP Financial Measures
We use EBITDA and Adjusted EBITDA in our business operations to, among other things, evaluate the performance of our operating segments, develop budgets and measure our performance against those budgets, determine employee bonuses and evaluate our cash flows in terms of cash needs. We find these measures to be useful tools to assist us in evaluating financial performance because they eliminate items related to capital structure, taxes and certain non-cash charges. These Non-GAAP measures, as calculated by us, are not necessarily comparable to similarly titled measures reported by other companies. Additionally, these Non-GAAP measures have material limitations as analytical tools, are not a measure of financial performance or liquidity under GAAP and should not be considered in isolation or as an alternative to or superior to GAAP measures such as net income, operating income, net cash flow provided by operating activities or any other measure of financial performance or liquidity calculated and presented in accordance with GAAP. We define EBITDA as net income or loss, plus net interest expense, provision for income taxes and depreciation and amortization expense. We define Adjusted EBITDA as EBITDA plus transaction costs, strategic inventory liquidation sales and inventory lower of cost or market adjustments, loss on prepayment of debt, impairment of goodwill and equity based compensation. EBITDA and Adjusted EBITDA are commonly used as supplemental financial measures by management and external users of our financial statements, such as investors, commercial banks, research analysts and rating agencies, to assess: (1) our financial performance without regard to financing methods or capital structures; and (2) our ability to generate cash sufficient to pay interest and support our indebtedness. The table set forth above provides reconciliations of EBITDA and Adjusted EBITDA to net income (loss), the most directly comparable financial measure calculated and presented in accordance with GAAP.
We define free cash flow as Adjusted EBITDA less capital expenditures Free cash flow is not defined by GAAP. We believe free cash flow to be relevant and useful information to our investors because it provides them with additional information in assessing our liquidity, capital resources and financial operating results. Our management uses free cash flow in evaluating our liquidity, our ability to service debt and our ability to fund capital additions. However, free cash flow has certain limitations, including that it does not represent the residual cash flow available for discretionary expenditures since other, non-discretionary expenditures, such as mandatory debt service, are not deducted from the measure. The amount of mandatory versus discretionary expenditures can vary significantly between periods. This measure should be considered in addition to, and not as a substitute for, or superior to, other measures of liquidity or financial performance prepared in accordance with GAAP, such as net cash provided by operating activities. Furthermore, our definition of free cash flow may not be comparable to similarly titled measures reported by other companies.