Attached files
| file | filename |
|---|---|
| EX-3.3 - EXHIBIT 3.3 - Oxford City Football Club, Inc. | ex3_3.htm |
| EX-31.1 - EX31.1 - Oxford City Football Club, Inc. | ex31_1.htm |
| EX-31.2 - EX31.2 - Oxford City Football Club, Inc. | ex31_2.htm |
| EX-32.1 - EX32.1 - Oxford City Football Club, Inc. | ex32_1.htm |
| EXCEL - IDEA: XBRL DOCUMENT - Oxford City Football Club, Inc. | Financial_Report.xls |
UNITED STATES
SECURITIES AND EXCHANGE COMMISSION
WASHINGTON, D.C. 20549
FORM 10-K
| [X] | ANNUAL REPORT UNDER SECTION 13 OR 15(d) OF THE SECURITIES EXCHANGE ACT OF 1934 |
| For the fiscal year ended June 30, 2012 | |
| [ ] | TRANSITION REPORT UNDER SECTION 13 OR 15(d) OF THE SECURITIES EXCHANGE ACT OF 1934 |
| For the transition period from _________ to ________ | |
| Commission file number: 000-54434 |
| WMX Group Holdings, Inc. | |
| (Exact name of registrant as specified in its charter) | |
| Florida | 05-0554762 |
| (State or other jurisdiction of incorporation or organization) | (I.R.S. Employer Identification No.) |
301 Yamato Road, Suite 1240 Boca Raton Florida |
33431 |
| (Address of principal executive offices) | (Zip Code) |
Registrant’s telephone number: 617.501.6766 | |
__________________________________________________ (Former name and former address, if changed since last Report) | |
Securities registered under Section 12(b) of the Exchange Act:
| |
| Title of each class | Name of each exchange on which registered |
| none | not applicable |
Securities registered under Section 12(g) of the Exchange Act:
| |
| Title of class | |
| Common Stock, par value of $0.0001 | |
Indicate by check mark if the registrant is a well-known seasoned issuer, as defined in Rule 405 of the Securities Act. Yes [ ] No [X]
Indicate by check mark if the registrant is not required to file reports pursuant to Section 13 or Section 15(d) of the Act. Yes [ ] No [X]
Indicate by checkmark whether the registrant (1) has filed all reports required to be filed by Section 13 or 15(d) of the Securities Exchange Act of 1934 during the preceding 12 months (or for such shorter period that the registrant was required to file such reports), and (2) has been subject to such filing requirements for the past 90 days. Yes [X] No [ ]
Indicate by check mark whether the registrant has submitted electronically and posted on its corporate Web site, if any, every Interactive Data File required to be submitted and posted pursuant to Rule 405 of Regulation S-T (§ 232.405 of this chapter) during the preceding 12 months (or for such shorter period that the registrant was required to submit and post such files). Yes [X] No [ ]
Indicate by check mark if disclosure of delinquent filers pursuant to Item 405 of Regulation S-K (§ 229.405 of this chapter) is not contained herein, and will not be contained, to the best of registrant’s knowledge, in definitive proxy or information statements incorporated by reference in Part III of this Form 10-K or any amendment to this Form 10-K. [ ]
Indicate by check mark whether the registrant is a large accelerated filer, an accelerated filer, a non-accelerated filer, or a smaller reporting company.
| [ ] Large accelerated filer | [ ] Accelerated filer |
| [ ] Non-accelerated filer | [X] Smaller reporting company |
Indicate by check mark whether the registrant is a shell company (as defined in Rule 12b-2 of the Exchange Act). Yes [ ] No [X]
State the aggregate market value of the voting and non-voting common equity held by non-affiliates computed by reference to the price at which the common equity was last sold, or the average bid and asked price of such common equity, as of the last business day of the registrant’s most recently completed second fiscal quarter. $115,250
Indicate the number of shares outstanding of each of the registrant’s classes of common stock, as of the latest practicable date. 1,371,336,466 as of September 28, 2012.
| 1 |

| 2 |
PART I
WMX’s Business
WMX Group Holdings, Inc., (the "Company" or "WMX") was incorporated on February 11, 2003 in the State of Florida as Smart Kids Group, Inc. On June 11, 2012, the Company changed its name from Smart Kids Group, Inc. to WMX Holdings Group, Inc.
On April 30, 2012, the Company entered into an Agreement and Plan of Merger (the “Merger Agreement”) with WMX Group, Inc., a Nevada corporation ("WMX Private Co."), and SKGI Acquisition Corp., Nevada corporation, and a wholly-owned subsidiary of the Company (“Acquisition Sub”), pursuant to which Acquisition Sub merged with and into WMX Private Co. (the “Merger”) with the filing of the Articles of Merger with the Nevada Secretary of State on May 1, 2012 and became a wholly-owned subsidiary of the Company. In accordance with the terms of the Merger Agreement, at the closing an aggregate of 105,384,609 shares of the Company’s common stock was issued to the holders of WMX Private Co.’s common stock in exchange for their shares of WMX Private Co. WMX Private Co. was incorporated on January 18, 2011 in the Province of New Brunswick, Canada as World Mercantile Exchange, Ltd. and subsequently changed its name to WMX, Group, Inc. and re-domiciled to the State of Nevada.
The Merger has been accounted for as a reverse acquisition transaction for accounting purposes as WMX Private Co. was deemed to be the acquirer, and thus, these consolidated financial statements are the historical financial information and operating results of WMX Private Co. The carrying amounts of the Company’s assets and liabilities prior to the Merger (Smart Kids Group, Inc.) are included in these consolidated financial statements.
WMX is a diversified holding company with several divisions:
WMX Trade Division (www.wmxtrade.com)

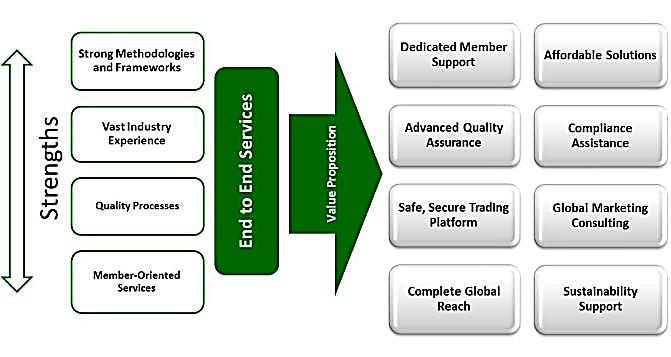
WMX Trade offers a proprietary trading platform for the buying and selling of real products on their website in several market segments across the globe. World Mercantile Exchange is trademarked both domestically in the US and around the world. WMX also owns the proprietary trademark rights to: World Commodity Exchange, World Precious Metals Exchange, and World Livestock Exchange. In other words, WMX is introducing a new method of trade where buyers and sellers across the globe use WMX to facilitate the exchange of real products. In order to ensure the utmost safety and security compliance, WMX provides the most comprehensive third party screening process for members making it one of the safest and most secure websites to transact business in the world. In addition to the technology and screening process, WMX offers customer service for its WMX Members and professional support, global marketing consulting, global reach, ISO compliance, and eco-friendly sustainability.
| 3 |
WEX TELECOM Division (www.WEXTELECOM.com)

WEX TELECOM is dedicated to building long term relationships by providing flexible outsourced contact center solutions that add maximum value to our clients around the world.
As a division of a public company, WMX Group Holdings, Inc. we have a level
of expertise and expectations that has been the catalyst in us becoming one of the top service providers in the world. We
strive to create a positive experience with every customer interaction by delivering the best people, best processes, and best
technology.
Air Motor Company Division (www.airmotorcompany.com)

We are a leading research & development incubator company of The Harvard Think Tank (www.theharvardthinktank.com). Each day we take one step closer to acquiring the technology to bring Air Innovation to the global market. The space where the Air Motor Company is focusing most of their resources is in the development of compressed air technology solutions. Our solutions look to bring the most efficient green technology that every citizen of the world could use in any vehicle they currently use at a discounted price. There is no need to pollute the earth, when you can use Mother Nature to fuel the future.
WEX Power Division

WEX Power was developed to meet the growing demand for alternative energy for many reasons. Prices of crude oil have fluctuated wildly in the past few years causing gasoline prices to triple to the $5 per gallon mark. This caused average Americans to think about energy in ways they hadn't since the last "oil shock" in the 70's, which caused shortages and rapid price increases. A spirit of nationalism combined with a cry for energy independence has boosted interest in local, renewable, alternative energy sources like solar and wind. Today, energy from the sun and wind holds a very small percentage of US energy output, but is now at a tipping point. WEX Power is in development of products and services that can introduce new technology to the world.
| 4 |
WEX Think Tank Division

The WEX Think Tank Division was launched to allow companies and entrepreneurs from around the world to reach out to WMX for help to take their company to the next level. The goal with The WEX Think Tank is to give people a platform where they can pitch their game-changing idea to those involved with the Think Tank and if the WMX team likes the pitch they can provide financing, advice, and assistance in building the venture, like an incubator for new ventures. As a result, The WEX Think Tank has become the Company's venture capital arm. WMX anticipates generating revenue by receiving subscription fees, services, and equity.
Business Model
WMX Group Holdings, Inc. is a diversified company with a focus on creating, developing, and expanding their products and services across a portfolio of divisions.
WMX Trade Division (www.wmxtrade.com)
We have created a safe and secure website (www.wmxtrade.com) for our proprietary auction platform for the buying and selling of real products across the globe in several market segments, allowing members to achieve growth through globalization without massive upfront investment. Our website is designed to be a trading forum much like eBay, where various products are listed, auctioned, and sold to members that use the site. We have no members on our website to date. Our goal is to secure members and provide them with 24/7 global customer service and professional support in an ethical manner so that members can sell to every continent with confidence that any issues will be taken care of and advice can be provided upon request. We hope to focus initially on the trading of agricultural products and other distinct market segments.
| 5 |
Smart Kids Group Division (www.smartkidsgroup.com)
After successfully restructuring the debt associated with Smart Kids, WMX Group Holdings, Inc. after the end of their financial year, decided not to re-engage in a new agreement to sublicense or license any Smart Kids IP.

Our vision is to provide the most secure website auction platform, backed by a commitment to customer service excellence and growth through globalization.
WMX’s Market Opportunity
We believe that with 7 billion people on the planet and an expected 9 billion by 2045, access to customers should not be limited by geographical location. With us, people from all across the globe can have access to customers and sell to each and every continent.

We believe that our platform will provide tremendous growth opportunities.
| 6 |

Global demand for agricultural products and natural resources increases. A larger, wealthier class of people in the emerging world are demanding more goods as they raise their standard of living and the supply of these goods is impacted by geopolitics, diminishing mature sources and even weather.
Emerging economies are rebounding quicker from the global financial crisis than the west and are supporting demand for agricultural products. For example, wheat demand in China, Brazil, Russia and India grew at 5% in each of the last two seasons, while it contracted 4% over the same period in the United States and Europe. According to Rabobank, “Rapid economic expansion and changing dietary demands will continue to pressure traditional export supplies and encourage further investment in expanding supply, forming a key driver in the shift of the agricultural demand curve.”
| 7 |
Moreover, Chinese demand has had particular impact in reshaping agricultural product markets for soybeans, sugar, cotton and, potentially, corn. “China has played a key role in transforming the global soybean markets,” explains Luke Chandler of Rabobank. “China now accounts for 60% of global soybean imports, in addition to approximately 20% of world traded soybean. “This growth has resulted in expanded planted area in the United States and South America as soybeans became a major global commodity.” Chandler expects this tremendous growth to be replicated in other commodities as China’s shifting consumption patterns increase demand.1
The current shortage of specific commodity products around the world will persist
According to Rabobank, a number of agricultural products need to expand production in 2011 to rebuild stock levels, which could cause significant supply constraints. The current price rally is both broader and more structurally based than that of 2007/2008. “With cotton prices at record highs, a battle for acres is building as farmers decide whether to increase cotton acres over soybeans, wheat and corn.” Other farm input constraints such as fertilizer, chemicals, finance, seed, labor and machinery may impede efforts to respond to high prices in 2010. In addition, the availability of credit for farmers, and the current strength of the La Niña weather system - which heightens the risk of weather and production variability - could limit supply in 2011.2
Companies will continue to need to find new ways to obtain products for the best available price globally
Technology development and regulatory changes have let competition loose in the global commodity exchange industry. The industry is awash with new players, and prices for trade execution are falling and overseas competitors are emerging. New players are actively stealing market share from the established stock exchanges by delivering high-speed trade executions while undercutting them on price.
This is due to firms and companies across the globe needing to constantly obtain products for the best available price globally, as commodity prices have surged over the past two years. According to Rabobank, farm-commodity prices including corn will extend rallies next year driven by increased demand from emerging markets including China, the world’s most populous nation, and higher energy costs. Rabobank’s predictions add to forecasts that food costs may surge next year, potentially raising inflation and paving the way for a reprisal of the bull market in 2008, when prices surged to records.
Companies will need to reach all corners of the world to maintain a competitive advantage
In today’s highly competitive business environment companies need the ability to reach all corners of the globe in order to maintain a competitive advantage. For example, as companies like Coca-Cola and Wal-Mart expand globally it is critical that they be able to secure cheap and adequate supply of all raw products in order to remain highly profitable as their growth in the US becomes stagnant. These companies rely on global strategies maintain and gain competitive advantage.
For a company like Wal-Mart, its competitive advantage has always been to sell an endless supply of products at the cheapest available price, thus offering more product variety and undercutting the competition on price. In order to maintain this competitive advantage, Wal-Mart must continually reach all corners of the world to find highly diversified products at the cheapest available prices.
_____________________________
1 Rabobank: Seven Key Drivers That Will Shape Agri Commodities Market in 2011
2 Rabobank: Seven Key Drivers That Will Shape Agri Commodities Market in 2011
| 8 |
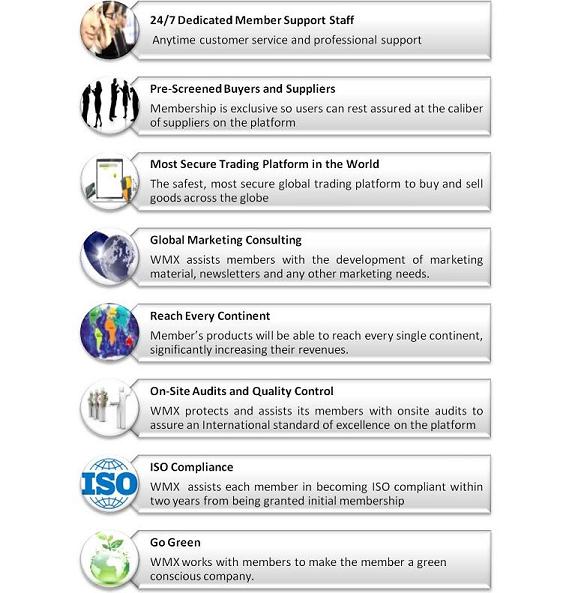
WMX’s Products and Services
We offer a safe and secure proprietary trading platform for the buying and selling of real products on our website in several market segments across the globe. In other words, we are introducing a new method of trade where buyers and sellers across the globe use us to facilitate the exchange of real products.
In order to ensure the utmost safety and security compliance, we intend to provide the most comprehensive third party screening process for members to make our website safe and secure to transact business in the world. In addition to the technology and screening process, we intend to offer customer service for our members and professional support, global marketing consulting, global reach, ISO compliance, and eco-friendly sustainability.
Our product and service offering includes the following:
| 9 |
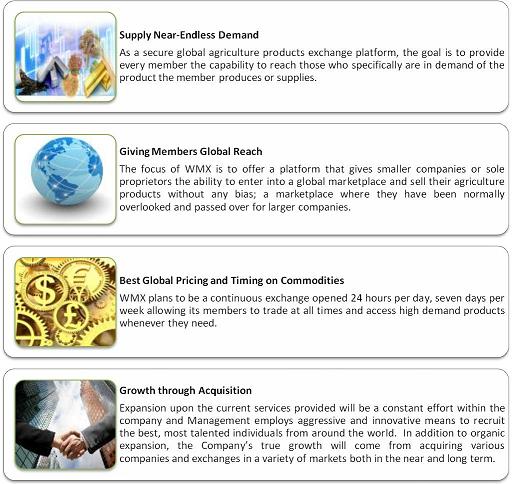
WMX’s Approach
To ensure our success, we have four core objectives that we consider to be the essential building blocks of growth:
WMX’s Platform
We intend to make our platform a place where raw or primary products are exchanged. These real products are traded on our platform through our members. The trading of these market segment products consists of direct physical trading of the actual goods rather than a security associated with the goods. The global volume of commodities trading alone on exchanges increased tremendously over the last five years due to the devalued U.S. Dollar and instability of the global securities markets. Trading on exchanges in China and India has gained in importance in recent years due to their emergence as significant commodities consumers and producers. China accounted for more than 60% of exchange-traded commodities in 2009, up on its 40% share in the previous year.
| 10 |
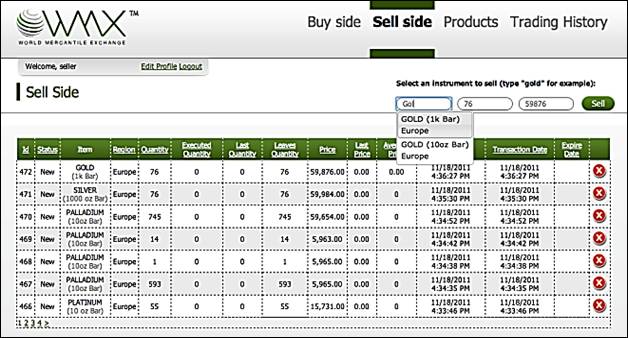
The below Figure 1 demonstrates the features of our website in the purchase and sale of commodities. Precious metals are displayed in this particular buy-sell transaction.
Figure 1: WMX Buy Side Trading Screenshot

Figure 2: WMX Sell Side Trading Screenshot
| 11 |
 |
 |
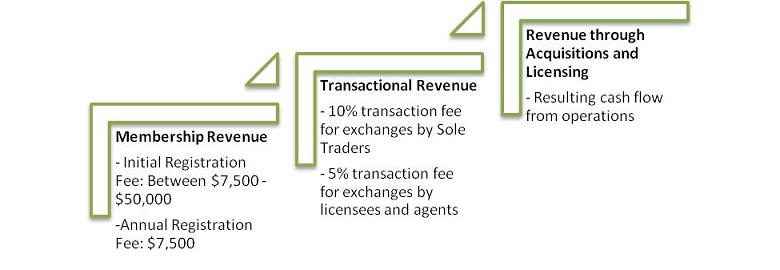
WMX’s Business Model
There are three main revenue components to our website platform: registration fee revenue from providing the service of the proprietary secure website facilitating an Auction Platform; revenue generated from transactions executed on the platform; and revenue generated through acquisitions, licensing.
Regarding our cost structure, over 95% will be variable and only 5% will directly depend on transactions and other miscellaneous fees generated as the facilitator on the World Farming Exchange. The main cost component will be the staffing costs. Management expects to achieve a net margin of around 30% - 50% before taxes.

| 12 |
Membership Types

Transaction Fees
In addition to revenue from annual registration fees, we intend to drive revenue from transactions that occur on the trading platform. For sole traders, we expect to receive a 5% transaction fee and the Member Firm would then receive 5% for executing the transaction on one of our Proprietary Market Segments. Licensees retain 5% of all net sales on all executed transactions introduced on our Trade Auction website platform and we receive 5%. Lastly, Agents make a flat 2.5% fee on all transactions they introduce to a Member Firm (Retaining 2.5%) and we receive 5%. It is through these transaction fees that the business model becomes highly scalable. Once a member applies and is approved, they can execute thousands of transactions a month, allowing us to monetize that acquired client over and over again which, overtime, reduces the cost of acquiring, servicing and maintaining that client.
| 13 |
Value Proposition
We hope to provide a secure website to our members to transact internationally, without boundaries, while providing quality assurance systems for Members of all sizes. Our services are member-oriented, affordable solutions to transact business with the focus of expanding our global reach and increasing revenue.
We have raised approximately $1,000,000 in seed financing from a select group of high net worth individuals. We will need more capital, however, implement our business plan. Furthermore, we have intentions of retaining investor relations firms to assist in the execution of the marketing plan.
Industry Analysis Overview
We operate in the E-Commerce, Services, and Online Auctions industry.
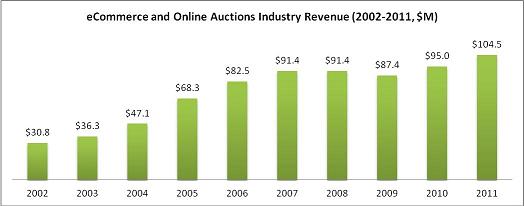
The E-Commerce, Services and Online Auctions industry has experienced strong revenue growth in recent years. Industry sales increased rapidly from the decade’s outset, tripling over the five years to 2007. In fact, between 2003 and 2007, sales increased from $36.3 billion to $91.4 billion. However, this trend reversed in 2008 as the Great Recession hampered growth. During this period, unemployment spiked and household wealth diminished as the real estate market burst and the credit crisis erupted. Per capita disposable income decreased by 0.4% in 2008, while consumer sentiment dropped by more than 25.0%. In 2009, this trend continued as sentiment fell by another 0.8%. As a result, industry revenue declined for the first time in seven years, falling by 4.3% to $87.4 billion.
In 2010, this trend began to reverse, as the economic recovery boosted per capita disposable income by 0.6%, while consumer sentiment increased by 14.6%. As a result, industry revenue rebounded by 8.7%. Industry revenue is expected to jump by about 10.0% in 2011, as firms continue to benefit from the economic recovery. Lower unemployment and improvements in consumer sentiment are expected to encourage individuals to spend more money. Budget-conscious consumers are also expected to continue to support growth as many consumers remain frugal in the aftermath of the Great Recession. As a result of these factors, and exceptional growth prior to the economic downturn, industry revenue is estimated to rise by about 4.8% annually in the five years to 2011 to $104.5 billion.3
3 IBISWorld: eCommerce and Online Auctions Industry 2011
| 14 |
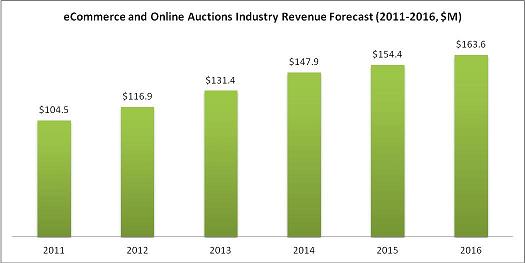
The eCommerce and Online Auctions industry will attract a greater customer
market as more households become conformable purchasing items electronically. Rising consumer confidence will be particularly
beneficial for the industry’s long-term growth, since it contributes to customer retention. IBISWorld projects that over
the five years to 2016, revenue will increase at an average annual rate of 9.4% to total $163.7 billion. In 2012 alone, industry
revenue is forecast to rise by 11.9% to $116.9 billion.
The industry’s projected growth is the result of several economic factors. For one, per capita income is projected to grow by 1.6% in 2012 and will continue to grow annually over the next five years at an average annual rate of 1.9%. Unemployment rates are also forecast to improve, dropping below 9.0% in 2012. The increases in per capita income and employment levels will revive consumer sentiment, which is anticipated to grow by 8.3% in 2012. As consumers’ wallets fill up, spending on products sold by the industry will increase. The industry will also benefit from pent-up demand dating from 2008 and 2009, when consumers delayed discretionary purchases in response to economic uncertainty.4
4 IBISWorld: eCommerce and Online Auctions Industry 2011
| 15 |
Market Analysis Overview
We intend to operate primarily in the agriculture market, which is comprised of manufacturers of all types of food products, as well as wholesalers of products, fuel manufacturers, feed producers, exporters of products, individual and institutional investors. The market segmentation is as follows:
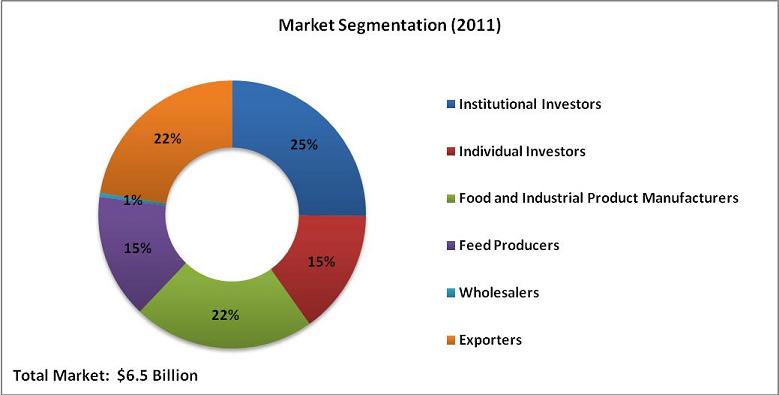
Approximately, 15% of the market is comprised of individual investors that we hope will use the platform to buy and sell agricultural products, hopefully for a profit. As a major market, individual investors are expected to maintain a constant share of market into the future.
We hope that institutional investors will use us much the same way as individual investors do: to buy and sell agricultural products for their own accounts. They include banks, insurance companies, retirement or pension funds, hedge funds and mutual funds. Institutional investors consist of 25% of the market.
Furthermore, the remainder of the market is comprised of Food and Industrial Product Manufacturers, Feed Producers, Wholesalers and Exporters which occupy 22%, 15%, 1% and 22% of the market, respectively. We hope that these customers will use our company to buy agricultural products from across the globe at a better price than exclusive contracts with agricultural products suppliers.
Competition
The E-Commerce and Online Auctions industry has a low level of concentration, as small companies make up over 70.0% of the market. The top two players – Amazon and eBay - are expected to account for about 23.9% of industry revenue in 2011, with no other company holding more than 5.0% market share.
Within this competitive landscape, we would compete with eBay, WebStore, eBid and OnlineAuction.com. At the moment, these online auction websites do not offer the exchange of agricultural products but with their technology in place could do so. It is due to this threat of entry that these websites would be considered competitors.
SMART KIDS GROUP DIVISION: Description & Overview
After successfully restructuring the debt associated with Smart Kids, WMX Group Holdings, Inc. after the end of their financial year, decided not to re-engage in a new agreement to sublicense or license any Smart Kids IP.
| 16 |
Marketing Plan
Company Positioning
We are looking to position the company as the safest and most secure proprietary commodities trading platform for the buying and selling of real agricultural goods across the globe.
Marketing Tactics
Internet Marketing
SEO (Organic Ranking)

Furthermore, by developing valuable and constantly updated content behind highly searched keyword terms, WMX will rank higher on these “covered” terms when searched for organically through an engine like Google, Bing or Yahoo. This organic ranking will bring authority to WMX for the global exchange real agricultural products, which will lead to more customer conversions.
SEM (Pay-per-Click)
Search Engine Marketing (Pay-per-Click) – we will utilize Google, Yahoo and Bing paid search campaigns to target audiences interested in trading commodities. This will include PPC campaigns that target high search volume terms so as to drive traffic to the website.
Display Advertising (Pay-Per-Impression)

Display Advertising (Pay-per-Impression) – we expect to promote WMX on 3rd party websites such as CNNMoney, CNBC, Yahoo! Finance and Bloomberg, and in email campaigns to subscribers or members of any industry publications and professional organizations. Third party websites that we intend to utilize for display advertising include:
· CNNMoney.com (1,467 unique visitors per month)
· CNBC.com (3.22 million unique visitors per month)
· Finance.Yahoo.com (6.63 million unique monthly visitors)
· Bloomberg.com (4.91 million unique monthly visitors)
Average banner advertising rates are $20 CPM or cost per thousand impressions. (This number will vary based on the rate that each website charges in their media packet).
| 17 |
Social Media Optimization
Blogging
Blogging – we intend to utilize a corporate (in-house) blog to target clients interested in commodities trading. This tactic is particularly useful in targeting those individuals that regularly traffic trading blogs and would be highly likely to become a member.
Twitter – we intend create a Twitter account to notify followers of happenings, new features, new products and customer success stories that have occurred on the exchange. For instance, a message would state “1,000 global transactions took place on the platform today.”
Facebook – we intend to create a Facebook page and recruit fans in order to keep them updated about current products and any new features or services that are going to be launched. Each time a person “likes” us, any Company updates will show up in their newsfeed, which virally spreads our brand to thousands of potential members.
Linkedin – we intend to create a Linkedin profile and add contacts in order to keep business professionals updated about current products, services as well as new features that are going to be launched on the exchange. Linkedin will also be a great place to advertise the platform via podcasts, webinars and product demos.
Email Campaigns
We intend to utilize email marketing through a CRM software system such as SalesForce.com to send promotional materials and newsletters about the Company and its products to prospective customers and browsers that traffic the website. With a simple lead generation portal on WMXTrade.com, a website browser inputs their name and email to receive promotional materials, information or a newsletter about the Company’s products and services. We will use this acquired contact information to quickly generate a list of prospective clients that will continually receive emails about the exchange.
| 18 |
Traditional Marketing Public Relations

We intend to utilize a PR firm to gain exposure to its target market through use of press releases, articles, light TV advertising, and public speaking events. Since PR firms place exposure in credible and relevant third party media outlets, this marketing tactic offers a certain third-party legitimacy that normal advertising cannot provide. The Company is currently in the process of signing a public relations firm to manage all media buying across different channels.
Conferences

We also intend to take part in all of the trading industry’s leading trade shows and conferences in order to achieve highly targeted exposure amongst potential clientele. When dealing with game-changing technology, it is highly beneficial to show industry participants and leaders exactly how the platform works, and how they can use it to increase revenue.
TV Advertising

We also intend to utilize TV advertising on financial services related television channels such as CNBC and Bloomberg. Although TV advertising can be expensive is it highly effective at targeting the type of clients that we are looking to attract. The rate for TV ads will vary based on the time slot and the average viewer rating for those time slots.
Operational Strategy
We intend to satisfy the growing demand for products, while facilitating a global trade network with no boundaries. Our operations strategy is based on the following foundational elements:
· Extraordinary Customer Service and Support
· Continuous Innovation
· Growth Through Acquisition
· Maintaining a Balance Portfolio of Businesses
| 19 |
Extraordinary Customer Service and Support
We will listen to customers and collect feedback in a variety of methods including online surveys and formal usability studies. We will translate this information to actionable plans that are prioritized and implemented on an on-going basis to ensure that exceptional customer service and support is provided during the transaction process. The customer service process is as follows:

Continuous Innovation
We are highly focused on creating a unique experience for each and every client for all their divisions. Our philosophy will be to continually innovate as far as products and features available on the website platform so that everyone using our service will have an exceptional experience.
· Constantly test and evaluate new features and enhancements to the application experience through sophisticated tools such as multi-variate/AB testing and website analytics.
· Use in-house programmers to continually update the trading platform for ease-of-use and speed of execution.
· Rapidly determine whether any particular application enhancement or promotion is successful and results in higher conversion of visitors to customers.
Growth Through Acquisition
We believe that we must expand our geographic reach to build our business. Limiting our self geographically limits members’ reach and the pool of talent in regards to staff. We expect to expand in an orderly manner and to build a regional management structure. The expansion philosophy focuses on assessing acquisition candidates in strategically significantly new geographic areas that may be an effective means to obtain new members and expand into new areas.
Maintain a Balanced Portfolio of Businesses
Maintaining a balanced portfolio of businesses is a focus of the Company.This is highlighted by the acquisition strategy noted below. Management will diversify the business by acquiring major companies in several industries that we feel will dramatically increase revenue. Once someone becomes a member of our website service providers, we will stress developing and maintaining an excellent work culture, one of caring and nurturing, catering to members’ specific needs, while being respectful and understanding of the needs of the staff. This methodology will positively impact performance and ensure seamless integration. We have already begun implementing this acquisition strategy:
WMX Group Holdings, Inc. Association Affiliations
We are certified by the International Organization for Standardization (ISO).

The ISO 9001 set of standards relate to the highest quality management systems in the world. These management systems are designed to help organizations ensure they meet the needs of customers and other stakeholders. The standards are published by ISO, the International Organization for Standardization and available through national standardized bodies. ISO 9001 deals with the fundamentals of quality management systems, including the management principles on which the standards are based. ISO 9001 deals with the requirements that organizations wishing to meet the standard have to fulfill. Third party certification bodies provide independent confirmation that organizations meet the requirements of ISO 9001. A very small percentage of companies globally both private and public are independently certified. This makes ISO 9001 the most widely recognized certification for management tools in the world today.
| 20 |
Acquiring Growing Businesses
Aside from our trading platform business, we intend to become a holding company through the acquisition of growing businesses. As a result, we have already launched several divisions that allow for business model diversification and synergy.
Employees
As of the date of this Annual Report, we have one full-time employee, Mr. Thomas Anthony Guerriero and three part-time employees Lisa Yakiwchuck, Mr. Syed Gilani, and Philip Clark.
Our principal executive offices are located at 301 Yamato Road, Suite 1240, Boca Raton, and Florida 33431. Our offices are adequate for our current needs.
We are not a party to any pending legal proceeding. We are not aware of any pending legal proceeding to which any of our officers, directors, or any beneficial holders of 5% or more of our voting securities are adverse to us or have a material interest adverse to us.
Item 4. Mine Safety Disclosures
Not applicable.
| 21 |
PART II
Item 5. Market for Registrant’s Common Equity, Related Stockholder Matters and Issuer Purchases of Equity Securities
Market Information
Our common stock is quoted under the symbol “WMXG” on the OTCBB operated by the Financial Industry Regulatory Authority, Inc. (“FINRA”) and the OTCQB operated by OTC Markets Group, Inc. Few market makers continue to participate in the OTCBB system because of high fees charged by FINRA. Consequently, market makers that once quoted our shares on the OTCBB system may no longer be posting a quotation for our shares. As of the date of this report, however, our shares are quoted by several market makers on the OTCQB. The criteria for listing on either the OTCBB or OTCQB are similar and include that we remain current in our SEC reporting.
Only a limited market exists for our securities. There is no assurance that a regular trading market will develop, or if developed, that it will be sustained. Therefore, a shareholder may be unable to resell his securities in our company.
The following tables set forth the range of high and low prices for our common stock for the each of the periods indicated as reported by the OTCQB. These quotations reflect inter-dealer prices, without retail mark-up, mark-down or commission and may not necessarily represent actual transactions.
| Fiscal Year Ending June 30, 2012 | ||||
| Quarter Ended | High $ | Low $ | ||
| June 30, 2012 | $0.0535 | $0.016 | ||
| March 31, 2012 | $0.32 | $0.011 | ||
| December 31, 2011 | $0.04 | $0.011 | ||
On September 24, 2012, the last sales price per share of our common stock was $0.03.
Penny Stock
The SEC has adopted rules that regulate broker-dealer practices in connection with transactions in penny stocks. Penny stocks are generally equity securities with a market price of less than $5.00, other than securities registered on certain national securities exchanges or quoted on the NASDAQ system, provided that current price and volume information with respect to transactions in such securities is provided by the exchange or system. The penny stock rules require a broker-dealer, prior to a transaction in a penny stock, to deliver a standardized risk disclosure document prepared by the SEC, that: (a) contains a description of the nature and level of risk in the market for penny stocks in both public offerings and secondary trading; (b) contains a description of the broker's or dealer's duties to the customer and of the rights and remedies available to the customer with respect to a violation of such duties or other requirements of the securities laws; (c) contains a brief, clear, narrative description of a dealer market, including bid and ask prices for penny stocks and the significance of the spread between the bid and ask price; (d) contains a toll-free telephone number for inquiries on disciplinary actions; (e) defines significant terms in the disclosure document or in the conduct of trading in penny stocks; and (f) contains such other information and is in such form, including language, type size and format, as the SEC shall require by rule or regulation.
| 22 |
The broker-dealer also must provide, prior to effecting any transaction in a penny stock, the customer with (a) bid and offer quotations for the penny stock; (b) the compensation of the broker-dealer and its salesperson in the transaction; (c) the number of shares to which such bid and ask prices apply, or other comparable information relating to the depth and liquidity of the market for such stock; and (d) a monthly account statement showing the market value of each penny stock held in the customer's account.
In addition, the penny stock rules require that prior to a transaction in a penny stock not otherwise exempt from those rules, the broker-dealer must make a special written determination that the penny stock is a suitable investment for the purchaser and receive the purchaser's written acknowledgment of the receipt of a risk disclosure statement, a written agreement as to transactions involving penny stocks, and a signed and dated copy of a written suitability statement.
These disclosure requirements may have the effect of reducing the trading activity for our common stock. Therefore, stockholders may have difficulty selling our securities.
Holders of Our Common Stock
As of June 30, 2012, we had 1,207,385,066 shares of our common stock issued and outstanding, held by 57 shareholders of record.
Dividends
There are no restrictions in our articles of incorporation or bylaws that prevent us from declaring dividends. The Nevada Revised Statutes, however, do prohibit us from declaring dividends where after giving effect to the distribution of the dividend:
| 1. | we would not be able to pay our debts as they become due in the usual course of business, or; |
| 2. | our total assets would be less than the sum of our total liabilities plus the amount that would be needed to satisfy the rights of shareholders who have preferential rights superior to those receiving the distribution. |
We have not declared any dividends and we do not plan to declare any dividends in the foreseeable future.
Recent Sales of Unregistered Securities
On April 30, 2012, we entered into an Agreement and Plan of Merger (the “Merger Agreement”) with WMX Group Holdings, Inc., a Nevada corporation (“WMX”) and SKGI Acquisition Corp., a Nevada corporation and our wholly-owned subsidiary (“Acquisition Sub”), pursuant to which Acquisition Sub merged with and into WMX (the “Merger”) with the filing of the Articles of Merger with the Nevada Secretary of State on May 1, 2012 and became our wholly-owned subsidiary. In accordance with the terms of the Merger Agreement, at the closing an aggregate of 104,042,523 shares of our common stock were issued to the holders of WMX’s common stock in exchange for their shares of WMX.
On May 22, 2012, we entered into Amendment No. 1 to the Merger Agreement (the “Merger Agreement Amendment”) with WMX, and Acquisition Sub, effective April 30, 2012. The Merger Agreement Amendment revises the Merger Agreement to:
1. Change the shares that will be exchanged in the Merger from 104,042,523 shares of our common stock to 105,384,609 shares of our common stock; and
2. Provide for anti-dilution to two of our board members: Mr. Thomas Guerriero will have a 95% non-dilutive equity interest and Mr. Richard Shergold will have a 1% non-dilutive equity interest in our company. There is no termination or expiration date for the anti-dilution clause.
| 23 |
As a result of the Merger Agreement Amendment, we issued to Mr. Guerriero 950,000,000 shares of our common stock.
On September 12, 2012, we issued 133,978,100 shares as a result of one time dilution protection to the shareholders of WMX Group, Inc.
On July 1, 2012, the Company received $20,000 in cash in exchange for a common stock payable of 1,500,000 shares of common stock ($0.013 per share).
On August 15, 2012, the Company received $100,000 in cash in exchange for a common stock payable of 13,750,000 shares of common stock ($0.007 per share).
On September 7, 2012, the Company received $50,000 in cash in exchange for a common stock payable of 15,000,000 shares of common stock ($0.003 per share).
On September 12, 2012, the Company issued 42,820,400 shares of common stock to satisfy obligations under share subscription agreements for $379,688 in cash received included $209,688 in the stock payable as of June 30, 2012 and $170,000 from the transactions noted above.
On September 12, 2012, the Company issued 67,631,000 shares in common stock and paid $14,223 in cash to settle accounts payable of $196,973 outstanding on June 30, 2012.
On September 12, 2012, the Company issued 42,500,000 and 11,000,000 shares in common stock to settle amounts due to the former CEO and former COO of the Company of $475,558 and $112,184, respectively, per debt settlement agreement.
On September 12, 2012, the Company issued 133,978,100 shares of common stock to original investors of the Company for anti-dilution protection. This transaction has been recorded retroactively similar to a stock split since the shares were issued with no corresponding consideration.
These securities were issued pursuant to Section 4(2) of the Securities Act and/or Rule 506 promulgated thereunder. The holders represented their intention to acquire the securities for investment only and not with a view towards distribution. The investors were given adequate information about us to make an informed investment decision. We did not engage in any general solicitation or advertising. We directed our transfer agent to issue the stock certificates with the appropriate restrictive legend affixed to the restricted stock.
Securities Authorized for Issuance under Equity Compensation Plans
On June 11, 2012, our Board of Directors adopted the 2012 Equity Incentive Plan (the “Plan”). The purpose of the Plan is to attract and retain the best available personnel for positions of substantial responsibility with us, to provide additional incentive to employees, directors and consultants, and to promote our success. Under the Plan, we may issue up to an aggregate total of 55,000,000 incentive or non-qualified options to purchase our common stock. As of June 30, 2012, we have not issued any options under the Plan.
Item 6. Selected Financial Data
A smaller reporting company is not required to provide the information required by this Item.
Item 7. Management’s Discussion and Analysis of Financial Condition and Results of Operations
Forward-Looking Statements
Certain statements, other than purely historical information, including estimates, projections, statements relating to our business plans, objectives, and expected operating results, and the assumptions upon which those statements are based, are “forward-looking statements” within the meaning of the Private Securities Litigation Reform Act of 1995, Section 27A of the Securities Act of 1933 and Section 21E of the Securities Exchange Act of 1934. These forward-looking statements generally are identified by the words “believes,” “project,” “expects,” “anticipates,” “estimates,” “intends,” “strategy,” “plan,” “may,” “will,” “would,” “will be,” “will continue,” “will likely result,” and similar expressions. We intend such forward-looking statements to be covered by the safe-harbor provisions for forward-looking statements contained in the Private Securities Litigation Reform Act of 1995, and are including this statement for purposes of complying with those safe-harbor provisions. Forward-looking statements are based on current expectations and assumptions that are subject to risks and uncertainties which may cause actual results to differ materially from the forward-looking statements. Our ability to predict results or the actual effect of future plans or strategies is inherently uncertain. Factors which could have a material adverse affect on our operations and future prospects on a consolidated basis include, but are not limited to: changes in economic conditions, legislative/regulatory changes, availability of capital, interest rates, competition, and generally accepted accounting principles. These risks and uncertainties should also be considered in evaluating forward-looking statements and undue reliance should not be placed on such statements. We undertake no obligation to update or revise publicly any forward-looking statements, whether as a result of new information, future events or otherwise. Further information concerning our business, including additional factors that could materially affect our financial results, is included herein and in our other filings with the SEC.
| 24 |
Results of Operations for the Year Ended June 30, 2012, the Period from Inception (January 18, 2011) to June 30, 2011 and Inception (January 18, 2011) to June 30, 2012
Revenues
We are a development stage company and have generated nominal revenues of $98 from inception (January 18, 2011) to June 30, 2012. We do not anticipate significant revenues until we have completed and successfully sold our products and services in the market.
Operating Expenses
Operating expenses increased to $1,034,442 for the year ended June 30, 2012 from $322,498 for the period ended June 30, 2011. Our operating expenses for the year ended June 30, 2012 consisted mainly of professional fees of $126,786, officer compensation of $256,987, stock-based compensation of $497,064, general and administrative of $62,566 and software development of $52,849. In comparison, our operating expenses for the period from inception (January 18, 2011) to June 30, 2011 consisted mainly of professional fees of $42,530, officer compensation of $125,000, stock-based compensation of $4,500, general and administrative of $81,619 and software development of $48,615. The increase in the operating expenses was primarily due to the write-off of stock-based prepaid expenses totaling $238,702 for investor relations consultants acquired from the reverse take-over of Smart Kids Group, Inc. on April 30, 2012, expensed the stock-based prepaid expenses of $58,362, and paid $200,000 in for investor relations consultants as stock-based compensation for the year ended June 30, 2012, as compared to $4,500 paid in stock-based compensation for the period ended June 30, 2012. Officer compensation increased proportionately with the longer fiscal period in 2012. During the year ended June 30, 2012, finance expense of $25,000 was due the write-off of deferred finance charge acquired from the reverse take-over of Smart Kids Group, Inc. on April 30, 2012. Total operating expense incurred to date since inception (January 18, 2011) to June 30, 2012 is $1,356,940.
Net Loss
As a result of an increase in operating costs and other expenses, our net loss for the year ended June 30, 2012 was $1,034,344 compared to net loss of $322,498 for the period ended June 30, 2011 and $1,356,842 for the period from inception (January 18, 2011) to June 30, 2012.
Liquidity and Capital Resources
As of June 30, 2012, we had total current assets of $68,321 and total assets in the amount of $70,521. Our total current liabilities as of June 30, 2012 were $897,500. We had a deficit accumulated during the development stage of $(1,356,842) and a working capital deficit of $(829,179) as of June 30, 2012.
Cash used in operating activities increased to $(198,352) for the year ended June 30, 2012 compared to net cash from operating activities $69,015 for the period ended June 30, 2011 as a result primarily from an increase in our net loss.
Cash provided by investing activities increased to $11,132 for the year ended June 30, 2012 compared to cash used in investing activities of $(3,071) for the period ended June 30, 2011. The increase cash provided from investing activities was due to the $11,701 is cash acquired from acquired from the reverse take-over of Smart Kids Group, Inc. on April 30, 2012.
Cash flows provided by financing activities during the year ended June 30, 2012 increased to $250,464 compared to cash used from financing $(65,687) for the period ended June 30, 2011. The increase in cash provided by financing activities is due to a decrease in payments to related party.
| 25 |
Based upon our current financial condition, we do not have sufficient cash to operate our business at the current level for the next twelve months. We intend to fund operations through increased sales and debt and/or equity financing arrangements, which may be insufficient to fund expenditures or other cash requirements. We plan to seek additional financing in a private equity offering to secure funding for operations. There can be no assurance that we will be successful in raising additional funding. If we are not able to secure additional funding, the implementation of our business plan will be impaired. There can be no assurance that such additional financing will be available to us on acceptable terms or at all.
Going Concern
At June 30, 2012, we had $63,321 cash on-hand and a deficit accumulated during the development stage of $1,356,842, and as noted throughout this report and our financial statements and notes thereto, our independent auditors have expressed their substantial doubt as to our ability to continue as a going concern as of June 30, 2012. We anticipate incurring significant losses in the future. We do not have an established source of revenue sufficient to cover our operating costs. Our ability to continue as a going concern is dependent upon our ability to successfully compete, operate profitably and/or raise additional capital through other means. If we are unable to reverse our losses, we will have to discontinue operations.
The financial statements included in this quarterly report have been prepared assuming that we will continue as a going concern, which contemplates the recoverability of assets and the satisfaction of liabilities in the normal course of business.
Management’s plans include the raising of capital through the equity markets to fund future operations, seeking additional acquisitions, and generating of revenue through our business. However, even if we do raise sufficient capital to support our operating expenses and generate adequate revenues, there can be no assurances that the revenue will be sufficient to enable us to develop business to a level where we will generate profits and positive cash flows from operations. These matters raise substantial doubt about our ability to continue as a going concern. These financial statements do not include any adjustments relating to the recoverability and classification of recorded asset amounts, or amounts and classification of liabilities that might result from this uncertainty.
Off-Balance Sheet Arrangements
We did not have any off-balance sheet arrangements that have or are reasonably likely to have a current or future effect on our financial condition, changes in financial condition, revenues or expenses, results of operations, liquidity, capital expenditures or capital resources that is material to investors.
Critical Accounting Policies
The Company’s discussion and analysis of its financial condition and results of operations are based upon the Company’s consolidated financial statements, which have been prepared in accordance with accounting principles generally accepted in the United States. The preparation of these consolidated financial statements requires the Company to make estimates and judgments that affect the reported amounts of assets, liabilities, revenues and expenses and related disclosure of contingent assets and liabilities. The Company bases its estimates on historical experience and on various other assumptions that are believed to be reasonable under the circumstances, the results of which form the basis for making judgments about the carrying values of assets and liabilities that are not readily apparent from other sources. Actual results may differ from these estimates under different assumptions or conditions.
The Company believes the following critical accounting policies affect its more significant judgments and estimates used in the preparation of its consolidated financial statements.
| 26 |
Stock-based compensation – The Company accounts for equity instruments issued in exchange for the receipt of goods or services from other than employees in accordance with FASB ASC 718-10 and the conclusions reached by the FASB ASC 505-50. Costs are measured at the estimated fair market value of the consideration received or the estimated fair value of the equity instruments issued, whichever is more reliably measurable. The value of equity instruments issued for consideration other than employee services is determined on the earliest of a performance commitment or completion of performance by the provider of goods or services as defined by FASB ASC 505-50.
Recently Issued Accounting Pronouncements
The Company has evaluated recent pronouncements through Accounting Standards Updates “ASU” 2012-03 and believes that none of them will have a material impact on the Company’s financial position, results of operations or cash flows.
Item 7A. Quantitative and Qualitative Disclosures About Market Risk
A smaller reporting company is not required to provide the information required by this Item.
Item 8. Financial Statements and Supplementary Data
Index to Financial Statements Required by Article 8 of Regulation S-X:
Audited Financial Statements:
| 27 |
|
Office Locations Las Vegas, NV New York, NY Pune, India Beijing, China |
 |
REPORT OF INDEPENDENT REGISTERED PUBLIC ACCOUNTING FIRM
To the Board of Directors and Stockholders
WMX Group Holdings, Inc.
We have audited the accompanying consolidated balance sheets of WMX Group Holdings, Inc. and Subsidiaries (A Development Stage Company) (the “Company”) as of June 30, 2012 and 2011 and the related consolidated statements of operations, stockholders’ deficit and cash flows for the year ended June 30, 2012 and for the period from inception (January 18, 2011) through June 30, 2011 and 2012. WMX Group Holdings, Inc.’s management is responsible for these financial statements. Our responsibility is to express an opinion on these financial statements based on our audits.
We conducted our audits in accordance with the standards of the Public Company Accounting Oversight Board (United States). Those standards require that we plan and perform the audit to obtain reasonable assurance about whether the financial statements are free of material misstatement. The company is not required to have, nor were we engaged to perform, an audit of its internal control over financial reporting. Our audit included consideration of internal control over financial reporting as a basis for designing audit procedures that are appropriate in the circumstances, but not for the purpose of expressing an opinion on the effectiveness of the company’s internal control over financial reporting. Accordingly, we express no such opinion. An audit also includes examining, on a test basis, evidence supporting the amounts and disclosures in the financial statements, assessing the accounting principles used and significant estimates made by management, as well as evaluating the overall financial statement presentation. We believe that our audits provide a reasonable basis for our opinion.
In our opinion, the financial statements referred to above present fairly, in all material respects, the financial position of WMX Group Holdings, Inc. (A Development Stage Company) as of June 30, 2012 and 2011 and the results of their operations and their cash flows for the year ended June 30, 2012 and for the period from inception (January 18, 2011) through June 30, 2011 and 2012 in conformity with accounting principles generally accepted in the United States of America.
The accompanying financial statements have been prepared assuming the Company will continue as a going concern. As discussed in Note 3 to the financial statements, the Company has suffered losses from operations, which raise substantial doubt about its ability to continue as a going concern. Management’s plans in regard to these matters are also described in Note 3. The financial statements do not include any adjustments that might result from the outcome of this uncertainty.
/s/ De Joya Griffith, LLC
Henderson, Nevada
September 26, 2012
|
De Joya Griffith, LLC ● 2580 Anthem Village Dr. ● Henderson, NV ● 89052 Telephone (702) 563-1600 ● Facsimile (702) 920-8049 www.dejoyagriffith.com |
| F-1 |
(A Development Stage Company)
CONSOLIDATED BALANCE SHEETS
(Audited)
| June 30, | June 30, | |||||||
| 2012 | 2011 | |||||||
| ASSETS | ||||||||
| Current assets: | ||||||||
| Cash | $ | 63,321 | $ | 77 | ||||
| Prepaid expenses | 5,000 | — | ||||||
| Total current assets | 68,321 | 77 | ||||||
| Property and equipment, net | 2,200 | 2,837 | ||||||
| Total assets | $ | 70,521 | $ | 2,914 | ||||
| LIABILITIES AND STOCKHOLDERS' DEFICIT | ||||||||
| Current liabilities | ||||||||
| Accounts payable and accrued liabilities | $ | 278,406 | $ | — | ||||
| Officer compensation payable | 31,352 | 125,000 | ||||||
| Due to related parties | 587,742 | — | ||||||
| Total current liabilities | 897,500 | 125,000 | ||||||
| Stockholders' deficit: | ||||||||
| Preferred stock: $0.0001 par value; authorized 40,000,000 shares; issued and outstanding: 0 and 0, respectively | — | — | ||||||
| Common stock: $0.0001 par value; authorized 1,800,000,000 shares; issued and outstanding: 1,207,385,066 and 1,184,057,738, respectively | 120,739 | 118,406 | ||||||
| Additional paid-in capital | 190,300 | 552,706 | ||||||
| Stock payable | 218,824 | — | ||||||
| Due from related party | — | (195,200 | ) | |||||
| Subscriptions receivable | — | (275,500 | ) | |||||
| Deficit accumulated during the development stage | (1,356,842 | ) | (322,498 | ) | ||||
| Total stockholders' deficit | (826,979 | ) | (122,086 | ) | ||||
| Total liabilities and stockholders' deficit | $ | 70,521 | $ | 2,914 | ||||
The accompanying notes are an integral part of these consolidated financial statements.
| F-2 |
(A Development Stage Company)
CONSOLIDATED STATEMENTS OF OPERATIONS
(Audited)
| For
the year ended June 30, 2012 | Period
from Inception (January 18, 2011) to June 30, 2011 | Period
from Inception (January 18, 2011) to June 30, 2012 | |||||||||
| Revenue | $ | 98 | $ | — | $ | 98 | |||||
| Operating expenses: | |||||||||||
| General and administrative | 62,566 | 81,619 | 144,185 | ||||||||
| Amortization | 496 | — | 496 | ||||||||
| Depreciation | 1,206 | 234 | 1,440 | ||||||||
| Impairment of fixed assets and intangible assets | 1,488 | — | 1,488 | ||||||||
| Software development | 52,849 | 48,615 | 101,464 | ||||||||
| Officer compensation | 256,987 | 125,000 | 381,987 | ||||||||
| Professional fees | 126,786 | 42,530 | 169,316 | ||||||||
| Sub-licensing expense | 10,000 | — | 10,000 | ||||||||
| Professional stock-based fees | 497,064 | 4,500 | 501,564 | ||||||||
| Finance expense | 25,000 | — | 25,000 | ||||||||
| Allowance on subscription receivable | — | 20,000 | 20,000 | ||||||||
| Total operating expenses | 1,034,442 | 322,498 | 1,356,940 | ||||||||
| Loss before income taxes | (1,034,344 | ) | (322,498 | ) | (1,356,842 | ) | |||||
| Provision for income taxes | — | — | — | ||||||||
| Net loss | $ | (1,034,344 | ) | $ | (322,498 | ) | $ | (1,356,842 | ) | ||
| Basic loss per common share | $ | (0.00 | ) | $ | (0.00 | ) | |||||
| Basic weighted average common shares outstanding | 1,205,661,333 | 1,183,869,551 | |||||||||
The accompanying notes are an integral part of these consolidated financial statements.
| F-3 |
(A Development Stage Company)
CONSOLIDATED STATEMENT OF STOCKHOLDERS' EQUITY
PERIOD FROM INCEPTION (JANUARY 18, 2011) TO JUNE 30, 2012
(Audited)
| Deficit Accumulated | ||||||||||||||||||||||||||||||||||||||||
| Preferred Stock | Common Stock | Additional | Due from | Subscriptions | During the Development | Total Stockholders' | ||||||||||||||||||||||||||||||||||
| Shares | Amount | Shares | Amount | Paid-in Capital | Stock Payable | Related Party | Receivable | Stage | Deficit | |||||||||||||||||||||||||||||||
| Balance, January 18, 2011 | — | $ | — | — | $ | — | $ | — | $ | — | $ | — | $ | — | $ | — | $ | — | ||||||||||||||||||||||
| Shares issued to officer and majority shareholders * | — | — | 1,183,017,738 | 118,302 | (117,202 | ) | — | — | — | 1,100 | ||||||||||||||||||||||||||||||
| Shares issued for cash, net offering costs | — | — | 1,035,500 | 104 | 665,408 | — | (369,703 | ) | (275,500 | ) | — | 20,309 | ||||||||||||||||||||||||||||
| Stock-based compensation | — | — | 4,500 | — | 4,500 | — | — | — | — | 4,500 | ||||||||||||||||||||||||||||||
| Repayment on related party | — | — | — | — | — | — | 174,503 | — | — | 174,503 | ||||||||||||||||||||||||||||||
| Net loss | — | — | — | — | — | — | — | — | (322,498 | ) | (322,498 | ) | ||||||||||||||||||||||||||||
| Balance, June 30, 2011 | — | — | 1,184,057,738 | 118,406 | 552,706 | — | (195,200 | ) | (275,500 | ) | (322,498 | ) | (122,086 | ) | ||||||||||||||||||||||||||
| Shares issued for cash, net offering costs | — | — | 5,104,971 | 511 | (7,543 | ) | — | — | 275,500 | — | (266,468 | ) | ||||||||||||||||||||||||||||
| Stock payable for cash | — | — | — | — | — | 131,371 | — | — | — | 131,371 | ||||||||||||||||||||||||||||||
| Stock-based compensation | — | — | 200,000 | 20 | 199,980 | — | — | — | — | 200,000 | ||||||||||||||||||||||||||||||
| Repayment of amount due from related party | — | — | — | — | — | — | 195,200 | — | — | 195,200 | ||||||||||||||||||||||||||||||
| Reverse acquisition of Smart Kids Group Inc. | — | — | 18,022,357 | 1,802 | (554,843 | ) | 87,453 | — | — | — | (465,588 | ) | ||||||||||||||||||||||||||||
| Net loss | — | — | — | — | — | — | — | — | (1,034,344 | ) | (1,034,344 | ) | ||||||||||||||||||||||||||||
| Balance, June 30, 2012 | — | $ | — | 1,207,385,066 | $ | 120,739 | $ | 190,300 | $ | 218,824 | $ | — | $ | — | $ | (1,356,842 | ) | $ | (826,979 | ) | ||||||||||||||||||||
* 950,000,000 shares issued during the year ended June 30, 2012 and 133,978,100 shares issued subsequent to the year then ended were issued under the anti-dilution clause have been recorded retroactively similar to a stock split since the shares were issued with no corresponding consideration.
The accompanying notes are an integral part of these consolidated financial statements.
| F-4 |
WMX
GROUP HOLDINGS, INC.
(A Development Stage Company)
CONSOLIDATED STATEMENTS OF CASH FLOWS
(Audited)
| For
the year ended June 30, 2012 | Period
from Inception (January 18, 2011) to June 30, 2011 | Period
from Inception (January 18, 2011) to June 30, 2012 | ||||||||||
| Cash flows from operating activities: | ||||||||||||
| Net loss | $ | (1,034,344 | ) | $ | (322,498 | ) | $ | (1,356,842 | ) | |||
| Adjustments to reconcile net loss to net cash provided by (used in) operating activities: | ||||||||||||
| Depreciation | 1,206 | 234 | 1,440 | |||||||||
| Amortization | 496 | — | 496 | |||||||||
| Impairment of fixed assets and intangible asset | 1,488 | — | 1,488 | |||||||||
| Shares issued to officer and majority shareholder | — | 1,100 | 1,100 | |||||||||
| Professional stock-based expenses | 497,064 | 4,500 | 501,564 | |||||||||
| Expenses paid by related party | 50,927 | 260,679 | 311,606 | |||||||||
| Finance expense | 25,000 | — | 25,000 | |||||||||
| Changes in operating assets and liabilities: | ||||||||||||
| Increase in prepaid expense | (5,000 | ) | — | (5,000 | ) | |||||||
| Increase in officer compensation payable | 200,000 | 125,000 | 325,000 | |||||||||
| Increase in accounts payable and accrued liabilities | 58,393 | — | 58,393 | |||||||||
| Increase in due to related parties | 57,345 | 260,679 | 318,024 | |||||||||
| Net cash provided by (used in) operating activities | (198,352 | ) | 69,015 | (129,337 | ) | |||||||
| Cash flows from investing activities: | ||||||||||||
| Purchase of fixed assets | (569 | ) | (3,071 | ) | (3,640 | ) | ||||||
| Cash received from reverse acquisition of Smart Kids Group, Inc. | 11,701 | — | 11,701 | |||||||||
| Net cash provided by (used in) investing activities | 11,132 | (3,071 | ) | 8,061 | ||||||||
| Cash flows from financing activities: | ||||||||||||
| Proceeds from issuance of stock | 399,839 | 390,012 | 789,851 | |||||||||
| Advances by related party | 49,125 | 9,625 | 58,750 | |||||||||
| Payments to related party | (198,500 | ) | (465,504 | ) | (664,004 | ) | ||||||
| Net cash provided by (used in) financing activities | 250,464 | (65,867 | ) | 184,597 | ||||||||
| Net change in cash | 63,244 | 77 | 63,321 | |||||||||
| Cash, beginning of period | 77 | — | — | |||||||||
| Cash, end of period | $ | 63,321 | $ | 77 | $ | 63,321 | ||||||
| SUPPLEMENTAL DISCLOSURE OF CASH FLOW INFORMATION: | ||||||||||||
| Cash paid for interest | $ | — | $ | — | $ | — | ||||||
| Cash paid for taxes | $ | — | $ | — | $ | — | ||||||
| Non-cash investing and financing activities: | ||||||||||||
| Proceeds from issuance of stock received by related party | $ | — | $ | 369,703 | $ | 369,703 | ||||||
| Prepaid stock-based expenses acquired with the merger | $ | 297,064 | $ | — | $ | 297,064 | ||||||
| Deferred finance expenses acquired with the merger | $ | 25,000 | $ | $ | 25,000 | |||||||
| Fixed assets acquired with the merger | $ | 1,984 | $ | — | $ | 1,984 | ||||||
| Accounts payable assumed with the merger | $ | (220,013 | ) | $ | — | $ | (220,013 | ) | ||||
| Due to related party assumed with the merger | $ | (581,324 | ) | $ | — | $ | (581,324 | ) | ||||
| Stock payable assumed with the merger | $ | (87,453 | ) | $ | — | $ | (87,453 | ) | ||||
The accompanying notes are an integral part of these consolidated financial statements.
| F-5 |
(A Development Stage Company)
NOTES TO CONSOLIDATED FINANCIAL STATEMENTS
(AUDITED)
1. DESCRIPTION OF BUSINESS AND HISTORY
Description of business – WMX Group Holdings, Inc., (the "Company" or "WMX") was incorporated on February 11, 2003 in the State of Florida as Smart Kids Group, Inc. On June 11, 2012, the Company changed its name from Smart Kids Group, Inc. to WMX Holdings Group, Inc.
On April 30, 2012, the Company entered into an Agreement and Plan of Merger (the “Merger Agreement”) with WMX Group, Inc., a Nevada corporation ("WMX Private Co."), and SKGI Acquisition Corp., Nevada corporation, and a wholly-owned subsidiary of the Company (“Acquisition Sub”), pursuant to which Acquisition Sub merged with and into WMX Private Co. (the “Merger”) with the filing of the Articles of Merger with the Nevada Secretary of State on May 1, 2012 and became a wholly-owned subsidiary of the Company. In accordance with the terms of the Merger Agreement, at the closing an aggregate of 105,384,609 shares of the Company’s common stock was issued to the holders of WMX Private Co.’s common stock in exchange for their shares of WMX Private Co. WMX Private Co. was incorporated on January 18, 2011 in the Province of New Brunswick, Canada as World Mercantile Exchange, Ltd. and subsequently changed its name to WMX, Group, Inc. and re-domiciled to the State of Nevada.
The Merger has been accounted for as a reverse acquisition transaction for accounting purposes as WMX Private Co. was deemed to be the acquirer, and thus, these consolidated financial statements are the historical financial information and operating results of WMX Private Co. The carrying amounts of the Company’s assets and liabilities prior to the Merger (Smart Kids Group, Inc.) are included in these consolidated financial statements.
On June 20, 2012, the Board of Directors approved a change in fiscal year from December 31 to June 30.
The Company is currently in the development stage as defined in Financial Accounting Standards Board ("FASB") Accounting Standard Codification ("ASC") 915. All activities of the Company to date relate to its organization, share issuances for services and cash and the development of software platforms for e-commerce trade.
2. SUMMARY OF SIGNIFICANT POLICIES
Consolidation – The accompanying consolidated financial statements include the accounts of the Company and its subsidiary. All inter-company balances and transactions have been eliminated. The Company and its subsidiary will be collectively referred to herein as the “Company”.
Use of estimates – The preparation of financial statements in conformity with accounting principles generally accepted in the United States of America requires the Company to make estimates and judgments that affect the reported amounts of assets and liabilities, revenues and expenses, and related disclosures of contingent assets and liabilities. These estimates and judgments are based on historical information, information that is currently available to the Company and on various other assumptions that the Company believes to be reasonable under the circumstances. Actual results could differ from those estimates.
Cash and cash equivalents – Cash and cash equivalents consist of cash and short-term investments with original maturities of less than 90 days. Cash equivalents are placed with high credit quality financial institutions and are primarily in money market funds. The carrying value of those investments approximates fair value.
| F-6 |
2. SUMMARY OF SIGNIFICANT POLICIES – (CONTINUED)
Software development costs – Research and development costs are expensed as incurred. Development costs of computer software to be sold, leased, or otherwise marketed are subject to capitalization beginning when a product’s technological feasibility has been established and ending when a product is available for general release to customers. The Company’s products are released soon after technological feasibility has been established. Therefore, costs incurred subsequent to achievement of technological feasibility are usually not significant, and software development costs have been expensed as incurred. Smart Kids has impaired 100% of the intangible prior to the merger since the intangible was owned by Smart Kids and will not be utilized by WMX after the merger.
Property and equipment - Property and equipment are stated at the lower of cost or fair value. Depreciation is provided on a straight-line basis over the estimated useful lives of the assets, as follows:
| Description | Estimated Life |
| Furniture and equipment | 3 years |
| Computer equipment | 3 years |
The estimated useful lives are based on the nature of the assets as well as current operating strategy and legal considerations such as contractual life. Future events, such as property expansions, property developments, new competition, or new regulations, could result in a change in the manner in which the Company uses certain assets requiring a change in the estimated useful lives of such assets.
Maintenance and repairs that neither materially add to the value of the asset nor appreciably prolong its life are charged to expense as incurred. Gains or losses on disposition of property and equipment are included in the statements of operations. There were no dispositions during the periods presented.
The Company evaluates its property and equipment and other long-lived assets for impairment in accordance with related accounting standards. For assets to be held and used (including projects under development), fixed assets are reviewed for impairment whenever indicators of impairment exist. If an indicator of impairment exists, the Company first groups its assets with other assets and liabilities at the lowest level for which identifiable cash flows are largely independent of the cash flows of other assets and liabilities (the “asset group”). Secondly, the Company estimates the undiscounted future cash flows that are directly associated with and expected to arise from the completion, use and eventual disposition of such asset group. The Company estimates the undiscounted cash flows over the remaining useful life of the primary asset within the asset group. If the undiscounted cash flows exceed the carrying value, no impairment is indicated. If the undiscounted cash flows do not exceed the carrying value, then an impairment is measured based on fair value compared to carrying value, with fair value typically based on a discounted cash flow model. If an asset is still under development, future cash flows include remaining construction costs. The Company has impaired 100% of the fixed asset acquired through the merger with Smart Kids totaling $1,488, since the equipment was owned by Smart Kids and will not be utilized by WMX after the merger.
Income taxes – The Company records income taxes under the asset and liability method, whereby deferred tax assets and liabilities are recognized based on the future tax consequences attributable to temporary differences between the financial statement carrying amounts of existing assets and liabilities and their respective tax bases, and attributable to operating loss and tax credit carryforwards. Accounting standards regarding income taxes requires a reduction of the carrying amounts of deferred tax assets by a valuation allowance, if based on the available evidence, it is more likely than not that such assets will not be realized. Accordingly, the need to establish valuation allowances for deferred tax assets is assessed at each reporting period based on a more-likely-than-not realization threshold. This assessment considers, among other matters, the nature, frequency and severity of current and cumulative losses, forecasts of future profitability, the duration of statutory carryforward periods, the Company’s experience with operating loss and tax credit carryforwards not expiring unused, and tax planning alternatives.
The Company recorded valuation allowances on the net deferred tax assets. Management will reassess the realization of deferred tax assets based on the accounting standards for income taxes each reporting period. To the extent that the financial results of operations improve and it becomes more likely than not that the deferred tax assets are realizable, the Company will be able to reduce the valuation allowance.
| F-7 |
2. SUMMARY OF SIGNIFICANT POLICIES – (CONTINUED)
Significant judgment is required in evaluating the Company’s tax positions and determining its provision for income taxes. During the ordinary course of business, there are many transactions and calculations for which the ultimate tax determination is uncertain. Accounting standards regarding uncertainty in income taxes provides a two-step approach to recognizing and measuring uncertain tax positions. The first step is to evaluate the tax position for recognition by determining if the weight of available evidence indicates it is more likely than not that the position will be sustained on audit, including resolution of related appeals or litigation processes, if any. The second step is to measure the tax benefit as the largest amount which is more than 50% likely, based solely on the technical merits, of being sustained on examinations. The Company considers many factors when evaluating and estimating its tax positions and tax benefits, which may require periodic adjustments and which may not accurately anticipate actual outcomes.
Earnings (loss) per share – Basic earnings (loss) per common share is computed by dividing net income (loss) available to common shareholders by the weighted-average number of shares of common stock outstanding during the period. Diluted earnings per common share is computed by dividing income available to common shareholders by the weighted-average number of shares of common stock outstanding during the period increased to include the number of additional shares of common stock that would have been outstanding if potentially dilutive securities had been issued. There were no potentially dilutive securities outstanding during the periods presented.
Stock-based compensation – The Company accounts for equity instruments issued in exchange for the receipt of goods or services from other than employees in accordance with FASB ASC 718-10 and the conclusions reached by the FASB ASC 505-50. Costs are measured at the estimated fair market value of the consideration received or the estimated fair value of the equity instruments issued, whichever is more reliably measurable. The value of equity instruments issued for consideration other than employee services is determined on the earliest of a performance commitment or completion of performance by the provider of goods or services as defined by FASB ASC 505-50.
Concentration of credit risk – Financial instruments that potentially expose the Company to significant concentrations of credit risk consist principally of cash. The Company places its cash with financial institutions with high-credit ratings.
Reclassification
Certain amounts in the consolidated balance sheets for the years ended June 30, 2012 and 2011 have been reclassified to be consistent with the current year presentation. Common stock of $10,008 in the prior year has now been restated to $118,406 and additional paid-in capital of $661,104 has now been restated to $552,706 in the balance sheets due to the shares issued under the anti-dilution clause have been recorded retroactively similar to a stock split. The reclassification had no impact on the Company’s financial condition, results of operations or cash flows.
Recent Accounting Pronouncements – The Company has evaluated recent pronouncements through Accounting Standards Updates “ASU” 2012-03 and believes that none of them will have a material impact on the Company’s financial position, results of operations or cash flows.
| F-8 |
3. GOING CONCERN
The accompanying financial statements have been prepared on a going concern basis, which contemplates the realization of assets and the satisfaction of liabilities in the normal course of business. The Company has incurred losses since inception and has a cumulative retained deficit of $1,356,842 as of June 30, 2012. The Company requires capital for its contemplated operational and marketing activities. The Company’s ability to raise additional capital through the future issuances of common stock is unknown. The obtainment of additional financing, the successful development of the Company’s contemplated plan of operations, and its transition, ultimately, to the attainment of profitable operations are necessary for the Company to continue operations. The ability to successfully resolve these factors raise substantial doubt about the Company’s ability to continue as a going concern. The financial statements of the Company do not include any adjustments that may result from the outcome of these aforementioned uncertainties.
In order to mitigate the risk related with this uncertainty, the Company plans to issue additional shares of common stock for cash and services during the next 12 months.
4. REVERSE ACQUISITION
On April 30, 2012, Smart Kids completed a reverse acquisition transaction with the shareholders of WMX pursuant to which Smart Kids acquired 100% of the issued and outstanding capital stock of WMX in exchange for an aggregate of 105,384,609 common shares of Smart Kids, which constituted 85% of Smart Kids issued and outstanding capital stock on a fully-diluted basis as of and immediately after the consummation of the reverse acquisition. Prior to the acquisition, Smart Kids was a development stage company and did not meet the definition of a business; therefore, the reverse acquisition of Smart Kids by WMX has been accounted for as a capital transaction. A breakdown of Smart Kids net assets as of April 30, 2012 is as follows:
| ASSETS | ||||
| Current assets | ||||
| Cash | $ | 11,701 | ||
| Prepaid expense | 297,064 | |||
| Total current assets | 308,765 | |||
| Equipment, net of accumulated depreciation | 151 | |||
| Deferred finance fee | 25,000 | |||
| Software development costs, net of accumulated amortization | 1,833 | |||
| $ | 335,749 | |||
| LIABILITIES | ||||
| Accounts payable and accrued liabilities | $ | 220,013 | ||
| Accrued expenses – related parties | 581,324 | |||
| Total current liabilities | $ | 801,337 | ||
| NET ASSETS (DEFICIENCY) | $ | (465,588 | ) |
| F-9 |
4. REVERSE ACQUISITION – (CONTINUED)
On the Form 10-Q posted on the SEC website on May 21, 2012 by Smart Kids for the quarterly period ended March 31, 2012; Smart Kids reported a deficiency in net assets of $(478,018). A reconciliation of Smart Kids net assets from March 31, 2012 to April 30, 2012 is below:
| NET ASSETS (DEFICIENCY) – March 31, 2012 | $ | (478,018 | ) | |
| Net loss for the one month period ended April 30, 2012 | (70,887 | ) | ||
| Common stock payable issued for cash for 8,300,000 shares of common stock | 83,317 | |||
| NET ASSETS (DEFICIENCY) – April 30, 2012 | $ | (465,588 | ) | |
| Condensed Statement of Operations of Smart Kids for the one month period ended April 30, 2012 | ||||
| Operating expenses | ||||
| Legal and professional fees | $ | 11,000 | ||
| Salaries and wages | 31,380 | |||
| General and administrative expense | 8,416 | |||
| Sub-licensing expense | 5,008 | |||
| Impairment of equity investment | 15,083 | |||
| Loss before other expenses | 70,887 | |||
| Net loss | $ | (70,887 | ) |
5. PROPERTY AND EQUIPMENT, NET
Property and equipment consist of the following as of June 30, 2012 and 2011.
| 2012 | 2011 | |||||||
| Furniture and equipment | $ | 2,237 | $ | 1,668 | ||||
| Computer equipment | 1,403 | 1,403 | ||||||
| 3,640 | 3,071 | |||||||
| Less: accumulated depreciation | 1,440 | 234 | ||||||
| $ | 2,200 | $ | 2,837 |
Depreciation expense for the periods ending June 30, 2012 and 2011 was $1,206 and $234, respectively.
| F-10 |
6. INCOME TAXES
The Company provides for income taxes under FASB ASC 740, Accounting for Income Taxes. FASB ASC 740 requires the use of an asset and liability approach in accounting for income taxes. Deferred tax assets and liabilities are recorded based on the differences between the financial statement and tax bases of assets and liabilities and the tax rates in effect currently.
FASB ASC 740 requires the reduction of deferred tax assets by a valuation allowance, if, based on the weight of available evidence, it is more likely than not that some or all of the deferred tax assets will not be realized. In the Company’s opinion, it is uncertain whether they will generate sufficient taxable income in the future to fully utilize the net deferred tax asset. Accordingly, a valuation allowance equal to the deferred tax asset has been recorded. The total deferred tax asset is $119,860 which is calculated by multiplying a 25% estimated tax rate by the cumulative net operating loss (NOL) adjusted for the following items:
| 2012 | 2011 | |||||||
| Net loss for the year | $ | 1,034,344 | $ | 322,498 | ||||
| Adjustments: | ||||||||
| Accrued payroll | (31,352 | ) | (125,000 | ) | ||||
| Bad debt | — | (20,000 | ) | |||||
| Impairment of fixed assets and intangible assets | (1,488 | ) | — | |||||
| Stock-based compensation | (522,064 | ) | (5,600 | ) | ||||
| Tax loss for the year | 479,440 | 171,898 | ||||||
| Estimated effective tax rate | 25 | % | 25 | % | ||||
| Deferred tax asset | $ | 119,860 | $ | 42,975 |
The total valuation allowance is $119,860 and 42,975 as of June 30, 2012 and 2011, respectively. Details are as follows:
| 2012 | 2011 | |||||||
| Deferred tax asset | $ | 119,860 | $ | 42,975 | ||||
| Valuation allowance | (119,860 | ) | (42,975 | ) | ||||
| Current taxes payable | — | — | ||||||
| Provision for income tax | $ | — | $ | — |
Below is a chart showing the estimated corporate federal net operating loss (NOL) and the year in which it will expire.
| Year | Amount | Expiration | ||||||||
| 2011 | $ | 171,898 | 2031 | |||||||
| 2012 | $ | 479,440 | 2032 | |||||||
| F-11 |
7. STOCKHOLDERS’ EQUITY
Preferred Stock – The Company is authorized to issue 40,000,000 shares of $.0001 par value preferred stock. As of June 30, 2012 and 2011, no shares of preferred stock have been issued.
Common Stock - The Company is authorized to issue 1,800,000,000 shares of $.0001 par value common stock. As of June 30, 2012 and 2011, 1,207,385,066 and 1,184,057,738 shares were issued and outstanding.
On January 18, 2011, the date of incorporation, the Company issued 99,039,638 shares of common stock to the founding shareholder and Chief Executive Officer of the Company, as founder shares, for services rendered in the formation of the Company for a total consulting expense of $1,100.
On March 8, 2011, the Company issued 4,500 shares of common stock valued at $1.00 per share or $4,500 as consideration for consulting service related to business development and investor relations. Fair value was determined based on the value of the common stock issued by the Company.
During the year ended June 30, 2011, the Company issued 1,035,500 shares of common stock at $1.00 per share, for cash proceeds of $665,512, net of offering costs totaling $369,988. The Company has received total proceeds of $20,309 as of June 30, 2011, $275,500 were received subsequently during the year ended June 30, 2012, and the remaining balance of $369,703 was received by the GCE Wealth, Inc., an S Corporation owned by the Chief Executive Officer and majority shareholder of the Company as of June 30, 2011. The $369,703 received by GCE Wealth, Inc. has been included in due from related party and recorded as a reduction of stockholders’ equity as of June 30, 2011. The offering costs of $369,988 include $362,639 related to escrow agents fee paid to Robert Glass, the Germany escrow agent, and investor relation services paid to Going Public, Ltd., and $7,349 related to the foreign exchange loss.
During the year ended June 30, 2011, the Company recorded as allowance for subscription receivable of $20,000 for shares issued to shareholder. The $20,000 is recorded in the statement of operations as allowance for subscription received for the period ended June 30, 2011.
During the year ended June 30, 2012, the Company issued 104,971 shares of common stock, for cash proceeds of $33,700, net of offering costs of $40,732. The Company has paid total proceeds of $7,032 at June 30, 2012. The offering costs of $40,732 related to brokerage and specialist trading fees. In connection with the offering, the Company has also issued 5,000,000 shares of common stock to Going Public, Ltd. for services provided to the Company related to public offering on the Frankfurt Stock Exchange. The shares were valued at $1.00 per share and recorded as a reduction of stockholders’ equity
On October 19, 2011, the Company issued 200,000 shares of common stock valued at $1.00 per share or $200,000 as consideration for investor relations. Fair value was determined based on the value of the common stock issued by the Company.
On April 30, 2012, Smart Kids completed a reverse acquisition transaction with the shareholders of WMX pursuant to which Smart Kids acquired 100% of the issued and outstanding capital stock of WMX in exchange for an aggregate of 105,384,609 common shares of Smart Kids, which constituted 85% of Smart Kids issued and outstanding capital stock on a fully-diluted basis as of and immediately after the consummation of the reverse acquisition. Prior to the acquisition, Smart Kids was a development stage company and did not meet the definition of a business, therefore, the reverse acquisition of Smart Kids by WMX has been accounted for as a capital transaction which deems Smart Kids to be acquired by WMX by the issuance of 18,022,357 shares of common shares (issued and outstanding prior to the reverse acquisition) for its net deficiency of $465,588.
| F-12 |
7. STOCKHOLDERS’ EQUITY – (CONTINUED)
On May 22, 2012, Smart Kids entered into Amendment No. 1 to the Merger Agreement (the “Merger Agreement Amendment”) with WMX, and Acquisition Sub, effective April 30, 2012. The Merger Agreement Amendment revises the Merger Agreement to change the shares that will be exchanged in the Merger from 104,042,523 shares of our common stock to 105,384,609 shares of our common stock; and provide for anti-dilution to two of our board members: Mr. Thomas Guerriero, CEO and director, will have a 95% non-dilutive equity interest and Mr. Richard Shergold, formal CEO and director, will have a 1% non-dilutive equity interest in our company. There is no termination or expiration date for the anti-dilutive clause.
On June 5, 2012, the Company issued 950,000,000 shares of common stock to the CEO and the majority shareholder for anti-dilution protection. This transaction has been recorded retroactively similar to a stock split since the shares were issued with no corresponding consideration.
On June 11, 2012, our Board of Directors adopted the 2012 Equity Incentive Plan (the “Plan”). The purpose of the Plan is to attract and retain the best available personnel for positions of substantial responsibility with us, to provide additional incentive to employees, directors and consultants, and to promote our success. Under the Plan, we may issue up to an aggregate total of 55,000,000 incentive or non-qualified options to purchase our common stock. As of June 30, 2012, we have not issued any options under the Plan.
8. Related Party transactions
Advances – During the period from inception (January 18, 2011) to June 30, 2011, GCE Wealth, Inc. (“GCE”), an S Corporation owned by the Chief Executive Officer and majority shareholder of the Company, received net advances from the Company of $195,200. These advances are prohibited transactions under SEC rules. During the year ended June 30, 2012, net advances were paid to the Company of $195,200. The amount due from related party is unsecured, non-interest bearing and have no specific terms of repayment. These advances have been recorded as due from related party and have been classified as a reduction of stockholders’ equity as of June 30, 2012 and 2011. The net advances are as follows:
| 2012 | 2011 | |||||||
| Opening balance | $ | (195,200 | ) | $ | — | |||
| Advances received by the Company from GCE | 49,125 | 9,625 | ||||||
| Expense paid by GCE on behalf of the Company | 926 | 260,679 | ||||||
| Repayment to GCE by the Company | (148,500 | ) | (95,800 | ) | ||||
| Proceeds due from share issuances received by GCE on behalf of the Company | — | (369,704 | ) | |||||
| Accrued salary due to the Company’s Chief Executive Officer and majority shareholder of GCE applied to amount due from | 293,649 | — | ||||||
| Due from related party at June 30, 2012 and 2011 | $ | — | $ | (195,200 | ) |
Employment – On January 18, 2011, the board approved that the Company will compensate the Chief Executive Officer a base salary of $250,000 per annum. The total expense related to this agreement was $250,000 and $125,000 for the periods ended June 30, 2012 and 2011, respectively. As of June 30, 2012 and 2011, $31,352 and $125,000 of total compensation was unpaid and recorded as payable, respectively.
9. SUBSEQUENT EVENTS
On July 1, 2012, the Company received $20,000 in cash in exchange for a common stock payable of 1,500,000 shares of common stock ($0.013 per share).
On August 15, 2012, the Company received $100,000 in cash in exchange for a common stock payable of 13,750,000 shares of common stock ($0.007 per share).
| F-13 |
9. SUBSEQUENT EVENTS – (CONTINUED)
On September 7, 2012, the Company received $50,000 in cash in exchange for a common stock payable of 15,000,000 shares of common stock ($0.003 per share).
On September 12, 2012, the Company issued 42,820,400 shares of common stock to satisfy obligations under share subscription agreements for $379,688 in cash received included $209,688 in the stock payable as of June 30, 2012 and $170,000 from the transactions noted above.
On September 12, 2012, the Company issued 67,631,000 shares in common stock and paid $14,223 in cash to settle accounts payable of $196,973 outstanding on June 30, 2012.
On September 12, 2012, the Company issued 42,500,000 and 11,000,000 shares in common stock to settle amount amounts due to the former CEO and former COO of the Company of $475,558 and $112,184, respectively per debt settlement agreement.
On September 12, 2012, the Company issued 133,978,100 shares of common stock to original investors of the Company for anti-dilution protection. This transaction has been recorded retroactively similar to a stock split since the shares were issued with no corresponding consideration.
| F-14 |
Item 9. Changes In and Disagreements with Accountants on Accounting and Financial Disclosure
No events occurred requiring disclosure under Item 307 and 308 of Regulation S-K during the fiscal year ending June 30, 2012.
Item 9A(T). Controls and Procedures
As required by Rule 13a-15 under the Securities Exchange Act of 1934, we have carried out an evaluation of the effectiveness of our disclosure controls and procedures as of the end of the period covered by this annual report, being June 30, 2012. This evaluation was carried out under the supervision and with the participation of our management, including our Chief Executive Officer and Chief Financial Officer.
Disclosure controls and procedures are controls and other procedures that are designed to ensure that information required to be disclosed in our reports filed or submitted under the Securities Exchange Act of 1934 is recorded, processed, summarized and reported, within the time periods specified in the Securities and Exchange Commission’s rules and forms. Disclosure controls and procedures include controls and procedures designed to ensure that information required to be disclosed in our company’s reports filed under the Securities Exchange Act of 1934 is accumulated and communicated to management, including our Chief Executive Officer and Chief Financial Officer, to allow timely decisions regarding required disclosure.
Based upon that evaluation, including our Chief Executive Officer and Chief Financial Officer, we have concluded that our disclosure controls and procedures were ineffective as of the end of the period covered by this annual report.
Management’s Report on Internal Control over Financial Reporting
Our management is responsible for establishing and maintaining adequate internal control over financial reporting (as defined in Rule 13a-15(f) under the Securities Exchange Act of 1934). Management has assessed the effectiveness of our internal control over financial reporting as of June 30, 2012 based on criteria established in Internal Control-Integrated Framework issued by the Committee of Sponsoring Organizations of the Treadway Commission. As a result of this assessment, management concluded that, as of June 30, 2012, our internal control over financial reporting was not effective. Our management identified the following material weaknesses in our internal control over financial reporting, which are indicative of many small companies with small staff: (i) inadequate segregation of duties and effective risk assessment; and (ii) insufficient written policies and procedures for accounting and financial reporting with respect to the requirements and application of both US GAAP and SEC guidelines.
We plan to take steps to enhance and improve the design of our internal control over financial reporting. During the period covered by this annual report on Form 10-K, we have not been able to remediate the material weaknesses identified above. To remediate such weaknesses, we hope to implement the following changes during our fiscal year ending June 30, 2013: (i) appoint additional qualified personnel to address inadequate segregation of duties and ineffective risk management; and (ii) adopt sufficient written policies and procedures for accounting and financial reporting. The remediation efforts set out in (i) and (ii) are largely dependent upon our securing additional financing to cover the costs of implementing the changes required. If we are unsuccessful in securing such funds, remediation efforts may be adversely affected in a material manner.
This annual report does not include an attestation report of our registered public accounting firm regarding internal control over financial reporting. Management’s report was not subject to attestation by our registered public accounting firm pursuant to an exemption for non-accelerated filers set forth in Section 989G of the Dodd-Frank Wall Street Reform and Consumer Protection Act.
None
| 28 |
PART III
Item 10. Directors, Executive Officers and Corporate Governance
The following information sets forth the names, ages, and positions of our current directors and executive officers as of June 30, 2012.
| Name | Age | Principal Positions With Us |
| Thomas Anthony Guerriero | 35 | Chief Executive Officer and Director |
| Syed Gilani | 36 | President |
| Philip Clark | 49 | Chief Financial Officer |
| Lisa Yakiwchuck | 45 | Chief Operating Officer |
| Anthony Guerriero | 65 | Director of Marketing |
Set forth below is a brief description of the background and business experience of each of our current executive officers and directors.
Thomas Anthony Guerriero. Mr. Thomas Anthony Guerriero has over thirteen years of extensive upper executive experience. Mr. Guerriero has been the Chairman & CEO of WMX Group, Inc since January 2011. Prior to this he was the CEO of Global Wealth Advisors in New York, successfully growing the firm and its assets from 2009 up until the firm’s acquisition 2010-2011. From 2001 until 2009 Mr. Guerriero was an independent financial advisor, utilizing several broker dealer platforms to facilitate his business and clientele. He built both his client book and staff leading up until the launch of Global Wealth Advisors a Registered Investment Advisory Firm. Mr. Guerriero attended Graduate School at Harvard University (2010-2012), holds two Graduate Certificates from Boston University (2009) & the University of Notre Dame (2006). In addition, he has two Bachelor of Art degrees from Fairleigh Dickinson University (1998) & Thomas Edison State (2001). Mr. Guerriero is a published author with "How To Understand & Master The Stock Market" and "Plan For Crisis".
Syed Gilani. Mr. Gilani is the Founder & President from January, 2001 – to Present of Trans-Atlantic Business Solutions Inc. He. Established and presiding over an international business solutions systems provider company to help small and medium scale businesses in achieving their objectives. Providing relentless strategic leadership and vision to the company in designing and developing robust technology based solutions. Lead the start up to serve more than 100 worldwide clients in a short period of one year while continuously increasing the quality standards and customer satisfaction. Work diligently to establish the business without any debt and with higher profitability. Provided strategic vision in designing successful brands of BIZVI.COM, BIZVI Grafix, BIZVI Research, BIZVI Training, WAUTHOR, and upcoming brands of BIZ2O and SUMUSU.
Mr. Gilani has his Masters in Business Administration from the University of Virgin Islands (2004), a Masters in Economics and Management from Lahore School of Economics (1996-98), a Bachelor in Education Punjab University (1995-97), a Bachelor in Economics, Statistics & Mathematics Punjab University (1993-95).
Philip Clark. Mr. Clark is a Chartered Accountant and Certified Public Accountant with over twenty years experience in public accounting. Most recently he has served as the CFO for a publicly traded company American Rare Earths & Material, Corp in the sporting goods and materials application sector for the last three years. From 2005 to 2008, Mr. Clark was a senior manager and partner of Danziger Hochman Partners LLP. From 1992 to 2005, Mr. Clark was a manager, then Partner, and then Managing Partner of Mackay Landau, Chartered Accountants. He has also served as Audit Committee Chair and Director of a Canadian crown corporation. Mr. Clark has experience accounting and auditing SEC registrants, Canadian public companies, government entities and owner managed businesses. He articled with Ernst & Young, Chartered Accountants, and received a Bachelor of Commerce degree (Honours) from McMaster University in 1986.
Lisa Yakiwchuck. Lisa Yakiwchuk currently serves as the Chief Operating Officer for Smart Kids Group Inc. An operations administrator with over 20 years experience in the private and public sector, Ms. Yakiwchuk has worked in a team environment providing assistance with leadership and actively promoting the company’s mission and philosophy.
Ms. Yakiwchuk attended the University of Northern British Columbia taking professional development coursework for Management and Leadership. Ms. Yakiwchuk’s career has been in the social services field and that avocation has led to helping children and families. She has held several Board positions on non-profit agencies dedicated to helping kids as well as being a foster parent to children in need. Being a parent of three children, one of which had special needs, gave Ms. Yakiwchuk the opportunity and desire to learn sound life practices to enhance the quality of life for her children and those around her. Ms. Yakiwchuk is an avid traveler and road trip enthusiast. Mentoring along side an experienced travel agent, she is embarking on the Smart Kids Travel Company to bring vacationing experiences to children, youth and families.
| 29 |
Anthony Guerriero. Mr. Guerriero is currently our director of marketing. He was the former Director of Marketing Earth Thebault, a Division of Earth Color, Parsippany from January 2006 – to December 2008. There he created and managed this dual operation realizing a revenue income of $13 million/year, reducing costs by $1.3 million. His role was to oversee all print Production & Quality Control. He contracted and maintained a client base with companies such as HBO, Sony, Capital One, Bristol Myers, American Express, Person Education, Margraw Hill, BBDO.
Prior to Earth Thebault he was an Executive at Applied Printing Technology, in Moonachie, NJ from 1996 – 2006. There he sold $4 million in business per year, specializing in catalogs, direct mail material, poster reproductions, brochures, and corporate image booklets. He was able to acquire new client accounts with companies such as Saks Fifth Avenue, The Gap, McGraw Hill, and Pearson Education, while retaining existing clients through excellent service. He implemented strategic pricing models to win business from competing print houses. Prior to this he was the President of Glaser Printing Company, in New York, NY from 1982 – 1996. In 1987 transitioned from Production Manager to the President/Owner with the purchase of the company doing a print business from stationery to corporate brochures. Grew the company from $1.5 million in revenue a year to $3.8 Million. Initiated and maintained key accounts with companies such as AT&T, Steinway & Sons, Diners Club, Staten Island University Hospitals, Rosenthal China, and the 96 office printing needs of Drake Bean Morin.
Term of Office
Our Directors are appointed for a one year term to hold office until the next annual general meeting of our shareholders or until removed from office in accordance with our bylaws. Our officers are appointed by our board of directors and hold office until removed by the board.
Family Relationships
Anthony Guerriero and Thomas Guerriero are father and son.
Aside from the above, there are no family relationships between or among the directors, executive officers or persons nominated or chosen by us to become directors or executive officers.
Involvement in Certain Legal Proceedings
To the best of our knowledge, during the past ten years, none of the following occurred with respect to a present or former director, executive officer, or employee: (1) any bankruptcy petition filed by or against any business of which such person was a general partner or executive officer either at the time of the bankruptcy or within two years prior to that time; (2) any conviction in a criminal proceeding or being subject to a pending criminal proceeding (excluding traffic violations and other minor offenses); (3) being subject to any order, judgment or decree, not subsequently reversed, suspended vacated, of any court of competent jurisdiction, permanently or temporarily enjoining, barring, suspending or otherwise limiting his or her involvement in any type of business, securities or banking activities; and (4) being found by a court of competent jurisdiction (in a civil action), the SEC or the Commodities Futures Trading Commission to have violated a federal or state securities or commodities law, and the judgment has not been reversed, suspended or vacated.
| 30 |
Committees of the Board
Our company currently does not have nominating, compensation or audit committees or committees performing similar functions nor does our company have a written nominating, compensation or audit committee charter. Our directors believe that it is not necessary to have such committees, at this time, because the functions of such committees can be adequately performed by the board of directors.
Our company does not have any defined policy or procedural requirements for shareholders to submit recommendations or nominations for directors. The board of directors believes that, given the stage of our development, a specific nominating policy would be premature and of little assistance until our business operations develop to a more advanced level. Our company does not currently have any specific or minimum criteria for the election of nominees to the board of directors and we do not have any specific process or procedure for evaluating such nominees. The board of directors will assess all candidates, whether submitted by management or shareholders, and make recommendations for election or appointment.
A shareholder who wishes to communicate with our board of directors may do so by directing a written request addressed to our Chief Executive Officer, Thomas Guerriero, at the address appearing on the first page of this annual report.
Code of Ethics
As of June 30, 2012, we had not adopted a Code of Ethics for Financial Executives, which would include our principal executive officer, principal financial officer, principal accounting officer or controller, or persons performing similar functions.
Item 11. Executive Compensation
Summary Compensation Table
The table below summarizes all compensation awarded to, earned by, or paid to our former or current executive officers for the fiscal years ended June 30, 2012 and 2011.
| SUMMARY COMPENSATION TABLE | |||||||||
Name and principal position |
Year | Salary ($) | Bonus ($) |
Stock Awards ($) |
Option Awards ($) |
Non-Equity Incentive Plan Compensation ($) |
Nonqualified Deferred Compensation Earnings ($) |
All Other Compensation ($) |
Total ($) |
| Thomas Guerriero, CEO and Director | 2012 2011 |
250,000 125,000 |
0 0 |
0 0 |
0 0 |
0 0 |
0 0 |
0 0 |
250,000 125,000 |
| Syed Gilani, President | 2012 2011 |
0 0 |
0 0 |
0 0 |
0 0 |
0 0 |
0 0 |
0 0 |
0 0 |
| Philip Clark, CFO |
2012 |
0 | 0 | 0 | 0 | 0 | 0 | 7,675(1) | 7,675 |
| Lisa Yakiwchuck, COO | 2012 | 0 | 0 | 0 | 0 | 0 | 0 | 0 | 0 |
| Richard Shergold, Director | 2012 | 6,987 | 0 | 0 | 0 | 0 | 0 | 0 | 6,987 |
Anthony Guerriero, Director of Marketing |
2012 | 0 | 0 | 0 | 0 | 0 | 0 | 0 | 0 |
| (1) | Prior to his appointment as CFO, Mr. Clark invoiced the company $7,675 for accounting work he incurred through a company in which he is a majority shareholder and director. |
| 31 |
Narrative Disclosure to the Summary Compensation Table
On July 1, 2012, the board of directors agreed to compensate our CEO Thomas Guerriero $500,000 per year.
Aside from the foregoing, we have not entered into any employment agreement or consulting agreement with our executive officers. There are no arrangements or plans in which we provide pension, retirement or similar benefits for executive officers.
Although we do not currently compensate our officers, we reserve the right to provide compensation at some time in the future. Our decision to compensate officers depends on the availability of our cash resources with respect to the need for cash to further our business purposes.
Outstanding Equity Awards at Fiscal Year-End
The table below summarizes all unexercised options, stock that has not vested, and equity incentive plan awards for each named executive officer as of June 30, 2012.
| OUTSTANDING EQUITY AWARDS AT FISCAL YEAR-END | |||||||||
| OPTION AWARDS | STOCK AWARDS | ||||||||
| Name | Number of Securities Underlying Unexercised Options (#) Exercisable | Number of Securities Underlying Unexercised Options (#) Unexercisable | Equity Incentive Plan Awards: Number of Securities Underlying Unexercised Unearned Options (#) | Option Exercise Price ($) | Option Expiration Date | Number of Shares or Units of Stock That Have Not Vested (#) | Market Value of Shares or Units of Stock That Have Not Vested ($) |
Equity Incentive Plan Awards: Number of Unearned Shares, Units or Other Rights That Have Not Vested (#) |
Equity Incentive Plan Awards: Market or Payout Value of Unearned Shares, Units or Other Rights That Have Not Vested (#) |
| Thomas Guerriero | - | - | - | - | - | - | - | - | - |
| Syed Gilani | - | - | - | - | - | - | - | - | - |
| Philip Clark | - | - | - | - | - | - | - | - | - |
| Lisa Yakiwchuck | - | - | - | - | - | - | - | - | - |
| Anthony Guerriero | - | - | - | - | - | - | - | - | - |
| 32 |
Item 12. Security Ownership of Certain Beneficial Owners and Management and Related Stockholder Matters
The following table sets forth, as of June 30, 2012, the beneficial ownership of our common stock by each executive officer and director, by each person known by us to beneficially own more than 5% of the our common stock and by the executive officers and directors as a group:
| Title of class | Name and address of beneficial owner (1) | Amount of beneficial ownership | Percent of class (2) |
| Common | Thomas Guerriero | 1,045,613,829 | 87% |
| Common | Syed Gilani | - | |
| Common | Philip Clark | - | |
| Common | Lisa Yakiwchuck | 313,800 | Less than 1% |
| Common | Richard Shergold | 1,335,282 | Less than 1% |
| Common | Anthony Guerriero | - | - |
| Total of All Directors and Executive Officers: | |||
| More Than 5% Beneficial Owners: | |||
| (1) | As used in this table, "beneficial ownership" means the sole or shared power to vote, or to direct the voting of, a security, or the sole or shared investment power with respect to a security (i.e., the power to dispose of, or to direct the disposition of, a security). In addition, for purposes of this table, a person is deemed, as of any date, to have "beneficial ownership" of any security that such person has the right to acquire within 60 days after such date. |
| (2) | The percent of class is based on 1,207,385,066 shares of the Company’s common stock issued and outstanding as of June 30, 2012. |
Item 13. Certain Relationships and Related Transactions, and Director Independence
Item 14. Principal Accounting Fees and Services
Below is the table of Audit Fees (amounts in US$) billed by our auditor in connection with the audit of the Company’s annual financial statements:
Year Ended June 30, |
Audit Services |
Audit Related Fees |
Tax Fees |
Other Fees |
| 2012 | 5,750 | 5,450 | 0 | 0 |
| 2011 | 0 | 0 | 0 | 0 |
| 33 |
PART IV
Item 15. Exhibits, Financial Statements Schedules
| (a) | Financial Statements and Schedules |
The following financial statements and schedules listed below are included in this Form 10-K.
Financial Statements (See Item 8)
| (b) | Exhibits |
| Exhibit Number | Description |
| 3.1 | Articles of Incorporation (1) |
| 3.2 | Bylaws(1) |
| 3.3 | Amendment to Bylaws |
| 31.1 | Certification of Chief Executive Officer pursuant to Securities Exchange Act Rule 13a-14(a)/15d-14(a), as adopted pursuant to Section 302 of the Sarbanes-Oxley Act of 2002 |
| 31.2 | Certification of Chief Financial Officer pursuant to Securities Exchange Act Rule 13a-14(a)/15d-14(a), as adopted pursuant to Section 302 of the Sarbanes-Oxley Act of 2002 |
| 32.1 | Certification of Chief Executive Officer and Chief Financial Officer pursuant to 18 U.S.C. Section 1350, as adopted pursuant to Section 906 of the Sarbanes-Oxley Act of 2002 |
| 101** | The following materials from the Company’s Annual Report on Form 10-K for the year ended June 30, 2012 formatted in Extensible Business Reporting Language (XBRL). |
| (1) | Incorporated by reference to Registration Statement on Form S-1 filed on September 2, 2008 |
| (2) | Incorporated by reference to Current Report on Form 8-K filed on July 26, 2012 |
| 34 |
SIGNATURES
Pursuant to the requirements of Section 13 or 15(d) of the Exchange Act of 1934, the registrant has duly caused this report to be signed on its behalf by the undersigned, thereunto duly authorized.
WMX Group Holdings, Inc.
/s/ Thomas Guerriero
Thomas Guerriero
President, Chief Executive Officer and Director
WMX Group Holdings, Inc.
/s/ Philip Clark
Philip Clark
Chief Financial Officer
Pursuant to the requirements of the Securities Exchange Act of 1934, this report has been signed below by the following persons on behalf of the registrant and in the capacities and on the dates indicated.
/s/ Thomas Guerriero
Thomas Guerriero
President, Chief Executive Officer and Director
| 35 |