Attached files
| file | filename |
|---|---|
| 8-K - 8-K - MARKWEST ENERGY PARTNERS L P | a12-21991_18k.htm |
| EX-99.2 - EX-99.2 - MARKWEST ENERGY PARTNERS L P | a12-21991_1ex99d2.htm |
Exhibit 99.1
|
|
MarkWest Energy Partners Platts NGL Supply, Demand, Pricing and Infrastructure Development Conference September 25, 2012 |
|
|
Forward-Looking Statements This presentation contains forward-looking statements and information. These forward-looking statements, which in many instances can be identified by words like “could,” “may,” “will,” “should,” “expects,” “plans,” “project,” “anticipates,” “believes,” “planned,” “proposed,” “potential,” and other comparable words, regarding future or contemplated results, performance, transactions, or events, are based on MarkWest Energy Partners, L.P. (“MarkWest” and the “Partnership”) current information, expectations and beliefs, concerning future developments and their potential effects on MarkWest. Although MarkWest believes that the expectations reflected in the forward-looking statements are reasonable, it can give no assurance that such expectations will prove to be correct, and actual results, performance, distributions, events or transactions could vary significantly from those expressed or implied in such statements and are subject to a number of uncertainties and risks. Among the factors that could cause results to differ materially are those risks discussed in the periodic reports MarkWest files with the SEC, including its Annual Report on Form 10-K for the year ended December 31, 2011 and its Quarterly Report on Form 10-Q for the quarters ended March 31, 2012 and June 30, 2012. You are urged to carefully review and consider the cautionary statements and other disclosures, including those under the heading “Risk Factors,” made in those documents. If any of the uncertainties or risks develop into actual events or occurrences, or if underlying assumptions prove incorrect, it could cause actual results to vary significantly from those expressed in the presentation, and MarkWest’s business, financial condition, or results of operations could be materially adversely affected. Key uncertainties and risks that may directly affect MarkWest’s performance, future growth, results of operations, and financial condition, include, but are not limited to: Fluctuations and volatility of natural gas, NGL products, and oil prices; A reduction in natural gas or refinery off-gas production which MarkWest gathers, transports, processes, and/or fractionates; A reduction in the demand for the products MarkWest produces and sells; Financial credit risks / failure of customers to satisfy payment or other obligations under MarkWest’s contracts; Effects of MarkWest’s debt and other financial obligations, access to capital, or its future financial or operational flexibility or liquidity; Construction, procurement, and regulatory risks in our development projects; Hurricanes, fires, and other natural and accidental events impacting MarkWest’s operations, and adequate insurance coverage; Terrorist attacks directed at MarkWest facilities or related facilities; Changes in and impacts of laws and regulations affecting MarkWest operations and risk management strategy; and Failure to integrate recent or future acquisitions. 2 |
|
|
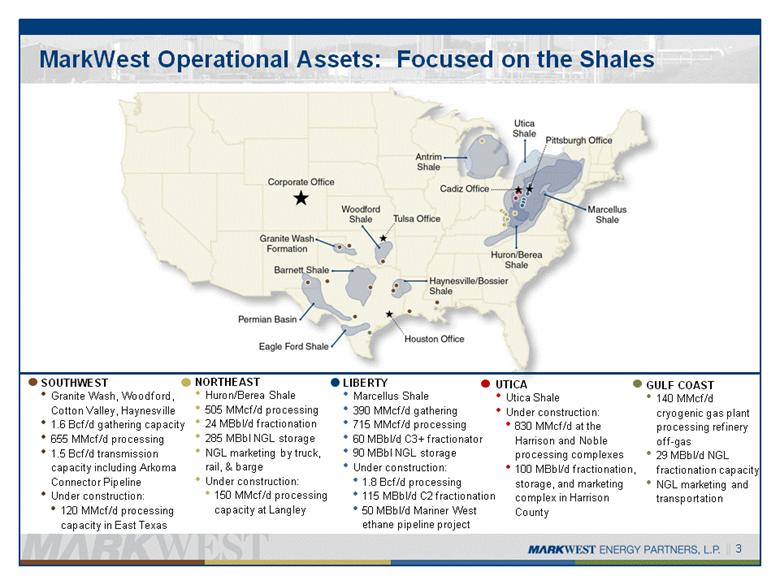
MarkWest Operational Assets: Focused on the Shales UTICA Utica Shale Under construction: 830 MMcf/d at the Harrison and Noble processing complexes 100 MBbl/d fractionation, storage, and marketing complex in Harrison County SOUTHWEST Granite Wash, Woodford, Cotton Valley, Haynesville 1.6 Bcf/d gathering capacity 655 MMcf/d processing 1.5 Bcf/d transmission capacity including Arkoma Connector Pipeline Under construction: 120 MMcf/d processing capacity in East Texas NORTHEAST Huron/Berea Shale 505 MMcf/d processing 24 MBbl/d fractionation 285 MBbl NGL storage NGL marketing by truck, rail, & barge Under construction: 150 MMcf/d processing capacity at Langley LIBERTY Marcellus Shale 390 MMcf/d gathering 715 MMcf/d processing 60 MBbl/d C3+ fractionator 90 MBbl NGL storage Under construction: 1.8 Bcf/d processing 115 MBbl/d C2 fractionation 50 MBbl/d Mariner West ethane pipeline project GULF COAST 140 MMcf/d cryogenic gas plant processing refinery off-gas 29 MBbl/d NGL fractionation capacity NGL marketing and transportation 3 |
|
|
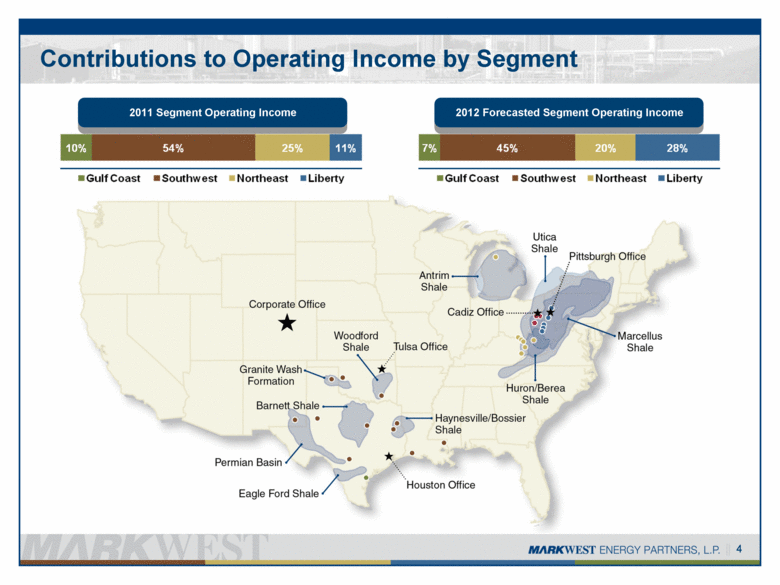
Contributions to Operating Income by Segment 4 2011 Segment Operating Income 2012 Forecasted Segment Operating Income |
|
|
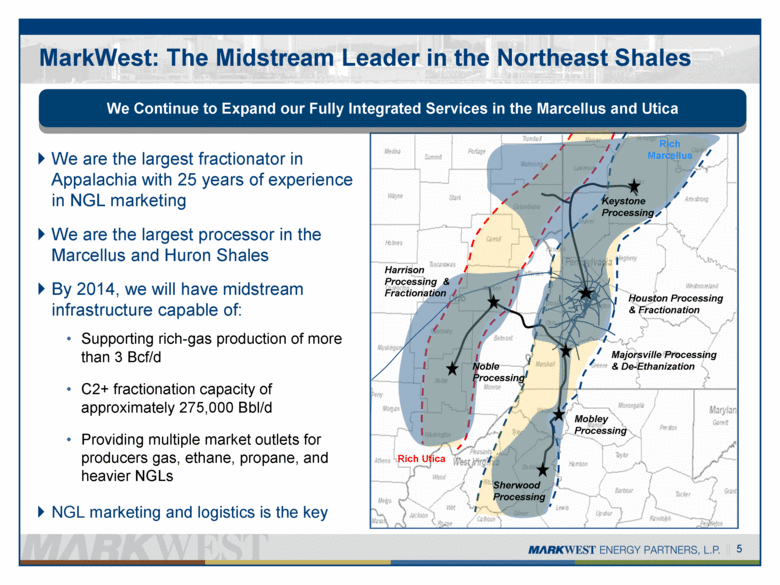
MarkWest: The Midstream Leader in the Northeast Shales We Continue to Expand our Fully Integrated Services in the Marcellus and Utica We are the largest fractionator in Appalachia with 25 years of experience in NGL marketing We are the largest processor in the Marcellus and Huron Shales By 2014, we will have midstream infrastructure capable of: Supporting rich-gas production of more than 3 Bcf/d C2+ fractionation capacity of approximately 275,000 Bbl/d Providing multiple market outlets for producers gas, ethane, propane, and heavier NGLs NGL marketing and logistics is the key 5 Majorsville Processing & De-Ethanization Mobley Processing Houston Processing & Fractionation Noble Processing Harrison Processing & Fractionation Keystone Processing Rich Utica Rich Marcellus Sherwood Processing |
|
|
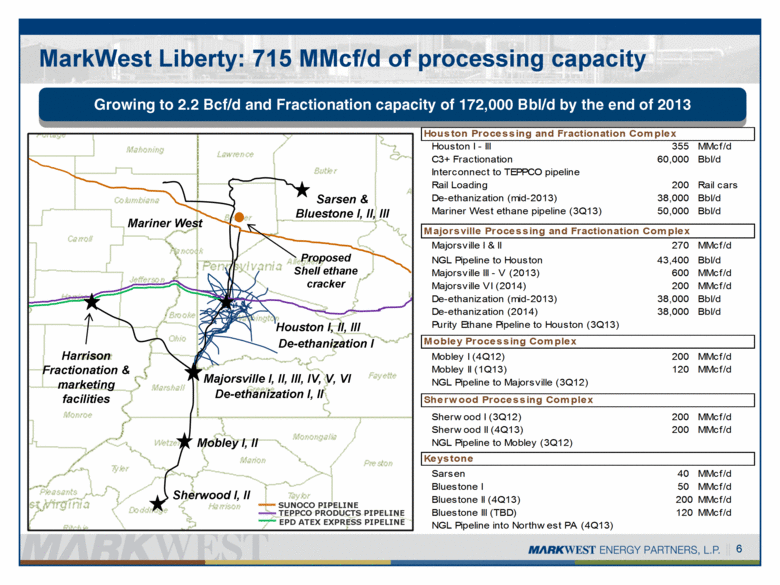
MarkWest Liberty: 715 MMcf/d of processing capacity TEPPCO PRODUCTS PIPELINE SUNOCO PIPELINE EPD ATEX EXPRESS PIPELINE 6 Growing to 2.2 Bcf/d and Fractionation capacity of 172,000 Bbl/d by the end of 2013 Mariner West De-ethanization I Houston I, II, III De-ethanization I, II Majorsville I, II, III, IV, V, VI Sarsen & Bluestone I, II, III Sherwood I, II Mobley I, II Harrison Fractionation & marketing facilities Proposed Shell ethane cracker Houston Processing and Fractionation Complex Houston I - III 355 MMcf/d C3+ Fractionation 60,000 Bbl/d Interconnect to TEPPCO pipeline Rail Loading 200 Rail cars De-ethanization (mid-2013) 38,000 Bbl/d Mariner West ethane pipeline (3Q13) 50,000 Bbl/d Majorsville Processing and Fractionation Complex Majorsville I & II 270 MMcf/d NGL Pipeline to Houston 43,400 Bbl/d Majorsville III - V (2013) 600 MMcf/d Majorsville VI (2014) 200 MMcf/d De-ethanization (mid-2013) 38,000 Bbl/d De-ethanization (2014) 38,000 Bbl/d Purity Ethane Pipeline to Houston (3Q13) Mobley Processing Complex Mobley I (4Q12) 200 MMcf/d Mobley II (1Q13) 120 MMcf/d NGL Pipeline to Majorsville (3Q12) Sherwood Processing Complex Sherwood I (3Q12) 200 MMcf/d Sherwood II (4Q13) 200 MMcf/d NGL Pipeline to Mobley (3Q12) Keystone Sarsen 40 MMcf/d Bluestone I 50 MMcf/d Bluestone II (4Q13) 200 MMcf/d Bluestone III (TBD) 120 MMcf/d NGL Pipeline into Northwest PA (4Q13) |
|
|
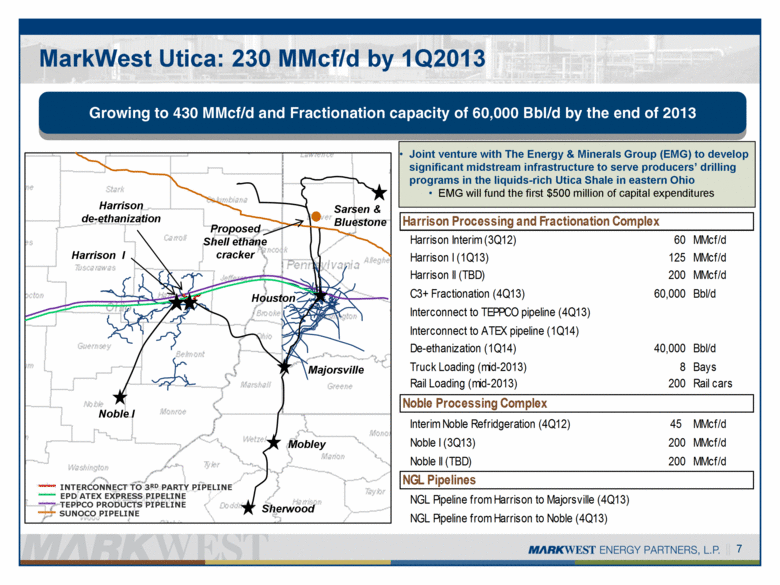
MarkWest Utica: 230 MMcf/d by 1Q2013 7 Growing to 430 MMcf/d and Fractionation capacity of 60,000 Bbl/d by the end of 2013 Mobley Sherwood Houston Majorsville Noble I Harrison de-ethanization Proposed Shell ethane cracker TEPPCO PRODUCTS PIPELINE EPD ATEX EXPRESS PIPELINE Sarsen & Bluestone INTERCONNECT TO 3RD PARTY PIPELINE Harrison I SUNOCO PIPELINE Joint venture with The Energy & Minerals Group (EMG) to develop significant midstream infrastructure to serve producers’ drilling programs in the liquids-rich Utica Shale in eastern Ohio EMG will fund the first $500 million of capital expenditures Harrison Processing and Fractionation Complex Harrison Interim (3Q12) 60 MMcf/d Harrison I (1Q13) 125 MMcf/d Harrison II (TBD) 200 MMcf/d C3+ Fractionation (4Q13) 60,000 Bbl/d Interconnect to TEPPCO pipeline (4Q13) Interconnect to ATEX pipeline (1Q14) De-ethanization (1Q14) 40,000 Bbl/d Truck Loading (mid-2013) 8 Bays Rail Loading (mid-2013) 200 Rail cars Noble Processing Complex Interim Noble Refridgeration (4Q12) 45 MMcf/d Noble I (3Q13) 200 MMcf/d Noble II (TBD) 200 MMcf/d NGL Pipelines NGL Pipeline from Harrison to Majorsville (4Q13) NGL Pipeline from Harrison to Noble (4Q13) |
|
|
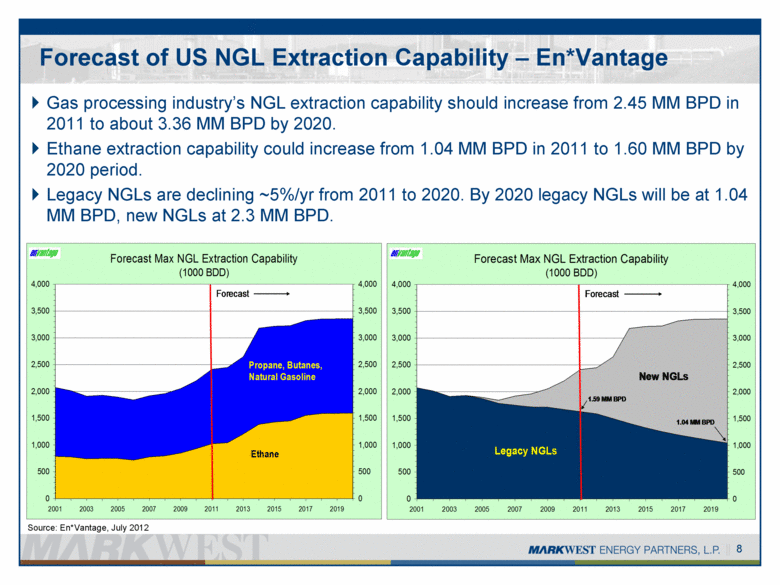
Forecast of US NGL Extraction Capability – En*Vantage Gas processing industry’s NGL extraction capability should increase from 2.45 MM BPD in 2011 to about 3.36 MM BPD by 2020. Ethane extraction capability could increase from 1.04 MM BPD in 2011 to 1.60 MM BPD by 2020 period. Legacy NGLs are declining ~5%/yr from 2011 to 2020. By 2020 legacy NGLs will be at 1.04 MM BPD, new NGLs at 2.3 MM BPD. 8 Source: En*Vantage, July 2012 Forecast Max NGL Extraction Capability (1000 BDD) 0 500 1,000 1,500 2,000 2,500 3,000 3,500 4,000 2001 2003 2005 2007 2009 2011 2013 2015 2017 2019 0 500 1,000 1,500 2,000 2,500 3,000 3,500 4,000 Propane, Butanes, Natural Gasoline Ethane Forecast Forecast Max NGL Extraction Capability (1000 BDD) 0 500 1,000 1,500 2,000 2,500 3,000 3,500 4,000 2001 2003 2005 2007 2009 2011 2013 2015 2017 2019 0 500 1,000 1,500 2,000 2,500 3,000 3,500 4,000 Forecast Legacy NGLs New NGLs 1.59 MM BPD 1.04 MM BPD |
|
|
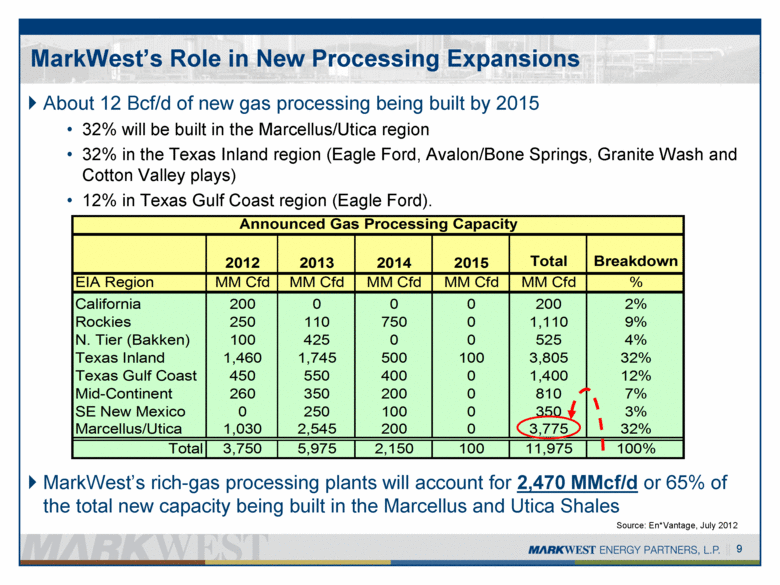
MarkWest’s Role in New Processing Expansions About 12 Bcf/d of new gas processing being built by 2015 32% will be built in the Marcellus/Utica region 32% in the Texas Inland region (Eagle Ford, Avalon/Bone Springs, Granite Wash and Cotton Valley plays) 12% in Texas Gulf Coast region (Eagle Ford). MarkWest’s rich-gas processing plants will account for 2,470 MMcf/d or 65% of the total new capacity being built in the Marcellus and Utica Shales Source: En*Vantage, July 2012 9 2012 2013 2014 2015 Total Breakdown EIA Region MM Cfd MM Cfd MM Cfd MM Cfd MM Cfd % California 200 0 0 0 200 2% Rockies 250 110 750 0 1,110 9% N. Tier (Bakken) 100 425 0 0 525 4% Texas Inland 1,460 1,745 500 100 3,805 32% Texas Gulf Coast 450 550 400 0 1,400 12% Mid-Continent 260 350 200 0 810 7% SE New Mexico 0 250 100 0 350 3% Marcellus/Utica 1,030 2,545 200 0 3,775 32% Total 3,750 5,975 2,150 100 11,975 100% Announced Gas Processing Capacity |
|
|
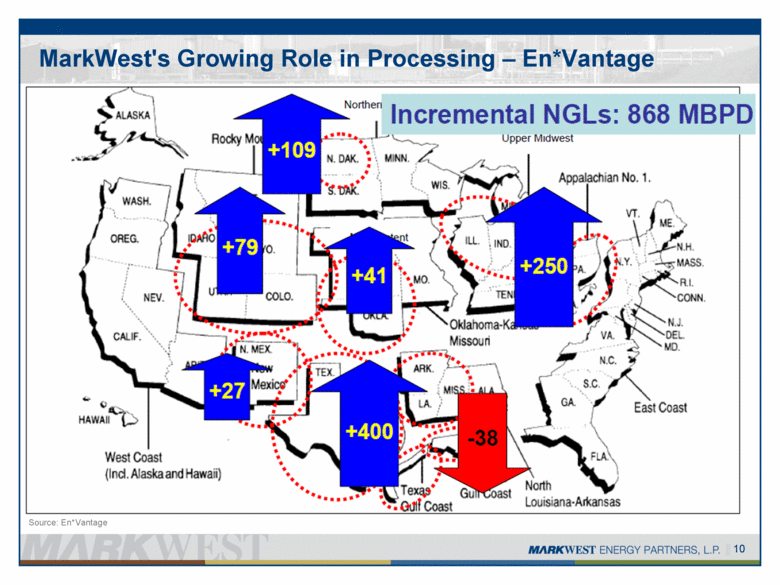
10 MarkWest's Growing Role in Processing – En*Vantage Source: En*Vantage |
|
|
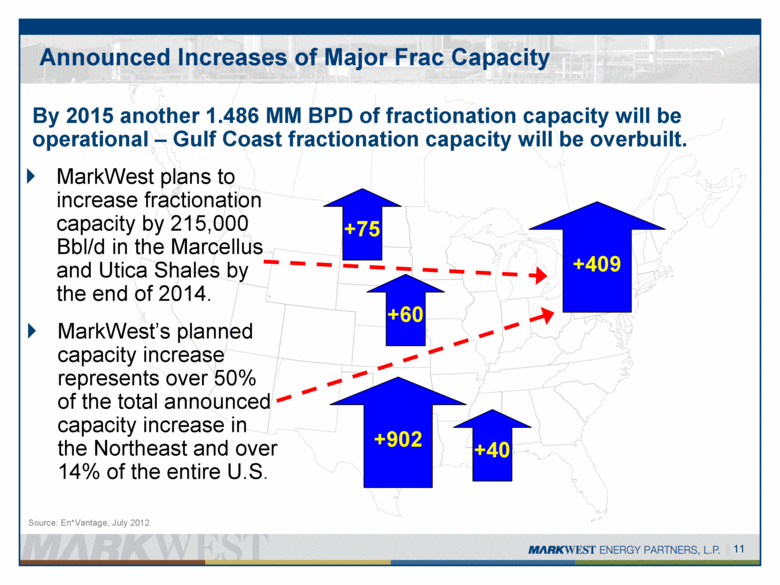
11 Announced Increases of Major Frac Capacity Source: En*Vantage, July 2012 +60 +902 +40 +409 By 2015 another 1.486 MM BPD of fractionation capacity will be operational – Gulf Coast fractionation capacity will be overbuilt. +75 MarkWest plans to increase fractionation capacity by 215,000 Bbl/d in the Marcellus and Utica Shales by the end of 2014. MarkWest’s planned capacity increase represents over 50% of the total announced capacity increase in the Northeast and over 14% of the entire U.S. |
|
|
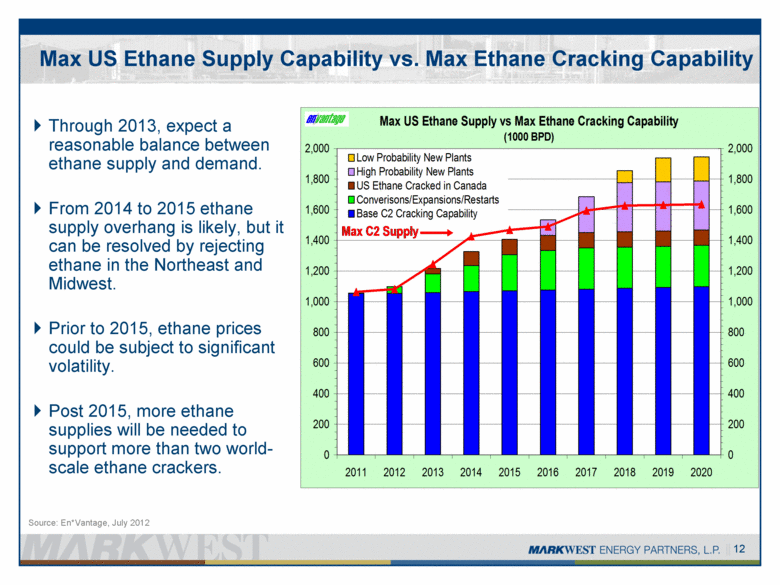
Max US Ethane Supply Capability vs. Max Ethane Cracking Capability Through 2013, expect a reasonable balance between ethane supply and demand. From 2014 to 2015 ethane supply overhang is likely, but it can be resolved by rejecting ethane in the Northeast and Midwest. Prior to 2015, ethane prices could be subject to significant volatility. Post 2015, more ethane supplies will be needed to support more than two world-scale ethane crackers. Source: En*Vantage, July 2012 12 Max US Ethane Supply vs Max Ethane Cracking Capability (1000 BPD) 0 200 400 600 800 1,000 1,200 1,400 1,600 1,800 2,000 2011 2012 2013 2014 2015 2016 2017 2018 2019 2020 0 200 400 600 800 1,000 1,200 1,400 1,600 1,800 2,000 Low Probability New Plants High Probability New Plants US Ethane Cracked in Canada Converisons/Expansions/Restarts Base C2 Cracking Capability Max C2 Supply |
|
|
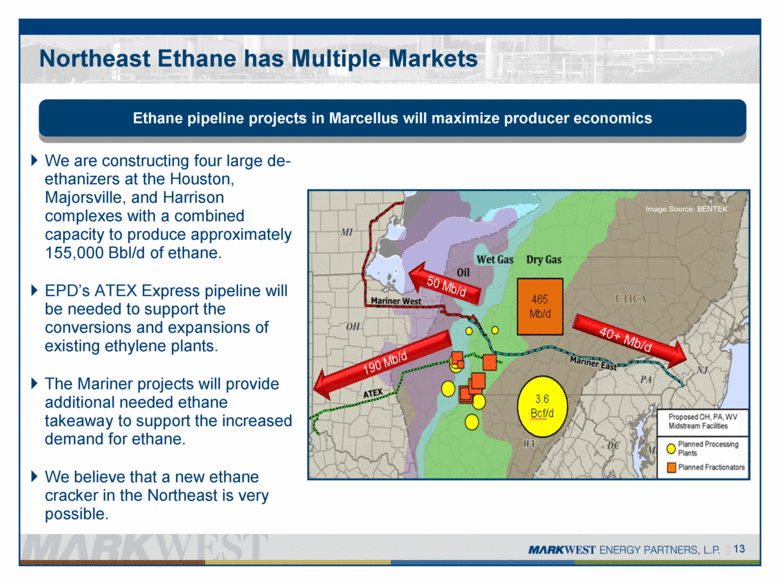
Northeast Ethane has Multiple Markets We are constructing four large de-ethanizers at the Houston, Majorsville, and Harrison complexes with a combined capacity to produce approximately 155,000 Bbl/d of ethane. EPD’s ATEX Express pipeline will be needed to support the conversions and expansions of existing ethylene plants. The Mariner projects will provide additional needed ethane takeaway to support the increased demand for ethane. We believe that a new ethane cracker in the Northeast is very possible. Ethane pipeline projects in Marcellus will maximize producer economics Image Source: BENTEK 40+ Mb/d 13 |
|
|
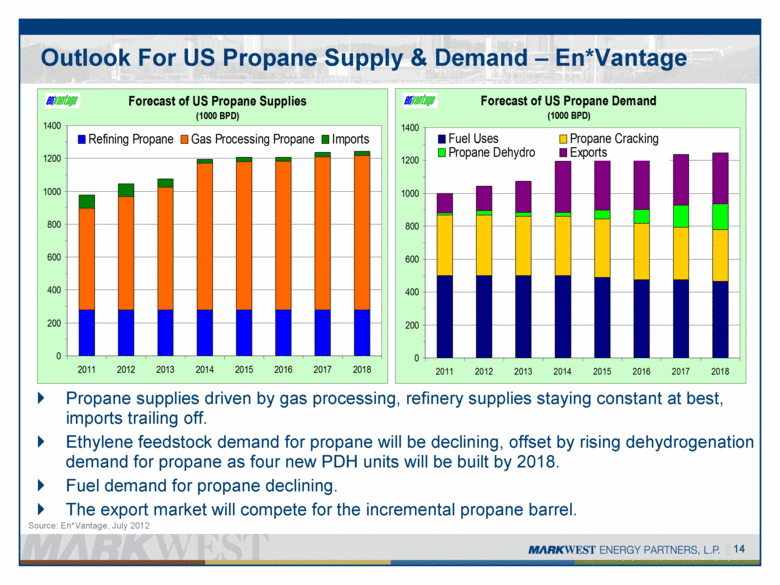
Outlook For US Propane Supply & Demand – En*Vantage Propane supplies driven by gas processing, refinery supplies staying constant at best, imports trailing off. Ethylene feedstock demand for propane will be declining, offset by rising dehydrogenation demand for propane as four new PDH units will be built by 2018. Fuel demand for propane declining. The export market will compete for the incremental propane barrel. Source: En*Vantage, July 2012 14 Forecast of US Propane Supplies (1000 BPD) 0 200 400 600 800 1000 1200 1400 2011 2012 2013 2014 2015 2016 2017 2018 Refining Propane Gas Processing Propane Imports Forecast of US Propane Demand (1000 BPD) 0 200 400 600 800 1000 1200 1400 2011 2012 2013 2014 2015 2016 2017 2018 Fuel Uses Propane Cracking Propane Dehydro Exports |
|
|
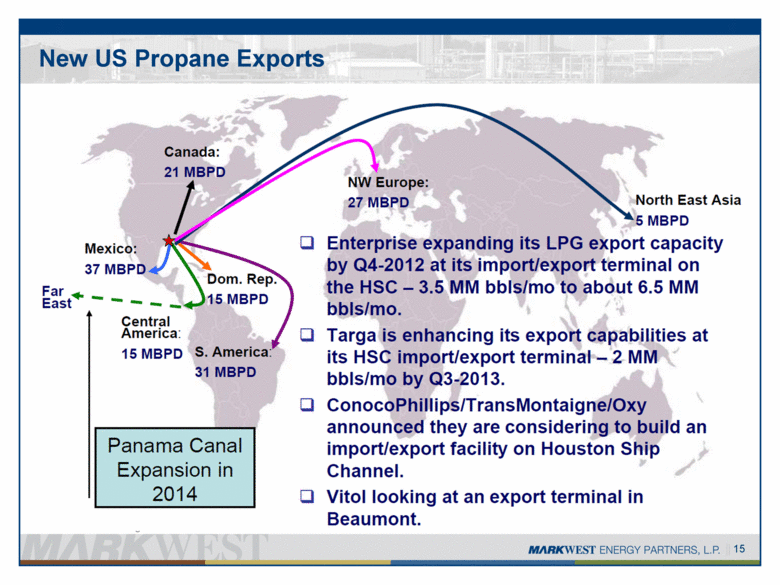
15 New US Propane Exports Source: En*Vantage |
|
|
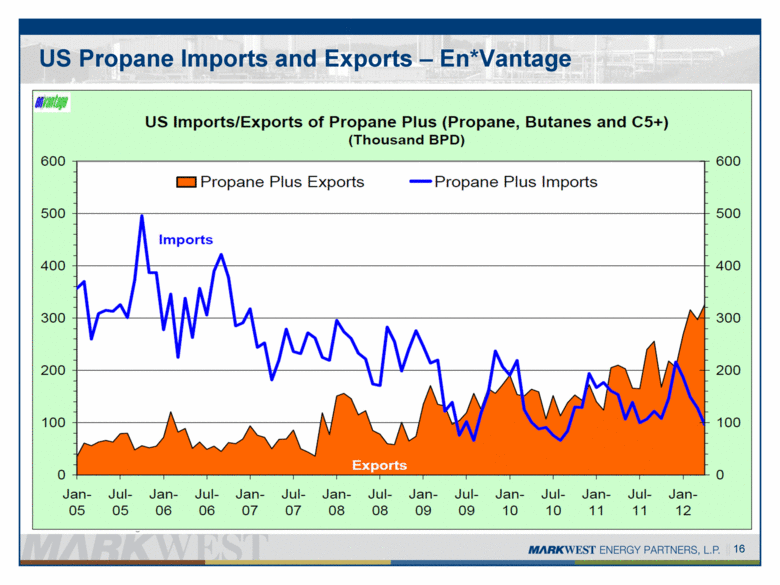
16 US Propane Imports and Exports – En*Vantage Source: En*Vantage |
|
|
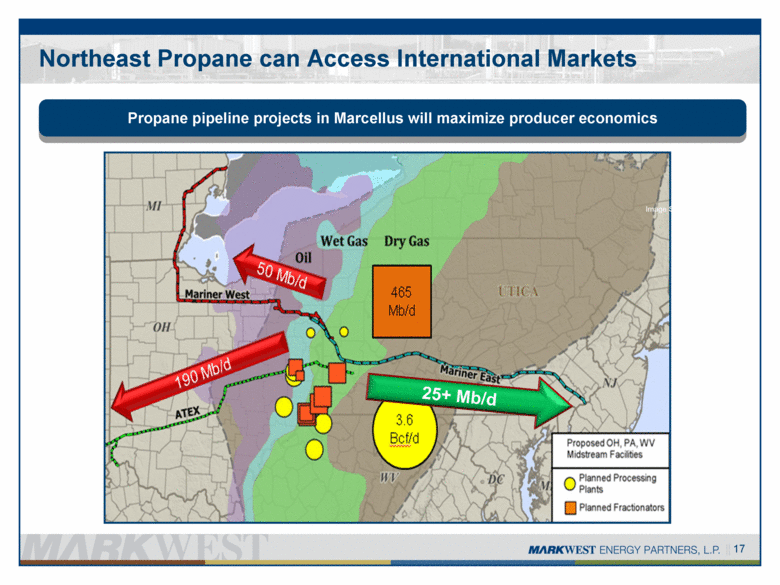
Northeast Propane can Access International Markets Propane pipeline projects in Marcellus will maximize producer economics Image Source: BENTEK 25+ Mb/d 17 |
|
|
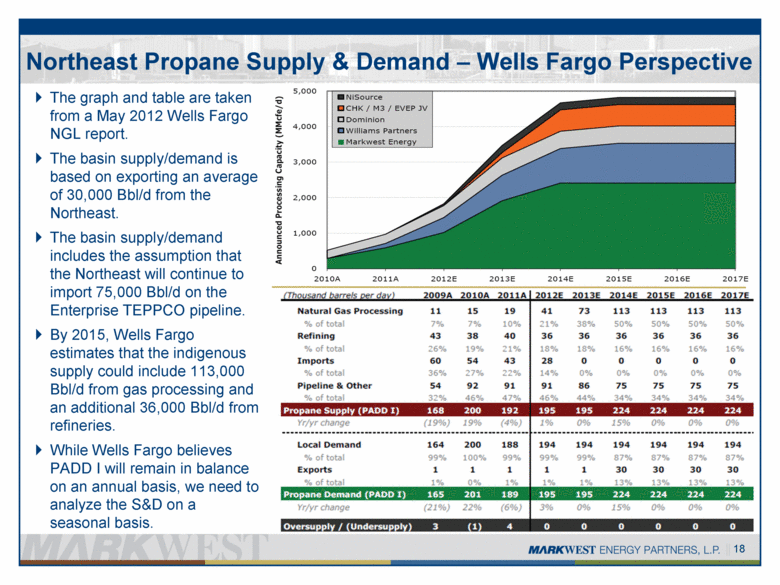
Northeast Propane Supply & Demand – Wells Fargo Perspective The graph and table are taken from a May 2012 Wells Fargo NGL report. The basin supply/demand is based on exporting an average of 30,000 Bbl/d from the Northeast. The basin supply/demand includes the assumption that the Northeast will continue to import 75,000 Bbl/d on the Enterprise TEPPCO pipeline. By 2015, Wells Fargo estimates that the indigenous supply could include 113,000 Bbl/d from gas processing and an additional 36,000 Bbl/d from refineries. While Wells Fargo believes PADD I will remain in balance on an annual basis, we need to analyze the S&D on a seasonal basis. 18 |
|
|
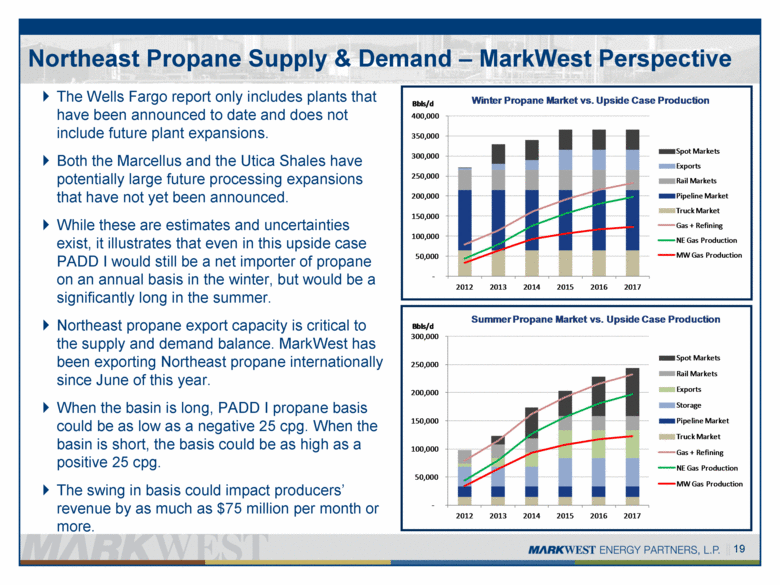
Northeast Propane Supply & Demand – MarkWest Perspective The Wells Fargo report only includes plants that have been announced to date and does not include future plant expansions. Both the Marcellus and the Utica Shales have potentially large future processing expansions that have not yet been announced. While these are estimates and uncertainties exist, it illustrates that even in this upside case PADD I would still be a net importer of propane on an annual basis in the winter, but would be a significantly long in the summer. Northeast propane export capacity is critical to the supply and demand balance. MarkWest has been exporting Northeast propane internationally since June of this year. When the basin is long, PADD I propane basis could be as low as a negative 25 cpg. When the basin is short, the basis could be as high as a positive 25 cpg. The swing in basis could impact producers’ revenue by as much as $75 million per month or more. 19 - 50,000 100,000 150,000 200,000 250,000 300,000 350,000 400,000 2012 2013 2014 2015 2016 2017 Bbls/d Winter Propane Market vs. Upside Case Production Spot Markets Exports Rail Markets Pipeline Market Truck Market Gas + Refining NE Gas Production MW Gas Production - 50,000 100,000 150,000 200,000 250,000 300,000 2012 2013 2014 2015 2016 2017 Bbls/d Summer Propane Market vs. Upside Case Production Spot Markets Rail Markets Exports Storage Pipeline Market Truck Market Gas + Refining NE Gas Production MW Gas Production |
|
|
1515 ARAPAHOE STREET TOWER 1, SUITE 1600 DENVER, COLORADO 80202 PHONE: 303-925-9200 INVESTOR RELATIONS: 866-858-0482 EMAIL: INVESTORRELATIONS@MARKWEST.COM WEBSITE: WWW.MARKWEST.COM |

