Attached files
| file | filename |
|---|---|
| 8-K - FORM 8-K - EXELON GENERATION CO LLC | d414080d8k.htm |
Exhibit 99.1

To the Financial Community,
The Exelon Fact Book is intended to provide historical financial and operating information to assist in the analysis of Exelon and its operating companies. On March 12, 2012, Exelon and Constellation completed the merger of the two companies. On pages 2 through 13 (section 1), we present a snapshot of the business of Exelon Corporation after the close of the merger. The remainder of the book (sections 2 and 3) presents information in its historical form prior to the completion of the merger. Please refer to the SEC filings of Exelon and its subsidiaries, including the annual Form 10-K and quarterly Form 10-Q, of Exelon and its subsidiaries for more comprehensive financial statements and information.
For more information about Exelon and to send e-mail inquiries, visit our website at www.exeloncorp.com.
| Investor Information | Stock Symbol: EXC | |
| Exelon Corporation |
Common stock is listed on the | |
| Investor Relations |
New York and Chicago stock exchanges. | |
| 10 South Dearborn Street |
||
| Chicago, IL 60603 |
||
| 312.394.2345 |
||
| 312.394.8941 (fax) |
Information in this Fact Book is current as of July 31, 2012 unless otherwise noted.
This publication contains certain forward-looking statements within the meaning of the Private Securities Litigation Reform Act of 1995, that are subject to risks and uncertainties. The factors that could cause actual results to differ materially from the forward-looking statements made by Exelon Corporation, Commonwealth Edison Company, PECO Energy Company, Baltimore Gas and Electric Company and Exelon Generation Company, LLC (Registrants) include those factors discussed herein, as well as the items discussed in (1) Exelon’s 2011 Annual Report on Form 10-K in (a) ITEM 1A. Risk Factors, (b) ITEM 7. Management’s Discussion and Analysis of Financial Condition and Results of Operations and (c) ITEM 8. Financial Statements and Supplementary Data: Note 18; (2) Constellation Energy Group’s 2011 Annual Report on Form 10-K in (a) ITEM 1A. Risk Factors, (b) ITEM 7. Management’s Discussion and Analysis of Financial Condition and Results of Operations and (c) ITEM 8. Financial Statements and Supplementary Data: Note 12; (3) the Registrant’s Second Quarter 2012 Quarterly Report on Form 10-Q in (a) Part II, Other Information, ITEM 1A. Risk Factors; (b) Part 1, Financial Information, ITEM 2. Management’s Discussion and Analysis of Financial Condition and Results of Operations and (c) Part I, Financial Information, ITEM 1. Financial Statements: Note 16; and (4) other factors discussed in filings with the SEC by the Registrants. Readers are cautioned not to place undue reliance on these forward-looking statements, which apply only as of the date of this publication. None of the Registrants undertakes any obligation to publicly release any revision to its forward-looking statements to reflect events or circumstances after the date of this publication.
Exelon at a Glance
Company Profile
Headquartered in Chicago, Exelon a leading competitive energy provider, with operations and business activities in 47 states, the District of Columbia and Canada. The company is the largest competitive U.S. power generator, with approximately 35,000(a) megawatts of owned capacity comprising one of the nation’s cleanest and lowest-cost power generation fleets. Constellation, Exelon’s competitive retail and wholesale energy business, provides energy products and services to approximately 100,000 business and public sector customers and approximately 1 million residential customers. Exelon’s utilities deliver electricity and natural gas to more than 6.6 million customers in central Maryland (BGE), northern Illinois (ComEd) and southeastern Pennsylvania (PECO).
Our Vision: Performance that drives progress
At Exelon, we believe that our high-performance energy is the engine of progress. Our commitment to excellence in everything we do means that we are driven to learn and grow, challenging ourselves to constantly adapt, enhance and advance. Every day we focus on maximizing the potential of energy. Safely. Reliably. Sustainably. We vigorously compete to give our customers greater choice and value, and drive innovations that help businesses function more effectively and help people live better. Our end-to-end perspective across the energy business, coupled with our ingenuity and commitment, gives us the insight to seize the opportunities of today, while maintaining the focus and long-term view to tackle the challenges of tomorrow. We make energy work harder because we believe that clean, affordable energy is the key to a brighter, more sustainable future – where our customers succeed, our communities thrive and our nation prospers.
Our Values
We are dedicated to safety.
We actively pursue excellence.
We innovate to better serve our customers.
We act with integrity and are accountable to our communities and the environment.
We succeed as an inclusive and diverse team.
Quick Facts: Exelon and Constellation Combined for 2011
| $32.7 billion in operating revenues
$74.5 billion in assets
6.6 million electric customers
1.2 million gas customers |
~27,000 employees
7,350 circuit miles of electric transmission lines
~35,000 MW U.S. generating capacity |
164 terawatt-hours of electric load served
372 billion cubic feet of natural gas load served
$2.10 current annual dividend rate per share(b) |
| (a) | Excludes Maryland coal assets divested in 2012. |
| (b) | Represents Exelon’s annual dividend both before and after the Constellation merger. Dividends are subject to declaration by the board of directors each quarter. |
2
Company Overview


|

|
| ||
| Energy Generation | Competitive Energy Sales | Transmission & Delivery | ||
|
Exelon Generation is the No. 1 competitive power generator in the nation, with owned generating assets totaling approximately 35,000(a) megawatts. With strong positions in the Midwest, Mid-Atlantic, Texas and California, Exelon is the largest owner and operator of nuclear plants in the United States and maintains a growing renewable energy development business headquartered in Baltimore. |
Constellation, headquartered in Baltimore, is a leading competitive wholesale and retail supplier of power, natural gas and energy products and services for homes and businesses across the continental United States and in the Canadian provinces of Alberta, British Columbia and Ontario. Constellation’s retail business serves more than 100,000 business and public sector customers, including more than two-thirds of the Fortune 100, and approximately 1 million residential customers. The company is among the market leaders in commercial solar installations, as well as energy efficiency and load response products and services. |
Exelon’s delivery companies – BGE, ComEd, and PECO – work hard to keep the lights on and the gas flowing for approximately 6.6 million customers.
Baltimore Gas and Electric Company (BGE) is a regulated electricity transmission and distribution company and natural gas distribution company with a combined service area encompassing Baltimore City and all or part of 10 central Maryland counties. BGE serves approximately 1.2 million electric customers in a 2,300-square-mile territory and approximately 650,000 natural gas customers in an 800-square-mile territory.
Commonwealth Edison Company (ComEd) is a regulated electricity transmission and delivery company with a service area in northern Illinois, including the City of Chicago, of approximately 11,400 square miles and an estimated population of 9.3 million. ComEd has approximately 3.8 million customers.
PECO Energy Company (PECO) is a regulated electricity transmission and distribution company and natural gas distribution company with a combined service area in southeastern Pennsylvania, including the City of Philadelphia, of approximately 2,100 square miles and an estimated population of 4.0 million. PECO has approximately 1.6 million electric customers and 490,000 natural gas customers. | ||
| Our Goals | ||||
| • Keep the lights on and the gas flowing |
||||
| • Run the generation fleet at world class levels |
||||
| • Foster a work environment that is safe, productive, learning-focused and engaging |
||||
| • Capitalize on clean energy as a competitive advantage |
||||
| • Build sustained value through disciplined financial management |
||||
| • Be a top-tier competitor in our key markets |
||||
| • Advance competitive markets |
||||
|
(a) Excludes Maryland coal assets divested in 2012. |
||||


3
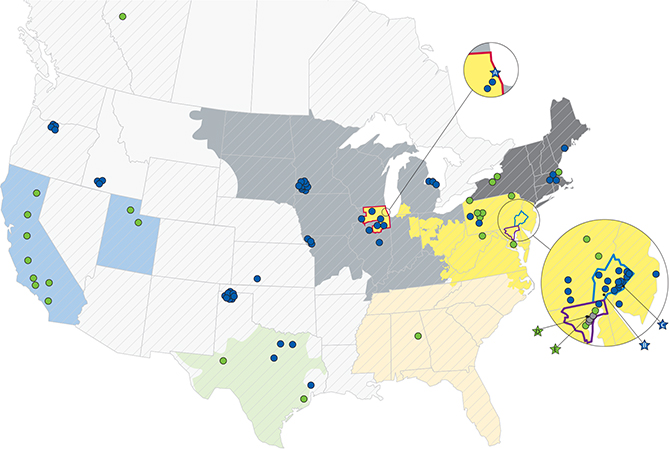
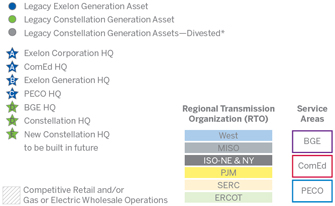
Exelon Service Area and Generation Fuel Mix
Exelon Service Area and Selected Generation Assets as of June 30, 2012
2011 Generation Fuel Mix
Exelon & Constellation – Ownership Equity
4
Generation Capacity
Owned Generation (in MWs) as of December 31, 2011(a)
| Exelon | Constellation | Total | ||||||||||
| Nuclear(b) |
17,115 | 1,925 | 19,040 | |||||||||
| Fossil |
5,890 | 9,351 | 15,241 | |||||||||
| Renewables |
2,539 | 475 | 3,014 | |||||||||
|
|
|
|
|
|
|
|||||||
| Total Owned Generation |
25,544 | 11,751 | 37,295 | |||||||||
|
|
|
|
|
|
|
|||||||
Contracted Generation (in MWs) as of December 31, 2011(a)
| 2012 | 2013 | 2014 | ||||||||||
| ERCOT |
||||||||||||
| Oil/Gas |
1,052 | 1,052 | 885 | |||||||||
| Renewables |
203 | 203 | 203 | |||||||||
|
|
|
|
|
|
|
|||||||
| Total |
1,255 | 1,255 | 1,088 | |||||||||
| Mid-Atlantic |
||||||||||||
| Nuclear(c) |
725 | 435 | 218 | |||||||||
| Oil/Gas |
695 | 695 | 695 | |||||||||
| Renewables |
208 | 176 | 176 | |||||||||
|
|
|
|
|
|
|
|||||||
| Total |
1,628 | 1,306 | 1,089 | |||||||||
| Midwest |
||||||||||||
| Coal |
1,158 | 1,158 | — | |||||||||
| Oil/Gas |
1,932 | 1,157 | 1,157 | |||||||||
| Renewables |
814 | 666 | 612 | |||||||||
|
|
|
|
|
|
|
|||||||
| Total |
3,904 | 2,981 | 1,769 | |||||||||
| NEPOOL |
||||||||||||
| Oil/Gas |
620 | 620 | 620 | |||||||||
| Renewables |
41 | 17 | 17 | |||||||||
|
|
|
|
|
|
|
|||||||
| Total |
661 | 637 | 637 | |||||||||
| New York |
||||||||||||
| Nuclear(c) |
882 | 314 | 107 | |||||||||
| Renewables |
27 | 27 | — | |||||||||
|
|
|
|
|
|
|
|||||||
| Total |
909 | 342 | 107 | |||||||||
| South/West/Canada |
||||||||||||
| Oil/Gas |
3,184 | 3,184 | 3,184 | |||||||||
| Renewables |
153 | 153 | 153 | |||||||||
|
|
|
|
|
|
|
|||||||
| Total |
3,337 | 3,337 | 3,337 | |||||||||
|
|
|
|
|
|
|
|||||||
| Total Contracted Generation |
11,694 | 9,858 | 8,027 | |||||||||
|
|
|
|
|
|
|
|||||||
| (a) | Represents owned and contracted generation capacity for legacy Exelon and legacy Constellation as of 12/31/11. |
| (b) | Owned generating capacity figures reflect Constellation’s 50.01% equity interest in Constellation Energy Nuclear Group (CENG), which owns and operates the Calvert Cliffs, Nine Mile Point, and R.E. Ginna nuclear generating stations. |
| (c) | Constellation has a PPA under which it purchases 85% of the total output of the CENG plants; consequently a ratable view of the 85% of the un-owned portion of total capacity is listed as contracted capacity. |
5
Credit and Liquidity for Exelon and Operating Companies
Credit Ratings as of June 30, 2012
| Moody’s
Investors Service(a) |
Standard & Poor’s Corporation(b) |
Fitch Ratings(b) | ||||||||||
| Exelon Corporation |
||||||||||||
| Senior Unsecured Debt |
Baa2 | (c) | BBB- | BBB+ | ||||||||
| Commercial Paper |
P2 | (c) | A2 | F2 | ||||||||
| Exelon Generation |
||||||||||||
| Senior Unsecured Debt |
Baa1 | (c) | BBB | BBB+ | ||||||||
| Commercial Paper |
P2 | A2 | F2 | |||||||||
| BGE |
||||||||||||
| Senior Secured Debt |
A2 | N/A | A- | |||||||||
| Senior Unsecured Debt |
Baa1 | BBB+ | BBB+ | |||||||||
| Commercial Paper |
P2 | A2 | F2 | |||||||||
| ComEd |
||||||||||||
| Senior Secured Debt |
A3 | A- | BBB+ | |||||||||
| Senior Unsecured Debt |
Baa2 | BBB | BBB | |||||||||
| Commercial Paper |
P2 | A2 | F3 | |||||||||
| PECO |
||||||||||||
| Senior Secured Debt |
A1 | A- | A | |||||||||
| Senior Unsecured Debt |
A3 | N/A | A- | |||||||||
| Commercial Paper |
P2 | A2 | F2 | |||||||||
| (a) | Moody’s downgraded Exelon and Exelon Generation and upgraded BGE upon completion of the merger with Constellation Energy. Exelon and Generation were also placed on negative outlook. |
| (b) | S&P and Fitch affirmed ratings of Exelon and all subsidiaries upon completion of the merger. |
| (c) | On June 11, 2012, Moody’s placed Exelon’s short-term and long-term ratings and Generation’s long-term ratings under review for downgrade. All other ratings are stable. |
Credit Facilities and Commercial Paper as of June 30, 2012
| BG&E | ComEd | PECO | Generation | Exelon Corporate |
Total | |||||||||||||||||||
| (in millions) | ||||||||||||||||||||||||
| Unsecured Revolving Credit Facilities(a) |
$ | 600 | $ | 1,000 | $ | 600 | $ | 5,600 | $ | 2,900 | (c) | $ | 10,700 | |||||||||||
| Outstanding Facility Draws |
— | — | — | — | — | — | ||||||||||||||||||
| Outstanding Letters of Credit |
(1 | ) | (1 | ) | (1 | ) | (1,754 | ) | (616 | ) | (2,373 | ) | ||||||||||||
|
|
|
|
|
|
|
|
|
|
|
|
|
|||||||||||||
| Available Capacity under Facilities(b) |
599 | 999 | 599 | 3,846 | 2,284 | 8,327 | ||||||||||||||||||
| Outstanding Commercial Paper |
— | (178 | ) | — | — | (188 | ) | (366 | ) | |||||||||||||||
|
|
|
|
|
|
|
|
|
|
|
|
|
|||||||||||||
| Available Capacity less Outstanding Comm. Paper |
$ | 599 | $ | 821 | $ | 599 | $ | 3,846 | $ | 2,096 | $ | 7,961 | ||||||||||||
|
|
|
|
|
|
|
|
|
|
|
|
|
|||||||||||||
| (a) | Equals aggregate bank commitments under revolving credit agreements. Excludes commitments from Exelon’s Community and Minority Bank Credit Facility. |
| (b) | Represents unused bank commitments under the borrower’s credit agreements net of outstanding letters of credit and credit facility draws. The amount of commercial paper outstanding does not reduce the available capacity under the credit agreements. |
| (c) | Includes Exelon Corporate’s $500M credit facility and Legacy Constellation credit facilities assumed as part of the merger as well as letters of credit and commercial paper outstanding. Exelon will be unwinding approximately $4 billion in credit facilities assumed from legacy Constellation over the course of this year. |
6
Long-Term Debt Outstanding as of June 30, 2012
Exelon Corporation
| Series |
Interest Rate |
Date Issued |
Maturity Date |
Total Debt Outstanding |
Current Portion |
Long-Term Debt |
||||||||||||||||||
| (in millions) | ||||||||||||||||||||||||
| Senior Notes Payable |
||||||||||||||||||||||||
| 2005 Senior Notes Payable |
4.90 | % | 6/9/05 | 6/15/15 | $ | 800 | $ | — | $ | 800 | ||||||||||||||
| 2005 Senior Notes |
5.625 | % | 6/9/05 | 6/15/35 | 500 | — | 500 | |||||||||||||||||
|
|
|
|
|
|
|
|||||||||||||||||||
| Total Senior Notes Payable |
$ | 1,300 | $ | — | $ | 1,300 | ||||||||||||||||||
|
|
|
|
|
|
|
|||||||||||||||||||
| Unamortized Debt Disc. & Prem. & Fair Value Ammortization, Net |
|
4 | — | 4 | ||||||||||||||||||||
| BGE Debt Fair Value Adjustment(a) |
|
293 | — | 293 | ||||||||||||||||||||
|
|
|
|
|
|
|
|||||||||||||||||||
| Total Long-Term Debt |
$ | 1,597 | $ | — | $ | 1,597 | ||||||||||||||||||
|
|
|
|
|
|
|
|||||||||||||||||||
| Maturities |
2012 | 2013 | 2014 | 2015 | 2016 | |||||||||||||||||||
| — | — | — | $ | 800 | — | |||||||||||||||||||
| (a) | This adjustment is held at Exelon per the determination to not apply push-down accounting to BGE. |
Exelon Generation
| Series |
Interest Rate |
Date Issued | Maturity Date |
Total Debt Outstanding |
Current Portion |
Long-Term Debt |
||||||||||||||||||
| (in millions) | ||||||||||||||||||||||||
| Senior Notes |
||||||||||||||||||||||||
| 2003 Senior Unsecured Notes |
5.35 | % | 12/19/03 | 1/15/14 | $ | 500 | $ | — | $ | 500 | ||||||||||||||
| 2007 Senior Unsecured Notes |
6.20 | % | 9/28/07 | 10/1/17 | 700 | — | 700 | |||||||||||||||||
| 2009 Senior Unsecured Notes |
5.20 | % | 9/23/09 | 10/1/19 | 600 | — | 600 | |||||||||||||||||
| 2010 Senior Unsecured Notes |
4.00 | % | 9/30/10 | 10/1/20 | 550 | — | 550 | |||||||||||||||||
| 2012 Senior Unsecured Notes |
4.25 | % | 6/18/12 | 6/15/22 | 523 | — | 523 | |||||||||||||||||
| 2009 Senior Unsecured Notes |
6.25 | % | 9/23/09 | 10/1/39 | 900 | — | 900 | |||||||||||||||||
| 2010 Senior Unsecured Notes |
5.75 | % | 9/30/10 | 10/1/41 | 350 | — | 350 | |||||||||||||||||
| 2012 Senior Unsecured Notes |
5.60 | % | 6/18/12 | 6/15/42 | 787 | — | 787 | |||||||||||||||||
| CEG Senior Notes(a) |
4.55 | % | 6/13/03 | 6/15/15 | 550 | — | 550 | |||||||||||||||||
| CEG Senior Notes(a) |
5.15 | % | 12/14/10 | 12/1/20 | 550 | — | 550 | |||||||||||||||||
| CEG Senior Notes(a) |
7.60 | % | 3/26/02 | 4/1/32 | 259 | — | 259 | |||||||||||||||||
| CEG Senior Notes(a) |
8.625 | % | 6/27/08 | 6/15/63 | 450 | — | 450 | |||||||||||||||||
| Exelon Wind |
2.00 | % | 12/10/10 | 7/31/17 | 1 | — | 1 | |||||||||||||||||
|
|
|
|
|
|
|
|||||||||||||||||||
| Total Senior Notes |
$ | 6,720 | $ | — | $ | 6,720 | ||||||||||||||||||
|
|
|
|
|
|
|
|||||||||||||||||||
| Non Regulated Business |
||||||||||||||||||||||||
| Pollution Control Loan(b) |
4.10 | % | 12/20/84 | 7/1/14 | $ | 20 | $ | 20 | $ | — | ||||||||||||||
| Solar Revolver |
2.49 | % | 7/7/11 | 7/7/14 | 124 | — | 124 | |||||||||||||||||
| CEU Credit Agreement |
1.99 | % | 7/22/11 | 7/22/16 | 37 | — | 37 | |||||||||||||||||
| MEDCO Tax-exempt Bonds |
0.18 | % | 5/17/06 | 4/1/24 | 75 | — | 75 | |||||||||||||||||
| Sacramento PV Energy |
||||||||||||||||||||||||
| Loan Agreement |
3.06 | % | 7/26/11 | 12/31/30 | 40 | 2 | 38 | |||||||||||||||||
| Denver Airport Solar |
||||||||||||||||||||||||
| Loan Agreement |
5.50 | % | 6/28/11 | 6/30/31 | 7 | — | 7 | |||||||||||||||||
| Holyoke Solar Loan Agreement |
5.25 | % | 10/25/11 | 12/31/31 | 11 | — | 11 | |||||||||||||||||
| AVSR1-Draw 1 |
3.09 | % | 4/5/12 | 1/5/37 | 69 | — | 69 | |||||||||||||||||
|
|
|
|
|
|
|
|||||||||||||||||||
| Total Non Regulated Business |
$ | 383 | $ | 22 | $ | 361 | ||||||||||||||||||
|
|
|
|
|
|
|
|||||||||||||||||||
| Notes Payable |
||||||||||||||||||||||||
| Capital Leases |
$ | 33 | $ | 3 | $ | 30 | ||||||||||||||||||
|
|
|
|
|
|
|
|||||||||||||||||||
| Unamortized Debt Discount & Premium, Fair Value Amortization, Net |
|
(2 | ) | — | (2 | ) | ||||||||||||||||||
| CEG Senior Notes Fair Market Value Adjustment |
|
235 | — | 235 | ||||||||||||||||||||
|
|
|
|
|
|
|
|||||||||||||||||||
| Total Long-Term Debt |
$ | 7,369 | $ | 25 | $ | 7,344 | ||||||||||||||||||
|
|
|
|
|
|
|
|||||||||||||||||||
| Maturities |
2012 | 2013 | 2014 | 2015 | 2016 | |||||||||||||||||||
| $ | 3 | $ | 3 | $ | 647 | $ | 553 | $ | 40 | |||||||||||||||
| (a) | These notes represent inter company loan agreements between Exelon and Generation that mirror the terms and amounts of the third-party obligations of Exelon. |
| (b) | Subject to the holder having the option to put the bonds back to Generation; as such they are classified in the current portion of long-term debt. |
7
Long-Term Debt Outstanding as of June 30, 2012
ComEd
| Series |
Interest Rate |
Date Issued |
Maturity Date |
Total Debt Outstanding |
Current Portion |
Long-Term Debt |
||||||||||||||||||
| (in millions) | ||||||||||||||||||||||||
| First Mortgage Bonds |
||||||||||||||||||||||||
| 92 |
7.625 | % | 4/15/93 | 4/15/13 | $ | 125 | $ | 125 | $ | — | ||||||||||||||
| 94 |
7.50 | % | 7/1/93 | 7/1/13 | 127 | — | 127 | |||||||||||||||||
| 110 |
1.63 | % | 1/18/11 | 1/15/14 | 600 | — | 600 | |||||||||||||||||
| Pollution Control-1994C |
5.85 | % | 1/15/94 | 1/15/14 | 17 | — | 17 | |||||||||||||||||
| 101 |
4.70 | % | 4/7/03 | 4/15/15 | 260 | — | 260 | |||||||||||||||||
| 104 |
5.95 | % | 8/28/06 | 8/15/16 | 415 | — | 415 | |||||||||||||||||
| 106 |
6.15 | % | 9/10/07 | 9/15/17 | 425 | — | 425 | |||||||||||||||||
| 108 |
5.80 | % | 3/27/08 | 3/15/18 | 700 | — | 700 | |||||||||||||||||
| 109 |
4.00 | % | 8/2/10 | 8/1/20 | 500 | — | 500 | |||||||||||||||||
| 111 |
1.95 | % | 9/7/11 | 9/1/16 | 250 | — | 250 | |||||||||||||||||
| 112 |
3.40 | % | 9/7/11 | 9/1/21 | 350 | — | 350 | |||||||||||||||||
| 100 |
5.875 | % | 1/22/03 | 2/1/33 | 254 | — | 254 | |||||||||||||||||
| 103 |
5.90 | % | 3/6/06 | 3/15/36 | 625 | — | 625 | |||||||||||||||||
| 107 |
6.45 | % | 1/16/08 | 1/15/38 | 450 | — | 450 | |||||||||||||||||
|
|
|
|
|
|
|
|||||||||||||||||||
| Total First Mortgage Bonds |
$ | 5,098 | $ | 125 | $ | 4,973 | ||||||||||||||||||
|
|
|
|
|
|
|
|||||||||||||||||||
| Notes Payable |
||||||||||||||||||||||||
| Notes Payable |
6.95 | % | 7/16/98 | 7/15/18 | $ | 140 | $ | — | $ | 140 | ||||||||||||||
|
|
|
|
|
|
|
|||||||||||||||||||
| Total Notes Payable |
$ | 140 | $ | — | $ | 140 | ||||||||||||||||||
|
|
|
|
|
|
|
|||||||||||||||||||
| Long-Term Debt To Financing Trusts |
||||||||||||||||||||||||
| Subordinated Debentures to ComEd Financing III |
6.35 | % | 3/17/03 | 3/15/33 | $ | 206 | $ | — | $ | 206 | ||||||||||||||
|
|
|
|
|
|
|
|||||||||||||||||||
| Total Long-Term Debt to Financing Trusts |
|
$ | 206 | $ | — | $ | 206 | |||||||||||||||||
|
|
|
|
|
|
|
|||||||||||||||||||
| Unamortized Debt Disc. & Prem., Net |
|
(22 | ) | — | (22 | ) | ||||||||||||||||||
|
|
|
|
|
|
|
|||||||||||||||||||
| Total Long-Term Debt |
$ | 5,422 | $ | 125 | $ | 5,297 | ||||||||||||||||||
|
|
|
|
|
|
|
|||||||||||||||||||
| Note: Amounts may not add due to rounding. |
||||||||||||||||||||||||
| Maturities |
2012 | 2013 | 2014 | 2015 | 2016 | |||||||||||||||||||
| — | $ | 252 | $ | 617 | $ | 260 | $ | 665 | ||||||||||||||||
8
Long-Term Debt Outstanding as of June 30, 2012
PECO
| Series |
Interest Rate |
Date Issued |
Maturity Date |
Total Debt Outstanding |
Current Portion |
Long-Term Debt |
||||||||||||||||||
| (in millions) | ||||||||||||||||||||||||
| First Mortgage Bonds (FMB) |
||||||||||||||||||||||||
| FMB |
4.75 | % | 9/23/02 | 10/1/12 | $ | 225 | $ | 225 | $ | — | ||||||||||||||
| FMB |
5.60 | % | 10/2/08 | 10/15/13 | 300 | — | 300 | |||||||||||||||||
| FMB |
5.00 | % | 3/26/09 | 10/1/14 | 250 | — | 250 | |||||||||||||||||
| FMB |
5.35 | % | 3/3/08 | 3/1/18 | 500 | — | 500 | |||||||||||||||||
| FMB |
5.90 | % | 4/23/04 | 5/1/34 | 75 | — | 75 | |||||||||||||||||
| FMB |
5.95 | % | 9/25/06 | 10/1/36 | 300 | — | 300 | |||||||||||||||||
| FMB |
5.70 | % | 3/19/07 | 3/15/37 | 175 | — | 175 | |||||||||||||||||
|
|
|
|
|
|
|
|||||||||||||||||||
| Total First Mortgage Bonds |
$ | 1,825 | $ | 225 | $ | 1,600 | ||||||||||||||||||
|
|
|
|
|
|
|
|||||||||||||||||||
| Mortgage-Backed Pollution Control Notes |
||||||||||||||||||||||||
| Delaware Co. 2008 Ser. A |
4.00 | % | 3/5/08 | 12/1/12 | $ | 150 | $ | 150 | $ | — | ||||||||||||||
|
|
|
|
|
|
|
|||||||||||||||||||
| Total Mortgage-Backed Pollution Control Notes |
|
$ | 150 | $ | 150 | $ | — | |||||||||||||||||
|
|
|
|
|
|
|
|||||||||||||||||||
| Long-Term Debt to Financing Trusts |
||||||||||||||||||||||||
| PECO Energy Capital Trust III |
7.38 | % | 4/6/98 | 4/6/28 | $ | 81 | $ | — | $ | 81 | ||||||||||||||
| PECO Energy Capital Trust IV |
5.75 | % | 6/24/03 | 6/15/33 | 103 | — | 103 | |||||||||||||||||
|
|
|
|
|
|
|
|||||||||||||||||||
| Total Long-Term Debt to Financing Trusts |
|
$ | 184 | $ | — | $ | 184 | |||||||||||||||||
|
|
|
|
|
|
|
|||||||||||||||||||
| Unamortized Debt Discount & Premium, Net |
|
(2 | ) | — | (2 | ) | ||||||||||||||||||
|
|
|
|
|
|
|
|||||||||||||||||||
| Total Long-Term Debt |
$ | 2,157 | $ | 375 | $ | 1,782 | ||||||||||||||||||
|
|
|
|
|
|
|
|||||||||||||||||||
| Maturities |
2012 | 2013 | 2014 | 2015 | 2016 | |||||||||||||||||||
| $ | 375 | $ | 300 | $ | 250 | — | — | |||||||||||||||||
9
Long-Term Debt Outstanding as of June 30, 2012
BGE
| Series |
Interest Rate |
Date Issued | Maturity Date |
Debt Outstanding |
Current Portion |
Long-Term Debt |
||||||||||||||||||
| (in millions) | ||||||||||||||||||||||||
| Senior Notes |
||||||||||||||||||||||||
| Senior Notes due 7/1/13 |
6.125 | % | 6/26/08 | 7/1/13 | $ | 400 | $ | — | $ | 400 | ||||||||||||||
| Senior Notes due 10/1/16 |
5.90 | % | 10/13/06 | 10/1/16 | 300 | — | 300 | |||||||||||||||||
| Senior Notes due 11/15/21 |
3.50 | % | 11/16/11 | 11/15/21 | 300 | — | 300 | |||||||||||||||||
| Senior Notes due 6/15/33 |
5.20 | % | 6/20/03 | 6/15/33 | 200 | — | 200 | |||||||||||||||||
| Senior Notes due 10/1/36 |
6.35 | % | 10/13/06 | 10/1/36 | 400 | — | 400 | |||||||||||||||||
|
|
|
|
|
|
|
|||||||||||||||||||
| Total Senior Notes |
$ | 1,600 | $ | — | $ | 1,600 | ||||||||||||||||||
|
|
|
|
|
|
|
|||||||||||||||||||
| Rate Stabilization Bonds |
||||||||||||||||||||||||
| BGE Securitization due 2017 |
5.683 | % | 6/28/07 | 4/1/17 | $ | 363 | $ | 65 | $ | 299 | ||||||||||||||
|
|
|
|
|
|
|
|||||||||||||||||||
| Total Rate Stabilization Bonds |
|
$ | 363 | $ | 65 | $ | 299 | |||||||||||||||||
|
|
|
|
|
|
|
|||||||||||||||||||
| Deferrable Interest Subordinated Debentures |
||||||||||||||||||||||||
| Trust Preferred Debentures due 2043 |
6.20 | % | 11/21/03 | 10/15/43 | $ | 258 | $ | — | $ | 258 | ||||||||||||||
| Total Deferrable Interest Suburdinated Debentures |
|
$ | 258 | $ | — | $ | 258 | |||||||||||||||||
|
|
|
|
|
|
|
|||||||||||||||||||
| Unamortized Debt Discount & Premium, Net |
|
(2 | ) | — | (2 | ) | ||||||||||||||||||
|
|
|
|
|
|
|
|||||||||||||||||||
| Total Long-Term Debt |
$ | 2,219 | $ | 65 | $ | 2,154 | ||||||||||||||||||
|
|
|
|
|
|
|
|||||||||||||||||||
| Maturities |
2012 | 2013 | 2014 | 2015 | 2016 | |||||||||||||||||||
| — | $ | 400 | — | — | $ | 300 | ||||||||||||||||||
10
Federal Regulation
Federal Energy Regulatory Commission (FERC)
(www.ferc.gov)
The FERC has five full-time members, each appointed by the President of the United States and confirmed by the U.S. Senate. The Commissioners serve for staggered five-year terms. No more than three Commissioners may belong to the same political party. The Chairman is designated by the President.
| Commissioner |
Party |
Service |
Term |
Professional Experience | ||||
| Jon Wellinghoff (Chairman) |
Democrat | 7/06 | 6/13 | Attorney, practice focused on energy law and utility regulation; staff advisor to several state utility commissions; Nevada State Consumer Advocate | ||||
| Philip D. Moeller |
Republican | 7/06 | 6/15 | Energy policy advisor to former U.S. Senator Slade Gorton (WA); staff coordinator for the WA State Senate Committee on Energy, Utilities and Telecommunications; Alliant Energy Corporation | ||||
| Tony Clark |
Republican | 6/12 | 6/16 | Chairman of North Dakota Public Service Commission; President of NARUC; North Dakota Labor Commissioner under Gov. Ed Schafer; State Legislator; Chairman of Frontier Trails District of the Boy Scouts of America | ||||
| John R. Norris |
Democrat | 1/10 | 6/17 | Attorney; Chief of Staff to Secretary Tom Vilsack of the U.S. Department of Agriculture; Chairman of the Iowa Utilities Board; President of the Organization of MISO States | ||||
| Cheryl A. LaFleur |
Democrat | 7/10 | 6/14 | Attorney; executive vice president and acting CEO of National Grid USA; member of the NARUC Committees on Electricity and Critical Infrastructure | ||||
ComEd Electric Transmission Rate Cases
| ($ in millions) |
Date | Revenue Adjustment |
Test Year |
Rate Base | Overall Rate of Return |
Return on Equity | Equity Ratio | |||||||||||||||||||
| ComEd Update(a) |
5/16/12 | $23 | 2011 pro forma | $2,104 | 8.91% | 11.50% | 55% | |||||||||||||||||||
| ComEd Update(a)(b) |
5/16/11 | $6 | 2010 pro forma | $2,054 | 9.10% | 11.50% | 55% | |||||||||||||||||||
| ComEd Update(a)(c) |
5/14/10 | $(24) | 2009 pro forma | $1,949 | 9.27% | 11.50% | 56% | |||||||||||||||||||
| ComEd Update(a) |
5/15/09 | $(16) | 2008 pro forma | $1,986 | 9.43% | 11.50% | 57% | |||||||||||||||||||
| (a) | Annual update filing based on the formula rate, originally implemented effective May 1, 2007. Rate effective June 1 of the update year through May 31 of the following year. |
| (b) | Revenue requirement increase primarily reflects the IL income tax statuatory rate change enacted January 2011. |
| (c) | Revenue requirement decrease primarily reflects lower O&M expenses and increased true-up credit to the formula. |
BGE Electric Transmission Rate Cases
| ($ in millions) |
Date | Revenue Adjustment |
Test Year |
Rate Base | Overall Rate of Return |
Return on Equity | Equity Ratio | |||||||||||||||||||
| BGE Update(a),(b) |
4/24/12 | $ | 18 | 2011 pro forma | $ | 572 | 8.43 | % | 11.30 | % | 50 | % | ||||||||||||||
| BGE Update(a) |
4/29/11 | $ | (1 | ) | 2010 pro forma | $ | 501 | 8.96 | % | 11.30 | % | 53 | % | |||||||||||||
| BGE Update(a),(b) |
4/26/10 | $ | 33 | 2009 pro forma | $ | 441 | 8.92 | % | 11.30 | % | 51 | % | ||||||||||||||
| BGE Update(a) |
5/4/09 | $ | 3 | 2008 pro forma | $ | 392 | 8.47 | % | 11.30 | % | 45 | % | ||||||||||||||
| (a) | Annual update filing based on the formula rate, originally implemented effective June 1, 2005. Rate effective June 1 of the update year through May 31 of the following year. |
| (b) | Revenue requirement increase primarily reflects higher rate base, O&M expenses, and true-up debit to the formula. |
11
State Regulation
Illinois Commerce Commission (ICC)
(www.icc.illinois.gov)
The ICC has five full-time members, each appointed by the Governor (currently Pat Quinn, Democrat; term began in January 2009 and ends in January 2015) and confirmed by the Illinois State Senate. The Commissioners serve staggered five-year terms. Under Illinois law, no more than three Commissioners may belong to the same political party. The Chairman is designated by the Governor.
| Commissioner |
Party Affiliation |
Service Began |
Term Ends |
Professional Experience | ||||
| Douglas P. Scott (Chairman) | Democrat | 3/11 | 1/14 | Attorney; director of the Illinois Environmental Protection Agency; mayor of Rockford, IL; IL state representative | ||||
| Ann McCabe | Republican | 3/12 | 1/17 | Midwest regional director for The Climate Registry; partner at Policy Solutions Ltd.; regulatory manager for BP and Amoco; founding member of the Foresight Sustainable Business Alliance; member Illinois Environmental Council | ||||
| Lula M. Ford | Democrat | 1/03 | 1/13 | Assistant superintendent, Chicago Public Schools; teacher; assistant director, Central Management Service | ||||
| Erin O’Connell-Diaz | Republican | 4/03 | 1/13 | Attorney; ICC Administrative Law Judge; assistant attorney general | ||||
| John T. Colgan | Democrat | 11/09 | 1/15 | Member of Illinois Association of Community Action Agencies; executive director of the Illinois Hunger Coalition | ||||
ComEd Electric Distribution Rate Cases
| ($ in millions) |
Date | Revenue Increase |
Test Year | Rate Base | Overall Rate of Return |
Return on Equity |
Equity Ratio | |||||||||||||||||||||
| Formula Rate Filing |
11/8/11 | ($ | 59 | ) | 2010 | $ | 6,601 | 8.11 | % | 10.05 | % | 45.56 | % | |||||||||||||||
| ICC Order(a) |
5/29/12 | ($ | 169 | ) | 2010 | $ | 6,183 | 8.16 | % | 10.05 | % | 46.17 | % | |||||||||||||||
| ComEd Request |
6/30/10 | $ | 343 | (b) | 2009 | $ | 7,349 | (a) | 8.98 | %(a) | 11.50 | % | 47.28 | %(a) | ||||||||||||||
| ICC Order |
5/24/11 | $ | 143 | 2009 | $ | 6,549 | 8.51 | % | 10.50 | % | 47.28 | % | ||||||||||||||||
| ComEd Request |
10/17/07 | $ | 345 | (c) | 2006 | $ | 6,753 | (b) | 8.57 | %(b) | 10.75 | % | 45.04 | %(b) | ||||||||||||||
| ICC Order(d) |
9/10/08 | $ | 274 | 2006 | $ | 6,694 | 8.36 | % | 10.30 | % | 45.04 | % | ||||||||||||||||
| ComEd Request |
8/31/05 | $ | 317 | 2004 | $ | 6,187 | 8.94 | % | 11.00 | % | 54.20 | % | ||||||||||||||||
| ICC Order |
12/20/06 | $ | 83 | 2004 | $ | 5,521 | 8.01 | % | 10.045 | % | 42.86 | % | ||||||||||||||||
| (a) | On June 22, 2012 the ICC granted expedited rehearing on three aspects of the formula rate order. The expected schedule for the rehearing allows for a decision by September 19, 2012. |
| (b) | Reflects ComEd reply brief filed on February 23, 2011. Original rate request included a $396 million revenue increase. |
| (c) | Reflects ComEd surrebuttal testimony filed on April 21, 2008. Original rate request included a $361 million revenue increase. |
| (d) | On September 30, 2010, the Illinois Appellate Court issued a decision in the appeals related to the ICC’s order in ComEd’s 2007 electric distribution rate case. That decision ruled against ComEd on the treatment of post-test year accumulated depreciation. On November 18, 2010, the Court denied ComEd’s petition for rehearing, and on January 25, 2011, ComEd filed a Petition for Leave to Appeal to the Illinois Supreme Court. |
ComEd – Average Total Residential Rate
| ($/MWh) Year |
Transmission | Distribution | Energy | Other(a) | Total | |||||||||||||||
| 2008 |
6.90 | 33.77 | 72.55 | 2.46 | 115.68 | |||||||||||||||
| 2009 |
6.94 | 39.29 | 67.77 | 3.02 | 117.02 | |||||||||||||||
| 2010 |
6.80 | 38.71 | 72.81 | 3.34 | 121.66 | |||||||||||||||
| 2011 |
7.49 | 41.40 | 73.14 | 3.78 | 125.80 | |||||||||||||||
| (a) | Primarily includes taxes and environmental cost recovery and energy efficiency riders. |
12
State Regulation
Pennsylvania Public Utility Commission (PUC)
(www.puc.state.pa.us)
The PUC has five full-time members, each appointed by the Governor (currently Tom Corbett, Republican; term began in January 2011 and ends in January 2015) and confirmed by the Pennsylvania State Senate. The Commissioners serve for staggered five-year terms. Under Pennsylvania law, no more than three Commissioners may belong to the same political party as the Governor. The Chairman is designated by the Governor, and the Vice Chairman is selected by the PUC commissioners.
| Commissioner |
Party Affiliation |
Service Began |
Term Ends |
Professional Experience | ||||
| Robert F. Powelson (Chairman) | Republican | 6/08 | 4/14 | President/CEO of Chester County Chamber of Business and Industry; staff assistant to former U.S. Representative Curt Weldon (PA) | ||||
| John F. Coleman Jr. (Vice Chairman) |
Republican | 6/10 | 4/17 | President/CEO of Centre County Chamber of Business and Industry; Executive Director of the Jefferson County Department of Development | ||||
| Pamela A. Witmer | Republican | 6/11 | 4/16 | Energy and environment practice lead at Bravo Group. President and CEO of Pennsylvania Chemical Industry Council; lead legislative liaison in PA Department of Environmental Protection; research analyst for PA House of Representatives | ||||
| Wayne E. Gardner | Democrat | 6/08 | 4/13 | Consultant in power generation technologies; executive at Franklin Fuel Cells, Inc.; executive at PECO Energy | ||||
| James H. Cawley | Democrat | 6/05 | 4/15 | Attorney; majority counsel to the Pennsylvania Senate Consumer Affairs Committee | ||||
PECO Electric Distribution Rate Case
| ($ in millions) |
Date | Revenue Increase |
Test Year | Rate Base | Overall Rate of Return |
Return on Equity |
Equity Ratio | |||||||||||||||||||||
| PECO Request(a) |
3/31/10 | $ | 316 | 2010 | $ | 3,236 | 8.95 | % | 11.75 | % | 53.18 | % | ||||||||||||||||
| PUC Order(b) |
12/16/10 | $ | 225 | 2010 | n/a | n/a | n/a | n/a | ||||||||||||||||||||
PECO Gas Delivery Rate Cases
| ($ in millions) |
Date | Revenue Increase |
Test Year | Rate Base | Overall Rate of Return |
Return on Equity |
Equity Ratio | |||||||||||||||||||||
| PECO Request(a) |
3/31/10 | $ | 44 | 2010 | $ | 1,100 | 8.95 | % | 11.75 | % | 53.18 | % | ||||||||||||||||
| PUC Order(b) |
12/16/10 | $ | 20 | 2010 | n/a | n/a | n/a | n/a | ||||||||||||||||||||
| PECO Request |
3/31/08 | $ | 98 | 2008 | $ | 1,104 | 8.87 | % | 11.50 | % | 54.34 | % | ||||||||||||||||
| PUC Order(b) |
10/23/08 | $ | 77 | 2008 | n/a | n/a | n/a | n/a | ||||||||||||||||||||
| (a) | Per original filing. |
| (b) | PUC approved a joint settlement; no allowed return was specified. Increase related to December 2010 order was effective January 1, 2011. |
PECO — Average Total Residential Rate
| ($/MWh) Year |
Transmission | Distribution | Energy Efficiency Surcharge |
CTC(c) | Energy and Capacity |
Total | ||||||||||||||||||
| 2010 |
$ | 5.10 | $ | 50.30 | $ | 2.90 | $ | 25.70 | $ | 62.60 | $ | 146.60 | ||||||||||||
| 2011 |
6.90 | 58.40 | 4.70 | — | 84.00 | 154.00 | ||||||||||||||||||
| (c) | The PUC authorized recovery in PECO’s 1998 settlement of competitive transition charges (CTC) through 2010. |
13
State Regulation
Maryland Public Service Commission (PSC)
(http://webapp.psc.state.md.us)
The PSC has five full-time members, each appointed by the Governor (currently Martin O’Malley, Democrat; 1st term began in January 2007; 2nd term ends in January 2015) and confirmed by the Maryland General Assembly. The Commissioners serve staggered five-year terms.
| Commissioner |
Party Affiliation |
Service Began |
Term Ends |
Professional Experience | ||||
| Douglas R. M. Nazarian (Chairman) | Democrat | 8/08 | 6/13 | Attorney; NARUC Board of Directors; President of Organization of PJM States; President of Eastern Interconnection States’ Planning Council; General Counsel of MDPSC, attorney in private practice; clerk at U.S. Court of Appeals for the Eighth Circuit | ||||
| Harold D. Williams | Democrat | 9/02 | 6/17 | Director of Corporate Procurement Services at BGE; Chair of NARUC’s Utility Market Access partnership Board; Chairman of MD/DC Minority Supplier Development Council; Board member of EEI Minority Business Development Committee, and DOE Minority Business Roundtable Committee | ||||
| Lawrence Brenner | Democrat | 3/07 | 6/15 | Attorney; Chairman of Washington Metropolitan Area Transit Commission; Board member of Organization of PJM States; Deputy Chief ALJ for FERC; judge for the NRC; ALJ with U.S. Department of Labor | ||||
| Kelly Speakes-Backman | Democrat | 9/11 | 6/14 | Board member of NARUC Committee on Energy Resources and the Environment and Regionall Greenhouse Gas Initiative; Clean Energy director at Maryland Energy Administration | ||||
| W. Kevin Hughes | Democrat | 9/11 | 6/16 | Attorney; Deputy Legislative Officer to Governors O’Malley, Glendening; Legislative Officer under Governor Schaefer; Principal Analyst for MD Department of Legislative Services | ||||
| BGE Electric Distribution Rate Case | ||||||||||||||||||||||||||||
| ($ in millions) |
Date | Revenue Increase |
Test Year | Adjusted Rate Base |
Overall Rate of Return |
Return on Equity |
Equity Ratio | |||||||||||||||||||||
| BGE Request |
7/27/12 | $ | 151 | 2011-12 | $ | 2,714 | 8.02 | % | 10.5 | % | 48.4 | % | ||||||||||||||||
| BGE Request |
5/7/10 | $ | 92 | (a) | 2009-10 | $ | 2,291 | 8.99 | % | 11.65 | % | 51.93 | % | |||||||||||||||
| PSC Order |
12/6/10 | (b) | $ | 31 | 2009-10 | $ | 2,243 | 8.06 | % | 9.86 | % | 51.93 | % | |||||||||||||||
| BGE Gas Distribution Rate Case | ||||||||||||||||||||||||||||
| ($ in millions) |
Date | Revenue Increase |
Test Year | Adjusted Rate Base |
Overall Rate of Return |
Return on Equity |
Equity Ratio | |||||||||||||||||||||
| BGE Request |
7/27/12 | $ | 53 | 2011-12 | $ | 1,018 | 8.02 | % | 10.5 | % | 48.4 | % | ||||||||||||||||
| BGE Request |
5/7/10 | $ | 30 | 2009-10 | $ | 839 | 8.99 | % | 11.65 | % | 51.93 | % | ||||||||||||||||
| PSCOrder |
12/6/10 | (b) | $ | 10 | 2009-10 | $ | 817 | 7.90 | % | 9.56 | % | 51.93 | % | |||||||||||||||
| (a) | However, due to a 2008 settlement with the MDPSC, the State of Maryland and the General Assembly, BGE’s electric rate increase was limited to 5% of electricity revenues or $47.2 million. |
| (b) | The PSC issued an abbreviated rate order on December 6, 2010 and followed-up with a more comprehensive order on March 9 2011. |
| BGE – Average Total Residential Rate | ||||||||||||||||||||
| ($/MWh) | ||||||||||||||||||||
| Year |
Energy | Transmission | Distribution | Other(a) | Total | |||||||||||||||
| 2010 |
$ | 109.30 | $ | 5.12 | $ | 31.35 | $ | 3.07 | $ | 148.84 | ||||||||||
| 2011 |
93.39 | 6.13 | 33.05 | 4.33 | 136.90 | |||||||||||||||
| (a) | Includes EmPowerMD Charge, RSP Charge/Misc Credits, taxes, and other surcharges. |
14
Capital Structure and Capitalization Ratios for Exelon and Operating Companies
| (at December 31) | 2011 | 2010 | 2009 | |||||||||||||||||||||||||
| (in millions) | (in percent) | (in millions) | (in percent) | (in millions) | (in percent) | (in percent)(a) | ||||||||||||||||||||||
| Exelon (consolidated) |
||||||||||||||||||||||||||||
| Total Debt |
$ | 13,405 | 48.1 | $ | 12,828 | 48.4 | $ | 12,594 | 49.7 | 48.9 | ||||||||||||||||||
| Preferred Securities of Subsidiaries |
87 | 0.3 | 87 | 0.3 | 87 | 0.3 | 0.3 | |||||||||||||||||||||
| Total Equity |
14,388 | 51.6 | 13,563 | 51.2 | 12,640 | 49.9 | 50.8 | |||||||||||||||||||||
|
|
|
|
|
|
|
|||||||||||||||||||||||
| Total Capitalization |
$ | 27,880 | $ | 26,478 | $ | 25,321 | ||||||||||||||||||||||
|
|
|
|
|
|
|
|||||||||||||||||||||||
| Transition Debt |
$ | — | $ | — | $ | 415 | ||||||||||||||||||||||
| Exelon Generation |
||||||||||||||||||||||||||||
| Total Debt(b) |
$ | 3,679 | 29.7 | $ | 3,679 | 33.9 | $ | 2,993 | 30.6 | |||||||||||||||||||
| Total Equity |
8,708 | 70.3 | 7,177 | 66.1 | 6,792 | 69.4 | ||||||||||||||||||||||
|
|
|
|
|
|
|
|||||||||||||||||||||||
| Total Capitalization |
$ | 12,387 | $ | 10,856 | $ | 9,785 | ||||||||||||||||||||||
|
|
|
|
|
|
|
|||||||||||||||||||||||
| ComEd |
||||||||||||||||||||||||||||
| Total Debt |
$ | 5,871 | 45.5 | $ | 5,207 | 43.0 | $ | 5,072 | 42.7 | |||||||||||||||||||
| Total Shareholders’ Equity |
7,037 | 54.5 | 6,910 | 57.0 | 6,882 | 57.6 | ||||||||||||||||||||||
|
|
|
|
|
|
|
|||||||||||||||||||||||
| Total Capitalization |
$ | 12,908 | $ | 12,117 | $ | 11,954 | ||||||||||||||||||||||
|
|
|
|
|
|
|
|||||||||||||||||||||||
| PECO |
||||||||||||||||||||||||||||
| Total Debt(b) |
$ | 2,381 | 44.0 | $ | 2,631 | 47.0 | $ | 2,820 | 51.5 | 47.6 | ||||||||||||||||||
| Preferred Securities |
87 | 1.6 | 87 | 1.6 | 87 | 1.6 | 1.7 | |||||||||||||||||||||
| Total Shareholders’ Equity |
2,938 | 54.3 | 2,883 | 51.5 | 2,565 | 46.9 | 50.7 | |||||||||||||||||||||
|
|
|
|
|
|
|
|||||||||||||||||||||||
| Total Capitalization |
$ | 5,406 | $ | 5,601 | $ | 5,472 | ||||||||||||||||||||||
|
|
|
|
|
|
|
|||||||||||||||||||||||
| Transition Debt |
$ | — | $ | — | $ | 415 | ||||||||||||||||||||||
Note: Percentages may not add due to rounding.
| (a) | Excluding PECO transition debt. |
| (b) | Includes PECO’s accounts receivable agreement at December 31, 2010 and 2011 of $225 million, which is classified as a short-term note payable. |
15
Financial and Operating Highlights for Exelon in 2011
| For the Years ended December 31, | ||||||||||||
| (in millions, except per share data and where indicated) |
2011 | 2010 | 2009 | |||||||||
| Operating revenues |
$ | 18,924 | $ | 18,644 | $ | 17,318 | ||||||
| Net income |
$ | 2,495 | $ | 2,563 | $ | 2,707 | ||||||
| Electric deliveries (in GWh)(a) |
128,151 | 130,778 | 124,828 | |||||||||
| Gas deliveries (in million cubic feet (mmcf)) |
82,443 | 87,744 | 84,309 | |||||||||
| Total available electric supply resources (MW) |
30,569 | 31,758 | 31,003 | |||||||||
| Cash flows from operating activities |
$ | 4,853 | $ | 5,244 | $ | 6,094 | ||||||
| Capital expenditures |
$ | 4,042 | $ | 3,326 | $ | 3,273 | ||||||
| Common Stock Data |
||||||||||||
| Average common shares outstanding – diluted (in millions) |
665 | 663 | 662 | |||||||||
| GAAP earnings per share (diluted) |
$ | 3.75 | $ | 3.87 | $ | 4.09 | ||||||
| Adjusted (non-GAAP) operating earnings per share (diluted) |
$ | 4.16 | $ | 4.06 | $ | 4.12 | ||||||
| Dividends paid per common share |
$ | 2.10 | $ | 2.10 | $ | 2.10 | ||||||
| New York Stock Exchange common stock price (per share) |
||||||||||||
| High |
$ | 45.45 | $ | 49.88 | $ | 58.98 | ||||||
| Low |
$ | 39.06 | $ | 37.24 | $ | 38.41 | ||||||
| Year end |
$ | 43.37 | $ | 41.64 | $ | 48.87 | ||||||
| Book value per share |
$ | 21.69 | $ | 20.49 | $ | 19.16 | ||||||
| Total market capitalization (year end) |
$ | 28,770 | $ | 27,557 | $ | 32,244 | ||||||
| Common shares outstanding (year end) |
663.4 | 661.8 | 659.8 | |||||||||
| (a) | One GWh is the equivalent of one million kilowatt hours (kWh). |
Reconciliation of Adjusted (non-GAAP) Operating Earnings Per Share to GAAP
| 2011 | 2010 | 2009 | ||||||||||
| GAAP Earnings per Diluted Share |
$ | 3.75 | $ | 3.87 | $ | 4.09 | ||||||
| Mark-to-market impact of economic hedging activities |
0.27 | (0.08 | ) | (0.16 | ) | |||||||
| Unrealized gains related to nuclear decommissioning trust (NDT) fund investments |
— | (0.08 | ) | (0.19 | ) | |||||||
| Retirement of fossil generating units |
0.05 | 0.08 | 0.05 | |||||||||
| Asset retirement obligation updates |
0.02 | (0.01 | ) | (0.05 | ) | |||||||
| Constellation acquisition costs |
0.07 | — | — | |||||||||
| Acquisition costs for Exelon Wind (2010) and Antelope Valley Solar Ranch One (2011) |
0.01 | 0.01 | — | |||||||||
| Non-cash charge resulting from IL tax rate change |
0.04 | — | — | |||||||||
| Wolf Hollow Acquisition |
(0.03 | ) | — | — | ||||||||
| Recovery of costs pursuant to distribution rate case order |
(0.03 | ) | — | — | ||||||||
| Non-cash remeasurement of deferred income taxes |
0.01 | — | — | |||||||||
| Impact of the 2007 Illinois electric rate settlement |
— | 0.02 | 0.10 | |||||||||
| Impairment of certain emissions allowances |
— | 0.05 | — | |||||||||
| Costs associated with ComEd’s City of Chicago settlement |
— | — | 0.01 | |||||||||
| Non-cash charge resulting from health care legislation |
— | 0.10 | — | |||||||||
| Non-cash remeasurement of income tax uncertainties and reassessment of state deferred income taxes |
— | 0.10 | 0.10 | |||||||||
| Impairment of certain generating assets |
— | — | 0.20 | |||||||||
| Costs associated with early debt retirements |
— | — | 0.11 | |||||||||
| External costs associated with the proposed acquisition of NRG Energy, Inc. (NRG) |
— | — | 0.03 | |||||||||
| 2009 restructuring charges |
— | — | 0.03 | |||||||||
|
|
|
|
|
|
|
|||||||
| Adjusted (non-GAAP) Operating Earnings per Diluted Share |
$ | 4.16 | $ | 4.06 | $ | 4.12 | ||||||
|
|
|
|
|
|
|
|||||||
16
Reconciliation of Adjusted (non-GAAP) Operating Earnings
to GAAP Consolidated Statements of Operations (unaudited)
Exelon Corporation
| Twelve Months Ended December 31, 2011 | Twelve Months Ended December 31, 2010 | |||||||||||||||||||||||
| (in millions, except per share data) |
GAAP(a) | Adjustments | Adjusted Non-GAAP |
GAAP(a) | Adjustments | Adjusted Non-GAAP |
||||||||||||||||||
| Operating revenues |
$ | 18,924 | $ | (66 | )(c),(d) | $ | 18,858 | $ | 18,644 | $ | 25 | (m),(n) | $ | 18,669 | ||||||||||
| Operating expenses |
||||||||||||||||||||||||
| Purchased power |
5,284 | (214 | )(e) | 5,070 | 4,425 | (3 | )(e) | 4,422 | ||||||||||||||||
| Fuel |
1,844 | (78 | )(c),(e) | 1,766 | 2,010 | 32 | (e),(o) | 2,042 | ||||||||||||||||
| Operating and maintenance |
5,012 | (124 | )(c),(d),(f),(g),(h),(i) | 4,888 | 4,453 | (4 | )(c),(f),(h),(p) | 4,449 | ||||||||||||||||
| Operating and maintenance for regulatory required programs(b) |
184 | — | 184 | 147 | — | 147 | ||||||||||||||||||
| Depreciation and amortization |
1,335 | (87 | )(c) | 1,248 | 2,075 | (80 | )(c) | 1,995 | ||||||||||||||||
| Taxes other than income |
785 | (1 | )(c) | 784 | 808 | — | 808 | |||||||||||||||||
|
|
|
|
|
|
|
|
|
|
|
|
|
|||||||||||||
| Total operating expenses |
14,444 | (504 | ) | 13,940 | 13,918 | (55 | ) | 13,863 | ||||||||||||||||
|
|
|
|
|
|
|
|
|
|
|
|
|
|||||||||||||
| Operating income |
4,480 | 438 | 4,918 | 4,726 | 80 | 4,806 | ||||||||||||||||||
|
|
|
|
|
|
|
|
|
|
|
|
|
|||||||||||||
| Other income and deductions |
||||||||||||||||||||||||
| Interest expense, net |
(726 | ) | — | (726 | ) | (817 | ) | 103 | (q) | (714 | ) | |||||||||||||
| Loss in equity method investments |
(1 | ) | — | (1 | ) | — | — | — | ||||||||||||||||
| Other, net |
199 | (21 | )(d),(j) | 178 | 312 | (153 | )(j),(q) | 159 | ||||||||||||||||
|
|
|
|
|
|
|
|
|
|
|
|
|
|||||||||||||
| Total other income and deductions |
(528 | ) | (21 | ) | (549 | ) | (505 | ) | (50 | ) | (555 | ) | ||||||||||||
|
|
|
|
|
|
|
|
|
|
|
|
|
|||||||||||||
| Income before income taxes |
3,952 | 417 | 4,369 | 4,221 | 30 | 4,251 | ||||||||||||||||||
| (c),(d),(e),(f),(g) | (c),(e),(f),(h),(j) | |||||||||||||||||||||||
| Income taxes |
1,457 | 149 | (h),(i),(j),(k),(l) | 1,606 | 1,658 | (96 | )(m),(n),(o),(p),(q) | 1,562 | ||||||||||||||||
|
|
|
|
|
|
|
|
|
|
|
|
|
|||||||||||||
| Net income |
$ | 2,495 | $ | 268 | $ | 2,763 | $ | 2,563 | $ | 126 | $ | 2,689 | ||||||||||||
|
|
|
|
|
|
|
|
|
|
|
|
|
|||||||||||||
| Effective tax rate |
36.9 | % | 36.8 | % | 39.3 | % | 36.7 | % | ||||||||||||||||
| Earnings per average common share |
||||||||||||||||||||||||
| Basic |
$ | 3.76 | $ | 0.41 | $ | 4.17 | $ | 3.88 | $ | 0.19 | $ | 4.07 | ||||||||||||
| Diluted |
$ | 3.75 | $ | 0.41 | $ | 4.16 | $ | 3.87 | $ | 0.19 | $ | 4.06 | ||||||||||||
| Average common shares outstanding |
||||||||||||||||||||||||
| Basic |
663 | — | 663 | 661 | — | 661 | ||||||||||||||||||
| Diluted |
665 | — | 665 | 663 | — | 663 | ||||||||||||||||||
| (a) | Results reported in accordance with GAAP. |
| (b) | Includes amounts for various legislative and/or regulatory programs that are recoverable from customers on a full and current basis through a reconcilable automatic adjustment clause. An equal and offsetting amount has been reflected in operating revenues. |
| (c) | Adjustment to exclude costs associated with the planned retirement of fossil generating units and the impacts of the FERC approved reliability-must-run rate schedule. |
| (d) | Adjustment to exclude the non-cash bargain purchase gain (negative goodwill) associated with the acquisition of Wolf Hollow, net of acquisition costs. |
| (e) | Adjustment to exclude the mark-to-market impact of Exelon’s economic hedging activities. |
| (f) | Adjustment to exclude the increase in Generation’s decommissioning obligation for spent nuclear fuel at Zion and the decrease in PECO’s asset retirement obligation in 2011, and a decrease in ComEd and PECO’s asset retirement obligations in 2010. |
| (g) | Adjustment to exclude certain costs associated with Exelon’s proposed acquisition of Constellation. |
| (h) | Adjustment to exclude certain costs associated with Exelon’s acquisition of Exelon Wind in 2010 and Exelon’s acquisition of AVSR 1 in 2011. |
| (i) | Adjustment to exclude one-time benefits for the recovery of previously incurred costs related to the 2009 restructuring plan and for the passage of Federal health care legislation in 2010. |
| (j) | Adjustment to exclude the unrealized losses in 2011 and unrealized gains in 2010 associated with Generation’s NDT fund investments and the associated contractual accounting relating to income taxes. |
| (k) | Adjustment to exclude a one-time, non-cash charge to remeasure deferred taxes at higher corporate tax rates pursuant to the Illinois tax rate change legislation. |
| (l) | Adjustment to exclude the non-cash charge impacts of the annual remeasurement of state deferred income taxes. |
| (m) | Adjustment to exclude the impact of the 2007 Illinois electric rate settlement. |
| (n) | Adjustment to exclude the costs associated with ComEd’s 2007 settlement agreement with the City of Chicago. |
| (o) | Adjustment to exclude a non-cash charge for the impairment of certain SO2 emission allowances as a result of declining market prices following the release of the EPA’s proposed Transport Rule in the third quarter of 2010. |
| (p) | Adjustment to exclude a non-cash charge related to the passage of Federal health care legislation that reduces the deductibility of retiree prescription drug benefits for Federal income tax purposes to the extent they are reimbursed under Medicare Part D. |
| (q) | Adjustment to exclude a 2010 remeasurement of income tax uncertainties. |
17
Reconciliation of Adjusted (non-GAAP) Operating Earnings
to GAAP Consolidated Statements of Operations (unaudited)
Exelon Generation
| Twelve Months Ended December 31, 2011 | Twelve Months Ended December 31, 2010 | |||||||||||||||||||||||
| (in millions) |
GAAP(a) | Adjustments | Adjusted Non-GAAP |
GAAP(a) | Adjustments | Adjusted Non-GAAP |
||||||||||||||||||
| Operating revenues |
$ | 10,308 | $ | (66 | )(b),(c) | $ | 10,242 | $ | 10,025 | $ | 21 | (k) | $ | 10,046 | ||||||||||
| Operating expenses |
||||||||||||||||||||||||
| Purchased power |
1,922 | (214 | )(d) | 1,708 | 1,853 | (3 | )(d) | 1,850 | ||||||||||||||||
| Fuel |
1,528 | (78 | )(b),(d) | 1,450 | 1,610 | 32 | (d),(l) | 1,642 | ||||||||||||||||
| Operating and maintenance |
3,148 | (77 | )(b),(c),(e),(f),(g) | 3,071 | 2,812 | (18 | )(b),(f),(m) | 2,794 | ||||||||||||||||
| Depreciation and amortization |
570 | (87 | )(b) | 483 | 474 | (80 | )(b) | 394 | ||||||||||||||||
| Taxes other than income |
264 | (1 | )(b) | 263 | 230 | — | 230 | |||||||||||||||||
|
|
|
|
|
|
|
|
|
|
|
|
|
|||||||||||||
| Total operating expenses |
7,432 | (457 | ) | 6,975 | 6,979 | (69 | ) | 6,910 | ||||||||||||||||
|
|
|
|
|
|
|
|
|
|
|
|
|
|||||||||||||
| Operating income |
2,876 | 391 | 3,267 | 3,046 | 90 | 3,136 | ||||||||||||||||||
|
|
|
|
|
|
|
|
|
|
|
|
|
|||||||||||||
| Other income and deductions |
||||||||||||||||||||||||
| Interest expense, net |
(170 | ) | — | (170 | ) | (153 | ) | — | (153 | ) | ||||||||||||||
| Loss in equity method investments |
(1 | ) | — | (1 | ) | — | — | — | ||||||||||||||||
| Other, net |
122 | (21 | )(c), (h) | 101 | 257 | (155 | )(h) | 102 | ||||||||||||||||
|
|
|
|
|
|
|
|
|
|
|
|
|
|||||||||||||
| Total other income and deductions |
(49 | ) | (21 | ) | (70 | ) | 104 | (155 | ) | (51 | ) | |||||||||||||
|
|
|
|
|
|
|
|
|
|
|
|
|
|||||||||||||
| Income before income taxes |
2,827 | 370 | 3,197 | 3,150 | (65 | ) | 3,085 | |||||||||||||||||
| Income taxes |
1,056 | 139 | (b),(c),(d),(e), (f),(g),(h),(i),(j) | 1,195 | 1,178 | (21 | )(b),(d),(f),(h),(k),(l),(m),(n) | 1,157 | ||||||||||||||||
|
|
|
|
|
|
|
|
|
|
|
|
|
|||||||||||||
| Net income |
$ | 1,771 | $ | 231 | $ | 2,002 | $ | 1,972 | $ | (44 | ) | $ | 1,928 | |||||||||||
|
|
|
|
|
|
|
|
|
|
|
|
|
|||||||||||||
| (a) | Results reported in accordance with GAAP. |
| (b) | Adjustment to exclude costs associated with the planned retirement of fossil generating units and the impacts of the FERC approved reliability-must-run rate schedule. |
| (c) | Adjustment to exclude the non-cash bargain purchase gain (negative goodwill) associated with the acquisition of Wolf Hollow, net of acquisition costs. |
| (d) | Adjustment to exclude the mark-to-market impact of Generation’s economic hedging activities. |
| (e) | Adjustment to exclude certain costs associated with Exelon’s proposed acquisition of Constellation. |
| (f) | Adjustment to exclude certain costs associated with Exelon’s acquisition of Exelon Wind in 2010 and Exelon’s acquisition of AVSR 1 in 2011. |
| (g) | Adjustment to exclude the increase in Generation’s decommissioning obligation for spent nuclear fuel at Zion. |
| (h) | Adjustment to exclude the unrealized losses in 2011 and unrealized gains in 2010 associated with Generation’s NDT fund investments and the associated contractual accounting relating to income taxes. |
| (i) | Adjustment to exclude the non-cash impacts of the annual remeasurement of state deferred income taxes. |
| (j) | Adjustment to exclude a one-time, non-cash charge to remeasure deferred taxes at higher corporate tax rates pursuant to the Illinois tax rate change legislation. |
| (k) | Adjustment to exclude the impact of the 2007 Illinois electric rate settlement. |
| (l) | Adjustment to exclude a non-cash charge for the impairment of certain SO2 emission allowances as a result of declining market prices following the release of the EPA’s proposed Transport Rule in the third quarter of 2010. |
| (m) | Adjustment to exclude a non-cash charge related to the passage of Federal health care legislation that reduces the deductibility of retiree prescription drug benefits for Federal income tax purposes to the extent they are reimbursed under Medicare Part D. |
| (n) | Adjustment to exclude a 2010 remeasurement of income tax uncertainties. |
18
Reconciliation of Adjusted (non-GAAP) Operating Earnings
to GAAP Consolidated Statements of Operations (unaudited)
ComEd
| Twelve Months Ended December 31, 2011 | Twelve Months Ended December 31, 2010 | |||||||||||||||||||||||
| (in millions) |
GAAP(a) | Adjustments | Adjusted Non-GAAP |
GAAP(a) | Adjustments | Adjusted Non-GAAP |
||||||||||||||||||
| Operating revenues |
$ | 6,056 | $ | — | $ | 6,056 | $ | 6,204 | $ | 4 | (e),(f) | $ | 6,208 | |||||||||||
| Operating expenses |
||||||||||||||||||||||||
| Purchased power |
3,035 | — | 3,035 | 3,307 | — | 3,307 | ||||||||||||||||||
| Operating and maintenance |
1,086 | 13 | (c) | 1,099 | 975 | 7 | (g),(h) | 982 | ||||||||||||||||
| Operating and maintenance for regulatory required programs(b) |
115 | — | 115 | 94 | — | 94 | ||||||||||||||||||
| Depreciation and amortization |
542 | — | 542 | 516 | — | 516 | ||||||||||||||||||
| Taxes other than income |
296 | — | 296 | 256 | — | 256 | ||||||||||||||||||
|
|
|
|
|
|
|
|
|
|
|
|
|
|||||||||||||
| Total operating expenses |
5,074 | 13 | 5,087 | 5,148 | 7 | 5,155 | ||||||||||||||||||
|
|
|
|
|
|
|
|
|
|
|
|
|
|||||||||||||
| Operating income |
982 | (13 | ) | 969 | 1,056 | (3 | ) | 1,053 | ||||||||||||||||
|
|
|
|
|
|
|
|
|
|
|
|
|
|||||||||||||
| Other income and deductions |
||||||||||||||||||||||||
| Interest expense, net |
(345 | ) | — | (345 | ) | (386 | ) | 59 | (i) | (327 | ) | |||||||||||||
| Other, net |
29 | — | 29 | 24 | — | 24 | ||||||||||||||||||
| Total other income and deductions |
(316 | ) | — | (316 | ) | (362 | ) | 59 | (303 | ) | ||||||||||||||
|
|
|
|
|
|
|
|
|
|
|
|
|
|||||||||||||
| Income before income taxes |
666 | (13 | ) | 653 | 694 | 56 | 750 | |||||||||||||||||
| Income taxes |
250 | — | (c),(d) | 250 | 357 | (59 | )(e),(f),(g),(h),(i) | 298 | ||||||||||||||||
|
|
|
|
|
|
|
|
|
|
|
|
|
|||||||||||||
| Net income |
$ | 416 | $ | (13 | ) | $ | 403 | $ | 337 | $ | 115 | $ | 452 | |||||||||||
|
|
|
|
|
|
|
|
|
|
|
|
|
|||||||||||||
| (a) | Results reported in accordance with GAAP. |
| (b) | Includes amounts for various legislative and/or regulatory programs that are recoverable from customers on a full and current basis through a reconcilable automatic adjustment clause. An equal and offsetting amount has been reflected in operating revenues. |
| (c) | Adjustment to exclude one-time benefits for the recovery of previously incurred costs related to the 2009 restructuring plan and for the passage of Federal health care legislation in 2010. |
| (d) | Adjustment to exclude a one-time, non-cash charge to remeasure deferred taxes at higher corporate tax rates pursuant to the Illinois tax rate change legislation. |
| (e) | Adjustment to exclude the impact of the 2007 Illinois electric rate settlement. |
| (f) | Adjustment to exclude the costs associated with ComEd’s 2007 settlement agreement with the City of Chicago. |
| (g) | Adjustment to exclude a decrease in 2010 in ComEd’s asset retirement obligation. |
| (h) | Adjustment to exclude a non-cash charge related to the passage of Federal health care legislation that reduces the deductibility of retiree prescription drug benefits for Federal income tax purposes to the extent they are reimbursed under Medicare Part D. |
| (i) | Adjustment to exclude a 2010 remeasurement of income tax uncertainties. |
19
Reconciliation of Adjusted (non-GAAP) Operating Earnings
to GAAP Consolidated Statements of Operations (unaudited)
PECO
| Twelve Months Ended December 31, 2011 | Twelve Months Ended December 31, 2010 | |||||||||||||||||||||||
| (in millions) |
GAAP(a) | Adjustments | Adjusted Non-GAAP |
GAAP(a) | Adjustments | Adjusted Non-GAAP |
||||||||||||||||||
| Operating revenues |
$ | 3,720 | $ | — | $ | 3,720 | $ | 5,519 | $ | — | $ | 5,519 | ||||||||||||
| Operating expenses |
||||||||||||||||||||||||
| Purchased power |
1,547 | — | 1,547 | 2,361 | — | 2,361 | ||||||||||||||||||
| Fuel |
317 | — | 317 | 401 | — | 401 | ||||||||||||||||||
| Operating and maintenance |
725 | 1 | (c),(d) | 726 | 680 | (1 | )(d),(e) | 679 | ||||||||||||||||
| Operating and maintenance for regulatory required programs(b) |
69 | — | 69 | 53 | — | 53 | ||||||||||||||||||
| Depreciation and amortization |
202 | — | 202 | 1,060 | — | 1,060 | ||||||||||||||||||
| Taxes other than income |
205 | — | 205 | 303 | — | 303 | ||||||||||||||||||
|
|
|
|
|
|
|
|
|
|
|
|
|
|||||||||||||
| Total operating expenses |
3,065 | 1 | 3,066 | 4,858 | (1 | ) | 4,857 | |||||||||||||||||
|
|
|
|
|
|
|
|
|
|
|
|
|
|||||||||||||
| Operating income |
655 | (1 | ) | 654 | 661 | 1 | 662 | |||||||||||||||||
| Other income and deductions |
||||||||||||||||||||||||
| Interest expense, net |
(134 | ) | — | (134 | ) | (193 | ) | 36 | (f) | (157 | ) | |||||||||||||
| Loss in equity method investments |
— | — | — | — | — | — | ||||||||||||||||||
| Other, net |
14 | — | 14 | 8 | 2 | (f) | 10 | |||||||||||||||||
|
|
|
|
|
|
|
|
|
|
|
|
|
|||||||||||||
| Total other income and deductions |
(120 | ) | — | (120 | ) | (185 | ) | 38 | (147 | ) | ||||||||||||||
|
|
|
|
|
|
|
|
|
|
|
|
|
|||||||||||||
| Income before income taxes |
535 | (1 | ) | 534 | 476 | 39 | 515 | |||||||||||||||||
| Income taxes |
146 | — | (c),(d) | 146 | 152 | 8 | (d),(e),(f) | 160 | ||||||||||||||||
|
|
|
|
|
|
|
|
|
|
|
|
|
|||||||||||||
| Net income |
$ | 389 | $ | (1 | ) | $ | 388 | $ | 324 | $ | 31 | $ | 355 | |||||||||||
|
|
|
|
|
|
|
|
|
|
|
|
|
|||||||||||||
| (a) | Results reported in accordance with GAAP. |
| (b) | Includes amounts for various legislative and/or regulatory programs that are recoverable from customers on a full and current basis through a reconcilable automatic adjustment clause. An equal and offsetting amount has been reflected in operating revenues. |
| (c) | Adjustment to exclude certain costs associated with Exelon’s proposed acquisition of Constellation. |
| (d) | Adjustment to exclude a decrease in 2011 and 2010 in PECO’s asset retirement obligation. |
| (e) | Adjustment to exclude a non-cash charge related to the passage of Federal health care legislation that reduces the deductibility of retiree prescription drug benefits for Federal income tax purposes to the extent they are reimbursed under Medicare Part D. |
| (f) | Adjustment to exclude a 2010 remeasurement of income tax uncertainties. |
20
Supply and Sales Statistics
Exelon Generation – Annual Electric Supply and Sales Statistics
| Twelve Months Ended December 31, | ||||||||
| (in GWhs) |
2011 | 2010 | ||||||
| Supply |
||||||||
| Nuclear Generation(a) |
||||||||
| Mid-Atlantic |
47,287 | 47,517 | ||||||
| Midwest |
92,010 | 92,493 | ||||||
|
|
|
|
|
|||||
| Total Nuclear Generation |
139,297 | 140,010 | ||||||
|
|
|
|
|
|||||
| Fossil and Renewables |
||||||||
| Mid-Atlantic(a),(b) |
7,580 | 9,436 | ||||||
| Midwest |
596 | 68 | ||||||
| South and West |
3,462 | 1,213 | ||||||
|
|
|
|
|
|||||
| Total Fossil and Renewables |
11,638 | 10,717 | ||||||
|
|
|
|
|
|||||
| Purchased Power |
||||||||
| Mid-Atlantic |
2,898 | 1,918 | ||||||
| Midwest |
5,970 | 7,032 | ||||||
| South and West |
10,040 | 12,112 | ||||||
|
|
|
|
|
|||||
| Total Purchased Power |
18,908 | 21,062 | ||||||
|
|
|
|
|
|||||
| Total Supply by Region |
||||||||
| Mid-Atlantic |
57,765 | 58,871 | ||||||
| Midwest |
98,576 | 99,593 | ||||||
| South and West |
13,502 | 13,325 | ||||||
|
|
|
|
|
|||||
| Total Supply |
169,843 | 171,789 | ||||||
|
|
|
|
|
|||||
| Electric Sales |
||||||||
|
ComEd(c) |
— | 5,323 | ||||||
|
PECO(d) |
— | 42,003 | ||||||
| Market and Retail(c),(d) |
169,843 | 124,463 | ||||||
|
|
|
|
|
|||||
| Total Electric Sales(e) |
169,843 | 171,789 | ||||||
|
|
|
|
|
|||||
| Average Margin ($/MWh)(f),(g), (h) |
||||||||
| Mid-Atlantic |
$ | 58.15 | $ | 42.67 | ||||
| Midwest |
35.98 | 40.98 | ||||||
| South and West |
5.18 | (9.83 | ) | |||||
| Average Margin – Overall Portfolio |
41.07 | 37.62 | ||||||
| Around-the-clock (ATC) Market Prices ($/MWh)(i) |
||||||||
| PJM West Hub |
$ | 43.56 | $ | 45.93 | ||||
| NIHUB |
33.07 | 33.09 | ||||||
| ERCOT North Spark Spread |
11.88 | 2.31 | ||||||
| (a) | Includes Generation’s proportionate share of the output of its jointly owned generating plants. |
| (b) | Includes New England generation. |
| (c) | ComEd line item represents sales under the 2006 ComEd Auction. Settlements of the ComEd swap and sales under the Request for Proposal (RFP) are included within Market and Retail sales. In addition, renewable energy credit sales to affiliates have been included within Market and Retail sales. |
| (d) | PECO line item represents sales under the 2006 PECO PPA. Sales to PECO through the competitive procurement process are included within market and retail sales. |
| (e) | Total sales do not include trading volume of 5,742 GWhs and 3,625 GWhs for the years ended December 31, 2011 and 2010, respectively. |
| (f) | Excludes retail gas activity, trading portfolio and other operating revenue. |
| (g) | Excludes the mark-to-market impact of Generation’s economic hedging activities. |
| (h) | Results of transactions with PECO and ComEd are included in the Mid-Atlantic and Midwest regions, respectively. |
| (i) | Represents the average for the year. |
Exelon Generation – Financial Swap Agreement with ComEd
| Portion of Term |
Fixed Price ($/MWh) | Notional Quantity (MW)(a) | ||||||
| January 1, 2012 – December 31, 2012 |
$ | 52.37 | 3,000 | |||||
| January 1, 2013 – May 31, 2013 |
$ | 53.48 | 3,000 | |||||
| (a) | Market-based contract for ATC baseload energy only; does not include capacity, ancillary services or congestion. Agreement effective June 1, 2008. |
21
Supply and Sales Statistics
Exelon Generation – Electric Supply and Sales by Quarter
| Three Months Ended | ||||||||||||||||||||
| (in GWhs) |
December 31, 2011 |
September 30, 2011 |
June 30, 2011 |
March 31, 2011 |
December 31, 2010 |
|||||||||||||||
| Supply |
||||||||||||||||||||
| Nuclear Generation(a) |
||||||||||||||||||||
| Mid-Atlantic |
11,587 | 12,158 | 11,172 | 12,370 | 11,974 | |||||||||||||||
| Midwest |
23,306 | 23,887 | 21,995 | 22,822 | 23,141 | |||||||||||||||
|
|
|
|
|
|
|
|
|
|
|
|||||||||||
| Total Nuclear Generation |
34,893 | 36,045 | 33,167 | 35,192 | 35,115 | |||||||||||||||
| Fossil and Renewables |
||||||||||||||||||||
| Mid-Atlantic(a)(b) |
1,637 | 1,724 | 2,054 | 2,166 | 2,115 | |||||||||||||||
| Midwest(c) |
188 | 88 | 163 | 157 | 45 | |||||||||||||||
| South and West(c) |
851 | 1,463 | 638 | 509 | 93 | |||||||||||||||
|
|
|
|
|
|
|
|
|
|
|
|||||||||||
| Total Fossil and Renewables |
2,676 | 3,275 | 2,855 | 2,832 | 2,253 | |||||||||||||||
| Purchased Power |
||||||||||||||||||||
| Mid-Atlantic |
739 | 702 | 707 | 750 | 442 | |||||||||||||||
| Midwest |
1,143 | 1,756 | 1,659 | 1,412 | 1,776 | |||||||||||||||
| South and West |
1,632 | 3,815 | 2,411 | 2,181 | 2,632 | |||||||||||||||
|
|
|
|
|
|
|
|
|
|
|
|||||||||||
| Total Purchased Power |
3,514 | 6,273 | 4,777 | 4,343 | 4,850 | |||||||||||||||
| Total Supply by Region |
||||||||||||||||||||
| Mid-Atlantic |
13,963 | 14,584 | 13,933 | 15,286 | 14,531 | |||||||||||||||
| Midwest |
24,637 | 25,731 | 23,817 | 24,391 | 24,962 | |||||||||||||||
| South and West |
2,483 | 5,278 | 3,049 | 2,690 | 2,725 | |||||||||||||||
|
|
|
|
|
|
|
|
|
|
|
|||||||||||
| Total Supply |
41,083 | 45,593 | 40,799 | 42,367 | 42,218 | |||||||||||||||
|
|
|
|
|
|
|
|
|
|
|
|||||||||||
| Three Months Ended | ||||||||||||||||||||
| (in GWhs) |
December 31, 2011 |
September 30, 2011 |
June 30, 2011 |
March 31, 2011 |
December 31, 2010 |
|||||||||||||||
| Electric Sales |
||||||||||||||||||||
|
PECO(d) |
— | — | — | — | 9,756 | |||||||||||||||
| Market and Retail(d) |
41,083 | 45,593 | 40,799 | 42,367 | 32,462 | |||||||||||||||
|
|
|
|
|
|
|
|
|
|
|
|||||||||||
| Total Electric Sales(e) |
41,083 | 45,593 | 40,799 | 42,367 | 42,218 | |||||||||||||||
|
|
|
|
|
|
|
|
|
|
|
|||||||||||
| Average Margin ($/MWh)(f),(g),(h) |
||||||||||||||||||||
| Mid-Atlantic |
$ | 56.29 | $ | 57.32 | $ | 58.92 | $ | 59.92 | $ | 51.75 | ||||||||||
| Midwest |
34.18 | 33.15 | 37.28 | 39.60 | 41.14 | |||||||||||||||
| South and West |
(5.24 | ) | 18.57 | (3.61 | ) | (1.49 | ) | (10.64 | ) | |||||||||||
| Average Margin – Overall Portfolio |
39.31 | 39.19 | 41.59 | 44.30 | 41.45 | |||||||||||||||
| Around-the-clock Market Prices ($/MWh)(i) |
||||||||||||||||||||
| PJM West Hub |
$ | 35.07 | $ | 46.17 | $ | 47.27 | $ | 45.82 | $ | 43.65 | ||||||||||
| NiHUB |
25.97 | 37.30 | 34.94 | 34.10 | 27.26 | |||||||||||||||
| ERCOT North Spark Spread |
1.11 | 36.70 | 6.73 | 8.00 | (0.69 | ) | ||||||||||||||
| (a) | Includes Generation’s proportionate share of the output of its jointly owned generating plants. |
| (b) | Includes New England generation. |
| (c) | Includes generation from Exelon Wind, acquired in December, 2010, of 186 GWh, 76 GWh, 154 GWh, 155 GWh and 41 GWh in the Midwest and 394 GWh, 249 GWh, 431 GWh, 358 GWh and 84 GWh in the South and West for the three months ended December 31, 2011, September 30, 2011, June 30, 2011, March 31, 2011 and December 31, 2010, respectively. |
| (d) | PECO line item represents sales under the PECO PPA. Settlements of the ComEd swap, sales under the Request for Proposal (RFP) and sales to PECO through the competitive procurement process are included within Market and Retail sales. |
| (e) | Total sales do not include physical trading volume of 1,235 GWh, 1,679 GWh, 1,496 GWh, 1,333 GWh, and 740 GWh for the three months ended December 31, 2011,September 30, 2011, June 30, 2011, March 31, 2011 and December 31, 2010 respectively. |
| (f) | Excludes retail gas activity, trading portfolio activity and amounts paid related to the Illinois Settlement Legislation and compensation under the reliability-must-run rate schedule. |
| (g) | Excludes the mark-to-market impact of Generation’s economic hedging activities. |
| (h) | Results of transactions with PECO and ComEd are included in the Mid-Atlantic and Midwest regions, respectively. |
| (i) | Represents the average for the quarter. |
22
Supply and Sales Statistics
ComEd – Electric Sales Statistics, Revenue and Customer Detail
| 2011 | 2010 | |||||||
| Retail Deliveries(a) (in GWhs) |
||||||||
| Residential |
28,273 | 29,171 | ||||||
| Small Commercial & Industrial |
32,281 | 32,904 | ||||||
| Large Commercial & Industrial |
27,732 | 27,717 | ||||||
| Public Authorities & Electric Railroads |
1,235 | 1,273 | ||||||
|
|
|
|
|
|||||
| Total Retail Deliveries |
89,521 | 91,065 | ||||||
|
|
|
|
|
|||||
| Electric Revenue (in millions) |
||||||||
| Retail Revenues(a) |
||||||||
| Residential |
$ | 3,510 | $ | 3,549 | ||||
| Small Commercial & Industrial |
1,517 | 1,639 | ||||||
| Large Commercial & Industrial |
383 | 397 | ||||||
| Public Authorities & Electric Railroads |
50 | 62 | ||||||
|
|
|
|
|
|||||
| Total Retail Revenues |
5,460 | 5,647 | ||||||
|
|
|
|
|
|||||
| Other Revenues(b) |
596 | 557 | ||||||
|
|
|
|
|
|||||
| Total Electric Revenues |
$ | 6,056 | $ | 6,204 | ||||
|
|
|
|
|
|||||
| Customers at Year End |
||||||||
| 2011 | 2010 | |||||||
| Retail Deliveries Customers |
||||||||
| Residential |
3,448,481 | 3,438,677 | ||||||
| Small Commercial & Industrial |
365,824 | 363,393 | ||||||
| Large Commercial & Industrial |
2,032 | 2,005 | ||||||
| Public Authorities & Electric Railroads |
4,797 | 5,078 | ||||||
|
|
|
|
|
|||||
| Total Retail Deliveries Customers |
3,821,134 | 3,809,153 | ||||||
|
|
|
|
|
|||||
| Heating and Cooling Degree Days |
||||||||
| 2011 | 2010 | |||||||
| Heating Degree Days (normal=6,362) |
6,134 | 5,991 | ||||||
| Cooling Degree Days (normal=855) |
1,036 | 1,181 | ||||||
| Peak System Load |
||||||||
| 2011 | 2010 | |||||||
| Summer(d) |
||||||||
| Highest Peak Load (MW) |
23,753 | (c) | 21,914 | |||||
| Winter(f) |
||||||||
| Highest Peak Load (MW) |
15,656 | 16,092 | ||||||
| (a) | Reflects delivery revenues and volumes from customers purchasing electricity directly from ComEd and customers purchasing electricity from a competitive electric generation supplier as all customers are assessed delivery charges. For customers purchasing electricity from ComEd, revenue also reflects the cost of energy. |
| (b) | Other revenue primarily includes transmission revenue from PJM Interconnection, LLC (PJM). |
| (c) | Refers to the normal time period of 30 years ending 2006. As of calendar year 2012 ComEd began using a new normal time period: 30 years ending 2010. The HDD and CDD normals for this period are 6,340 and 842, respectively. |
| (d) | Summer is defined as June 1 to September 30 of the reporting year. |
| (e) | The summer peak load of 23,753 MW that occured on July 20, 2011 is the all-time peak load for ComEd. |
| (f) | Winter is defined as November 1 of the previous year to March 31 of the reporting year. |
23
Supply and Sales Statistics
PECO – Electric Sales Statistics, Revenue and Customer Detail
| 2011 | 2010 | |||||||
| Retail Deliveries(a) (in GWhs) |
||||||||
| Residential |
13,687 | 13,913 | ||||||
| Small Commercial & Industrial |
8,321 | 8,503 | ||||||
| Large Commercial & Industrial |
15,677 | 16,372 | ||||||
| Public Authorities & Electric Railroads |
945 | 925 | ||||||
|
|
|
|
|
|||||
| Total Retail Deliveries |
38,630 | 39,713 | ||||||
|
|
|
|
|
|||||
| Electric Revenue (in millions) |
||||||||
| Retail Revenues(a) |
||||||||
| Residential |
$ | 1,934 | $ | 2,069 | ||||
| Small Commercial & Industrial |
584 | 1,060 | ||||||
| Large Commercial & Industrial |
304 | 1,362 | ||||||
| Public Authorities & Electric Railroads |
38 | 89 | ||||||
|
|
|
|
|
|||||
| Total Retail Revenues |
2,860 | 4,580 | ||||||
|
|
|
|
|
|||||
| Other Revenues(b) |
249 | 255 | ||||||
|
|
|
|
|
|||||
| Total Electric Revenues |
$ | 3,109 | $ | 4,835 | ||||
|
|
|
|
|
|||||
| Customers at Year End |
||||||||
| 2011 | 2010 | |||||||
| Retail Deliveries Customers |
||||||||
| Residential |
1,415,681 | 1,411,643 | ||||||
| Small Commercial & Industrial |
157,137 | 156,865 | ||||||
| Large Commercial & Industrial |
3,110 | 3,071 | ||||||
| Public Authorities & Electric Railroads |
1,122 | 1,102 | ||||||
|
|
|
|
|
|||||
| Total Retail Deliveries Customers |
1,577,050 | 1,572,681 | ||||||
|
|
|
|
|
|||||
| Heating and Cooling Degree Days |
||||||||
| 2011 | 2010 | |||||||
| Heating Degree Days (normal=4,638) |
4,157 | 4,396 | ||||||
| Cooling Degree Days (normal=1,292) |
1,617 | 1,817 | ||||||
| Peak System Load |
||||||||
| 2011 | 2010 | |||||||
| Summer(c) |
||||||||
| Highest Peak Load (MW) |
8,983 | (d) | 8,864 | |||||
| Winter(d) |
||||||||
| Highest Peak Load (MW) |
6,675 | 6,333 | ||||||
| (a) | Reflects delivery revenues and volumes from customers purchasing electricity directly from PECO and customers purchasing electricity from a competitive electric generation supplier as all customers are assessed delivery charges and a CTC. For customers purchasing electricity from PECO, revenue also reflects the cost of energy. |
| (b) | Other revenue includes transmission revenue from PJM and wholesale revenues. |
| (c) | Summer is defined as June 1 to September 30 of the reporting year. |
| (d) | The summer peak load of 8,983 MW that occured on July 22, 2011 is the all-time peak load for PECO. |
| (e) | Winter is defined as November 1 of the previous year to March 31 of the reporting year. |
24
Supply and Sales Statistics
PECO – Gas Sales Statistics, Revenue and Customer Detail
| 2011 | 2010 | |||||||
| Deliveries to Customers (in mmcf) |
||||||||
| Retail Sales |
54,239 | 56,833 | ||||||
| Transportation |
28,204 | 30,911 | ||||||
|
|
|
|
|
|||||
| Total Gas Deliveries |
82,443 | 87,744 | ||||||
|
|
|
|
|
|||||
| Gas Revenue (in millions) |
||||||||
| Retail Sales |
$ | 575 | $ | 656 | ||||
| Transportation and Other |
36 | 28 | ||||||
|
|
|
|
|
|||||
| Total Gas Revenue |
$ | 611 | $ | 684 | ||||
|
|
|
|
|
|||||
| Gas Customers at Year End |
||||||||
| 2011 | 2010 | |||||||
| Customers |
||||||||
| Residential |
451,382 | 448,391 | ||||||
| Commercial & Industrial |
41,373 | 41,303 | ||||||
|
|
|
|
|
|||||
| Total Retail Customers |
492,755 | 489,694 | ||||||
| Transportation |
879 | 838 | ||||||
|
|
|
|
|
|||||
| Total Gas Customers |
493,634 | 490,532 | ||||||
|
|
|
|
|
|||||
| Gas Maximum Day Sendout |
||||||||
| 2011 | 2010 | |||||||
| Winter |
||||||||
| Maximum Day Sendout (in thousand cubic feet (mcf)) |
667,061 | 662,945 | ||||||
25
Exelon Generation – Total Owned Generating Capacity
Owned net electric generating capacity by station at December 31, 2011:
Base-load units are plants that normally operate to take all or part of the minimum continuous load of a system, and consequently produce electricity at an essentially constant rate. Intermediate units are plants that normally operate to take load of a system during the daytime higher load hours, and consequently produce electricity by cycling on and off daily. Peaking units consist of low-efficiency, quick response steam units, gas turbines, diesels, and pumped-storage hydroelectric equipment normally used during the maximum load periods.
| Station |
Location |
Number of Units |
Percent Owned(a) |
Primary |
Primary Type |
Net Generation Capacity(b) (MW) |
||||||||||||
| Nuclear |
||||||||||||||||||
| Braidwood |
Braidwood, IL | 2 | Uranium | Base-load | 2,348 | |||||||||||||
| Byron |
Byron, IL | 2 | Uranium | Base-load | 2,323 | |||||||||||||
| Clinton |
Clinton, IL | 1 | Uranium | Base-load | 1,067 | |||||||||||||
| Dresden |
Morris, IL | 2 | Uranium | Base-load | 1,753 | |||||||||||||
| LaSalle |
Seneca, IL | 2 | Uranium | Base-load | 2,316 | |||||||||||||
| Limerick |
Limerick Twp., PA | 2 | Uranium | Base-load | 2,312 | |||||||||||||
| Oyster Creek |
Forked River, NJ | 1 | Uranium | Base-load | 625 | (c) | ||||||||||||
| Peach Bottom |
Peach Bottom Twp., PA | 2 | 50.00 | Uranium | Base-load | 1,150 | (d) | |||||||||||
| Quad Cities |
Cordova, IL | 2 | 75.00 | Uranium | Base-load | 1,380 | (d) | |||||||||||
| Salem |
Hancock’s Bridge, NJ | 2 | 42.59 | Uranium | Base-load | 1,004 | (d) | |||||||||||
| Three Mile Island |
Londonderry Twp, PA | 1 | Uranium | Base-load | 837 | |||||||||||||
|
|
|
|||||||||||||||||
| 17,115 | ||||||||||||||||||
| Fossil (Steam Turbines)(e) |
||||||||||||||||||
| Conemaugh |
New Florence, PA | 2 | 20.72 | Coal | Base-load | 352 | (d) | |||||||||||
| Eddystone 3, 4 |
Eddystone, PA | 2 | Oil/Gas | Intermediate | 760 | |||||||||||||
| Handley 4, 5 |
Fort Worth, TX | 2 | Gas | Peaking | 870 | |||||||||||||
| Handley 3 |
Fort Worth, TX | 1 | Gas | Intermediate | 395 | |||||||||||||
| Keystone |
Shelocta, PA | 2 | 20.99 | Coal | Base-load | 357 | (d) | |||||||||||
| Mountain Creek 6, 7 |
Dallas, TX | 2 | Gas | Peaking | 240 | |||||||||||||
| Mountain Creek 8 |
Dallas, TX | 1 | Gas | Intermediate | 565 | |||||||||||||
| Schuylkill |
Philadelphia, PA | 1 | Oil | Peaking | 166 | |||||||||||||
| Wolf Hollow 1, 2 |
Granbury, TX | 2 | Gas | Intermediate | 425 | |||||||||||||
| Wolf Hollow 3 |
Granbury, TX | 1 | Gas | Intermediate | 280 | |||||||||||||
| Wyman |
Yarmouth, ME | 1 | 5.89 | Oil | Intermediate | 36 | (d) | |||||||||||
|
|
|
|||||||||||||||||
| 4,446 | ||||||||||||||||||
| Fossil (Combustion Turbines) |
||||||||||||||||||
| Chester |
Chester, PA | 3 | Oil | Peaking | 39 | |||||||||||||
| Croydon |
Bristol Twp., PA | 8 | Oil | Peaking | 391 | |||||||||||||
| Delaware |
Philadelphia, PA | 4 | Oil | Peaking | 56 | |||||||||||||
| Eddystone |
Eddystone, PA | 4 | Oil | Peaking | 60 | |||||||||||||
| Falls |
Falls Twp., PA | 3 | Oil | Peaking | 51 | |||||||||||||
| Framingham |
Framingham, MA | 3 | Oil | Peaking | 28 | |||||||||||||
| LaPorte |
Laporte, TX | 4 | Gas | Peaking | 152 | |||||||||||||
| Medway |
West Medway, MA | 3 | Oil/Gas | Peaking | 105 | |||||||||||||
| Moser |
Lower Pottsgrove Twp., PA | 3 | Oil | Peaking | 51 | |||||||||||||
| New Boston |
South Boston, MA | 1 | Oil | Peaking | 12 | |||||||||||||
| Richmond |
Philadelphia, PA | 2 | Oil | Peaking | 98 | |||||||||||||
| Salem |
Hancock’s Bridge, NJ | 1 | 42.59 | Oil | Peaking | 16 | (d) | |||||||||||
| Schuylkill |
Philadelphia, PA | 2 | Oil | Peaking | 30 | |||||||||||||
| Southeast Chicago |
Chicago, IL | 8 | Gas | Peaking | 296 | |||||||||||||
| Southwark |
Philadelphia, PA | 4 | Oil | Peaking | 52 | |||||||||||||
|
|
|
|||||||||||||||||
| 1,437 | ||||||||||||||||||
26
Exelon Generation – Total Electric Generating Capacity (continued)
Owned net electric generating capacity by station at December 31, 2011:
| Station |
Location |
Number of Units |
Percent Owned(a) |
Primary Fuel |
Primary |
Net Generation Capacity(b) (MW) |
||||||||||||
| Fossil (Internal Combustion/Diesel) |
||||||||||||||||||
| Conemaugh |
New Florence, PA | 4 | 20.72 | Oil | Peaking | 2 | (d) | |||||||||||
| Keystone |
Shelocta, PA | 4 | 20.99 | Oil | Peaking | 2 | (d) | |||||||||||
| Schuylkill |
Philadelphia, PA | 1 | Oil | Peaking | 3 | |||||||||||||
|
|
|
|||||||||||||||||
| 7 | ||||||||||||||||||
| Hydroelectric and Renewable |
||||||||||||||||||
| AgriWind |
Bureau Co., IL | 4 | 99 | Wind | Base-load | 8 | (d) | |||||||||||
| Blue Breezes |
Faribault Co., MN | 2 | Wind | Base-load | 3 | |||||||||||||
| Bluegrass Ridge |
Gentry Co., MO | 27 | 99 | Wind | Base-load | 56 | (d) | |||||||||||
| Brewster |
Jackson Co., MN | 6 | 94-99 | Wind | Base-load | 6 | (d) | |||||||||||
| Cassia |
Twin Falls Co., ID | 14 | Wind | Base-load | 29 | |||||||||||||
| Cisco |
Jackson Co., MN | 4 | 99 | Wind | Base-load | 8 | (d) | |||||||||||
| City Solar |
Chicago, IL | n.a. | Solar | Base-load | 10 | |||||||||||||
| Conception |
Nodaway Co., MO | 24 | Wind | Base-load | 50 | |||||||||||||
| Conowingo |
Harford Co., MD | 11 | Hydroelectric | Base-load | 572 | |||||||||||||
| Cow Branch |
Atchinson Co., MO | 24 | Wind | Base-load | 50 | |||||||||||||
| Cowell |
Pipestone Co., MN | 1 | 99 | Wind | Base-load | 2 | (d) | |||||||||||
| CP Windfarm |
Faribault Co., MN | 2 | Wind | Base-load | 4 | |||||||||||||
| Echo 1 |
Umatilla Co., OR | 21 | 99 | Wind | Base-load | 34 | (d) | |||||||||||
| Echo 2 |
Morrow Co., OR | 10 | Wind | Base-load | 20 | |||||||||||||
| Echo 3 |
Morrow Co., OR | 6 | 99 | Wind | Base-load | 10 | (d) | |||||||||||
| Exelon Wind 1 |
Hansford Co., TX | 8 | Wind | Base-load | 10 | |||||||||||||
| Exelon Wind 2 |
Hansford Co., TX | 8 | Wind | Base-load | 10 | |||||||||||||
| Exelon Wind 3 |
Hansford Co., TX | 8 | Wind | Base-load | 10 | |||||||||||||
| Exelon Wind 4 |
Hansford Co., TX | 38 | Wind | Base-load | 80 | |||||||||||||
| Exelon Wind 5 |
Sherman Co., TX | 8 | Wind | Base-load | 10 | |||||||||||||
| Exelon Wind 6 |
Sherman Co., TX | 8 | Wind | Base-load | 10 | |||||||||||||
| Exelon Wind 7 |
Moore Co., TX | 8 | Wind | Base-load | 10 | |||||||||||||
| Exelon Wind 8 |
Moore Co., TX | 8 | Wind | Base-load | 10 | |||||||||||||
| Exelon Wind 9 |
Moore Co., TX | 8 | Wind | Base-load | 10 | |||||||||||||
| Exelon Wind 10 |
Moore Co., TX | 8 | Wind | Base-load | 10 | |||||||||||||
| Exelon Wind 11 |
Moore Co., TX | 8 | Wind | Base-load | 10 | |||||||||||||
| Ewington |
Jackson Co., MN | 10 | 99 | Wind | Base-load | 20 | (d) | |||||||||||
| Fairless Hills |
Falls Twp, PA | 2 | Landfill Gas | Peaking | 60 | |||||||||||||
| Greensburg |
Kiowa Co., KS | 10 | Wind | Base-load | 13 | |||||||||||||
| Harvest |
Huron Co., MI | 32 | Wind | Base-load | 53 | |||||||||||||
| High Plains |
Moore Co., TX | 8 | 99.5 | Wind | Base-load | 10 | (d) | |||||||||||
| Loess Hills |
Atchinson Co., MO | 4 | Wind | Base-load | 5 | |||||||||||||
| Marshall |
Lyon Co., MN | 9 | 98-99 | Wind | Base-load | 19 | (d) | |||||||||||
| Michigan Wind 1 |
Bingham Twp., MI | 46 | Wind | Base-load | 69 | |||||||||||||
| Michigan Wind 2 |
Bingham Twp., MI | 50 | Wind | Base-load | 90 | |||||||||||||
| Mountain Home |
Elmore Co., ID | 20 | Wind | Base-load | 40 | |||||||||||||
| Muddy Run |
Lancaster, PA | 8 | Hydroelectric | Intermediate | 1,070 | |||||||||||||
| Norgaard |
Lincoln Co., MN | 7 | 99 | Wind | Base-load | 9 | (d) | |||||||||||
| Pennsbury |
Falls Twp., PA | 2 | Landfill Gas | Peaking | 6 | |||||||||||||
| Threemile Canyon |
Morrow Co., OR | 6 | Wind | Base-load | 10 | |||||||||||||
| Tuana Springs |
Twin Falls Co., ID | 8 | Wind | Base-load | 17 | |||||||||||||
| Wolf |
Nobles Co., MN | 5 | 99 | Wind | Base-load | 6 | (d) | |||||||||||
|
|
|
|||||||||||||||||
| 2,539 | ||||||||||||||||||
|
|
|
|||||||||||||||||
| Total |
25,544 | |||||||||||||||||
|
|
|
|||||||||||||||||
| (a) | 100%, unless otherwise indicated. |
| (b) | For nuclear stations, capacity reflects the annual mean rating. All other stations reflect a summer rating. |
| (c) | On December 8, 2010, Generation announced that it will permanently cease generation operation at Oyster Creek by December 31, 2019. |
| (d) | Net generation capacity is stated at proportionate ownership share. |
| (e) | Excludes Eddystone Generating Station Unit 2, which remained in operation presant to a reliability-must-run (RMR) agreement with PJM through May 31, 2012. Eddystone 2 ceased operations at the end of the RMR period. |
27
Exelon Generation – Nuclear Generating Capacity
Exelon Nuclear Fleet(a)(b)
(At December 31, 2011)
| Station |
Location Water Body |
Ownership | Owned Net Capacity (MW) |
2011 Generation (GWh) |
Plant Type |
NSSS Vendor |
||||||||||||||||||
| Braidwood |
Braidwood, IL | 100% Exelon | 2,348 | 19,777 | PWR | W | ||||||||||||||||||
| 2 units |
Kankakee River | |||||||||||||||||||||||
| Byron |
Byron, IL | 100% Exelon | 2,323 | 18,203 | PWR | W | ||||||||||||||||||
| 2 units |
Rock River | |||||||||||||||||||||||
| Clinton |
Clinton, IL | 100% Exelon | 1,067 | 8,658 | BWR | GE | ||||||||||||||||||
| 1 unit |
Clinton Lake | |||||||||||||||||||||||
| Dresden |
Morris, IL | 100% Exelon | 1,753 | 14,714 | BWR | GE | ||||||||||||||||||
| 2 units |
Kankakee River | |||||||||||||||||||||||
| LaSalle |
Seneca, IL | 100% Exelon | 2,316 | 19,256 | BWR | GE | ||||||||||||||||||
| 2 units |
Illinois River | |||||||||||||||||||||||
| Limerick |
Limerick Township, PA | 100% Exelon | 2,312 | 18,463 | BWR | GE | ||||||||||||||||||
| 2 units |
Schuylkill River | (g) | ||||||||||||||||||||||
| Oyster Creek |
Forked River, NJ | 100% Exelon | 625 | 5,298 | BWR | GE | ||||||||||||||||||
| 1 unit |
Barnegat Bay | |||||||||||||||||||||||
| Peach Bottom |
Peach Bottom, PA | 50% Exelon | 1,150 | 9,412 | BWR | GE | ||||||||||||||||||
| 2 units |
Susquehanna River | 50% PSEG Nuclear | ||||||||||||||||||||||
| Quad Cities |
Cordova, IL | 75% Exelon | 1,380 | 11,401 | BWR | GE | ||||||||||||||||||
| 2 units |
Mississippi River | 25% Mid-American | ||||||||||||||||||||||
| Energy Holdings | ||||||||||||||||||||||||
| Salem |
Hancock’s Bridge, NJ | 42.6% Exelon | 1,004 | 7,595 | BWR | W | ||||||||||||||||||
| 2 units |
Deleware Estuary | 57.4% PSEG Nuclear | ||||||||||||||||||||||
| Three Mile |
Londonderry | 100% Exelon | 837 | 6,519 | PWR | B&W | ||||||||||||||||||
| Island |
Township, PA | |||||||||||||||||||||||
| 1 unit |
Susquehanna River | |||||||||||||||||||||||
|
|
|
|
|
|||||||||||||||||||||
| Total |
17,115 | 139,297 | ||||||||||||||||||||||
|
|
|
|
|
|||||||||||||||||||||
| Notes: | Amounts may not add due to rounding |
| Average in-service time = 31 years |
| PWR = Pressurized Water Reactor; BWR = Boiling Water Reactor |
| NSSS = Nuclear Steam Supply System |
| (a) | All stations are operated by Exelon Generation except Salem, which is operated by PSEG Nuclear, a division of Public Service Enterprise Group, Inc. |
| (b) | Owned Capacity and 2011 Generation are stated at Exelon’s ownership portion; unit summer rating is stated independent of ownership. |
| (c) | Open – a system that circulates water withdrawn from the environment, returning it to its source at a higher temperature. Closed – a system that recirculates cooling water with waste heat dissipated to the atmosphere through evaporation. |
| (d) | 18-month refueling cycle. |
| (e) | 24-month refueling cycle. |
| (f) | Dry cask storage will be in operation at all sites prior to the closing of spent fuel storage pools. |
| (g) | Supplemented with water from the Wadesville Mine Pool and the Still Creek Reservoir at Tamaqua via the Schuylkill River, and the Delaware Revier via the Bradshaw Reservoir at Perkiomen Creek. |
| (h) | On December 8, 2010, Generation announced that it will permanently cease generation operations at Oyster Creek by December 31, 2019. |
Nuclear Operating Data(a)
| 2011 | 2010 | 2009 | ||||||||||
| Fleet capacity factor |
93.3 | % | 93.9 | % | 93.6 | % | ||||||
| Fleet production cost per MWh |
$ | 18.86 | $ | 17.31 | $ | 16.07 | ||||||
| (a) | Excludes Salem, which is operated by PSEG. |
Refueling Outages in 2011
| • | Conducted 12 refueling outages-including Salem |
| • | Average refueling outage duration: 24 days |
2011 Net Generation (excluding Salem): 131,701 MWh
Planned Refueling Outages (including Salem)
| 2010: | 10 actual | 2013: 10 planned | ||||
| 2011: | 12 actual | 2014: 11 planned | ||||
| 2012: | 10 planned | 2015: 11 planned |
28
Exelon Generation – Nuclear Generating Capacity
| Cooling Water System(c) |
Unit/ Ownership |
Annual Mean |
Start of Commercial |
Current License |
Last Refueling |
Spent Fuel Pool | ||||||||
| Braidwood |
Closed |
1/100% | 1,190 | 1988 | 2026 | May-12(d) | Dry Cask Storage | |||||||
| (dedicated |
2/100% | 1,157 | 1988 | 2027 | May-11(d) | in operation | ||||||||
| pond) |
||||||||||||||
| Closed |
1/100% | 1,174 | 1985 | 2024 | Apr-11(d) | Dry Cask Storage | ||||||||
| Byron |
2/100% | 1,150 | 1987 | 2026 | Oct-11(d) | in operation | ||||||||
| Closed |
1/100% | 1,067 | 1987 | 2026 | Dec-11(e) | 2018 | ||||||||
| Clinton |
||||||||||||||
| Open |
2/100% | 880 | 1970 | 2029 | Nov-11(e) | Dry Cask Storage | ||||||||
| Dresden |
3/100% | 872 | 1971 | 2031 | Nov-10(e) | in operation | ||||||||
| Closed |
1/100% | 1,154 | 1984 | 2022 | Mar-12(e) | Dry Cask Storage | ||||||||
| LaSalle |
2/100% | 1,162 | 1984 | 2023 | Mar-11(e) | in operation | ||||||||
| Closed |
1/100% | 1,158 | 1986 | 2024 | Mar-12(e) | Dry Cask Storage | ||||||||
| Limerick |
2/100% | 1,153 | 1990 | 2029 | Apr-11(e) | in operation | ||||||||
| Open |
1/100% | 625 | 1969 | 2029(h) | Dec-10(e) | Dry Cask Storage | ||||||||
| Oyster Creek |
in operation | |||||||||||||
| Open |
2/50% | 1,148 | 1974 | 2033 | Oct-10(e) | Dry Cask Storage | ||||||||
| Peach Bottom |
3/50% | 1,152 | 1974 | 2034 | Oct-11(e) | in operation | ||||||||
| Open |
1/75% | 903 | 1973 | 2032 | Jun-11(e) | Dry Cask Storage | ||||||||
| Quad Cities |
2/75% | 937 | 1973 | 2032 | Apr-12(e) | in operation | ||||||||
| Closed |
1/42.6% | 1,181 | 1977 | 2036 | Nov-11(d) | Dry Cask Storage | ||||||||
| Salem |
2/42.6% | 1,176 | 1981 | 2040 | May-11(d) | in operation | ||||||||
| Closed |
1/100% | 837 | 1974 | 2034 | Nov-11(e) | 2023 | ||||||||
| Three Mile Island | ||||||||||||||
29
Exelon Generation – Fossil Emissions and Emission Reduction Technology Summary
Owned generation as of December 31, 2011. Table does not include station auxiliary equipment or plants comprised solely of peaking combustion turbines.
| Net Generation Available for Sale (GWh) | ||||||||||||||||
| Capacity(a) | ||||||||||||||||
| Fossil Station (Location) / Water Body |
(MW) | 2011 | 2010 | 2009 | ||||||||||||
| Conemaugh (New Florence, PA) / Conemaugh River |
352 | 2,240 | 2,519 | 2,517 | ||||||||||||
| Units: 2 coal units (baseload) |
||||||||||||||||
| Data reflects Exelon Generation’s 20.72% plant ownership. |
||||||||||||||||
| Cromby(b) (Phoenixville, PA) / Schuylkill River |
345 | 151 | 564 | 524 | ||||||||||||
| Units: 1 coal unit (intermediate), 1 oil/gas steam unit (intermediate) |
||||||||||||||||
| Eddystone(c) (Eddystone, PA) / Delaware River |
1,408 | 427 | 2,033 | 2,041 | ||||||||||||
| Units: 2 coal units (intermediate), 2 oil/gas steam units (intermediate), |
||||||||||||||||
| 4 combustion turbines (peaking) |
||||||||||||||||
| Fairless Hills (Falls Township, PA) / Delaware River |
60 | 242 | 239 | 237 | ||||||||||||
| Units: 2 landfill gas units (peaking) |
||||||||||||||||
| Handley (Ft. Worth, TX) / Lake Arlington |
1,265 | 585 | 362 | 523 | ||||||||||||
| Units: 3 gas steam units (2 peaking/1 intermediate) |
||||||||||||||||
| Keystone (Shelocta, PA) / Keystone Lake |
357 | 2,346 | 2,844 | 2,212 | ||||||||||||
| Units: 2 coal units (baseload) |
||||||||||||||||
| Data reflects Exelon Generation’s 20.99% plant ownership. |
||||||||||||||||
| Mountain Creek (Dallas, TX) / Mountain Creek cooling pond |
805 | 627 | 726 | 689 | ||||||||||||
| Units: 3 gas steam units (2 peaking/1 intermediate) |
||||||||||||||||
| Schuylkill (Philadelphia, PA) / Schuylkill River |
196 | 6 | 8 | 9 | ||||||||||||
| Units: 1 oil steam unit (peaking) |
||||||||||||||||
| Wolf Hollow(d) (Granbury, TX) / Lake Granbury |
705 | 654 | ||||||||||||||
| Units: 2 gas combined cycle turbines and 1 steam generator (intermediate) |
||||||||||||||||
| (a) | Capacity reflects summer rating and is reported at ownership portion. |
| (b) | Cromby Unit 1 (coal) was retired on May 31, 2011; Cromby Unit 2 (oil/gas steam) was retired on Dec 31, 2011. Retired unit capacity is included in plant totals. |
| (c) | Eddystone Unit 1 (coal) was retired on May 31, 2011; Eddystone Unit 2 (coal) was retired on May 31, 2012. Retired unit capacity is included in plant totals. |
| (d) | Wolf Hollow generating station was acquired effective August 25, 2011; no data prior to the acquisition are included. |
30
Exelon Generation – Fossil Emissions and Emission Reduction Technology Summary
| Emissions (thousand tons) |
Reduction Technology | |||||||||||||||||||||||||||||||
| Post | Low NOx | |||||||||||||||||||||||||||||||
| combustion | burners with | Induced | Cooling | |||||||||||||||||||||||||||||
| SO2 | NOx controls | separated | flue gas | Water | ||||||||||||||||||||||||||||
| Type |
2011 | 2010 | 2009 | Scrubber | (SCR or SNCR) | overfire air | recirculation | System | ||||||||||||||||||||||||
| Conemaugh |
||||||||||||||||||||||||||||||||
| SO2 |
1.5 | 1.5 | 1.5 | X | ||||||||||||||||||||||||||||
| NOx |
3.6 | 4.0 | 3.9 | X | ||||||||||||||||||||||||||||
| CO2 |
2,218.7 | 2,488.2 | 2,486.0 | Closed | ||||||||||||||||||||||||||||
| Cromby |
||||||||||||||||||||||||||||||||
| SO2 |
0.8 | 2.1 | 2.2 | X | ||||||||||||||||||||||||||||
| NOx |
0.4 | 1.3 | 1.1 | (Coal Unit | ) | X | X | |||||||||||||||||||||||||
| CO2 |
243.2 | 680.6 | 615.0 | (Coal Unit | ) | (Coal Unit | ) | Open | ||||||||||||||||||||||||
| Eddystone |
||||||||||||||||||||||||||||||||
| SO2 |
0.9 | 4.9 | 5.3 | X | ||||||||||||||||||||||||||||
| NOx |
0.8 | 3.8 | 3.8 | (Coal Units | ) | X | X | |||||||||||||||||||||||||
| CO2 |
576.7 | 2,749.8 | 2,754.7 | (Coal Units | ) | (Coal Units | ) | Open | ||||||||||||||||||||||||
| Fairless Hills |
||||||||||||||||||||||||||||||||
| SO2 |
0.1 | 0.1 | 0.1 | |||||||||||||||||||||||||||||
| NOx |
0.1 | 0.1 | 0.1 | |||||||||||||||||||||||||||||
| CO2 |
207.7 | 201.1 | 226.0 | Open | ||||||||||||||||||||||||||||
| Handley |
||||||||||||||||||||||||||||||||
| SO2 |
* | * | * | |||||||||||||||||||||||||||||
| NOx |
0.1 | * | * | X | ||||||||||||||||||||||||||||
| CO2 |
422.2 | 263.8 | 377.0 | Open | ||||||||||||||||||||||||||||
| Keystone |
||||||||||||||||||||||||||||||||
| SO2 |
9.7 | 8.2 | 23.7 | |||||||||||||||||||||||||||||
| NOx |
4.4 | 1.2 | 0.8 | X | X | X | ||||||||||||||||||||||||||
| CO2 |
2,383.2 | 2,803.3 | 2,146.2 | Closed | ||||||||||||||||||||||||||||
| Mountain Creek |
||||||||||||||||||||||||||||||||
| SO2 |
* | * | * | |||||||||||||||||||||||||||||
| NOx |
0.1 | 0.1 | 0.1 | X | X | |||||||||||||||||||||||||||
| CO2 |
457.1 | 488.6 | 470.5 | (Unit 8 | ) | (Units 6, 7 | ) | Open | ||||||||||||||||||||||||
| Schuylkill |
||||||||||||||||||||||||||||||||
| SO2 |
* | * | * | |||||||||||||||||||||||||||||
| NOx |
* | * | * | |||||||||||||||||||||||||||||
| CO2 |
15.2 | 15.5 | 14.3 | Open | ||||||||||||||||||||||||||||
| Wolf Hollow |
||||||||||||||||||||||||||||||||
| SO2 |
* | |||||||||||||||||||||||||||||||
| NOx |
0.1 | |||||||||||||||||||||||||||||||
| CO2 |
330.4 | Open | ||||||||||||||||||||||||||||||
| * | Indicates emissions less than 50 tons. |
31
Constellation Energy – Total Owned Generating Capacity
Generating capacity by facility at December 31, 2011:
| Plant |
Location |
2011 Capacity Factor (%)(a) |
Primary Fuel |
Capacity (MW)(b) |
% Owned |
Owned Capacity (MW) |
||||||||||||||
| Nuclear |
||||||||||||||||||||
| Calvert Cliffs Unit 1(c) |
Calvert Co., MD | 100.9 | Uranium | 855 | 50 | 428 | ||||||||||||||
| Calvert Cliffs Unit 2(c) |
Calvert Co., MD | 91.7 | Uranium | 850 | 50 | 425 | ||||||||||||||
| Nine Mile Point Unit 1(c) |
Scriba, NY | 84 | Uranium | 628 | 50 | 314 | ||||||||||||||
| Nine Mile Point Unit 2(c)(d) |
Scriba, NY | 95.4 | Uranium | 1,141 | 41 | 468 | ||||||||||||||
| R.E. Ginna(c) |
Ontario, NY | 84.7 | Uranium | 581 | 50 | 291 | ||||||||||||||
|
|
|
|
|
|||||||||||||||||
| 4,055 | 1,925 | |||||||||||||||||||
| Fossil |
||||||||||||||||||||
| ACE |
Trona, CA | 87.5 | Coal | 102 | 31.1 | 32 | ||||||||||||||
| Brandon Shores(e) |
Anne Arundel Co., MD | 52.6 | Coal | 1,273 | 100 | 1,273 | ||||||||||||||
| C. P. Crane(e) |
Baltimore Co., MD | 27.8 | Oil/Coal | 399 | 100 | 399 | ||||||||||||||
| Colorado Bend Energy Center |
Wharton TX | 31.6 | Gas | 550 | 100 | 550 | ||||||||||||||
| Colver |
Colver Township, PA | 99.8 | Waste Coal | 102 | 25 | 26 | ||||||||||||||
| Conemaugh |
West Moreland Co., PA | 71.5 | Coal | 1,711 | 10.6 | 181 | (f) | |||||||||||||
| Fore River |
North Weymouth, MA | 79.3 | Gas | 688 | 100 | 688 | ||||||||||||||
| Gould Street |
Baltimore City, MD | 2.5 | Gas | 97 | 100 | 97 | ||||||||||||||
| Grande Prairie |
Alberta, Canada | 20.6 | Gas | 93 | 100 | 93 | ||||||||||||||
| H. A. Wagner(e) |
Anne Arundel Co., MD | 18 | Coal/Oil/Gas | 976 | 100 | 976 | ||||||||||||||
| Handsome |
Lake Rockland Twp, PA | 1.9 | Gas | 268 | 100 | 268 | ||||||||||||||
| Hillabee Energy Center |
Alexander City, AL | 64.3 | Gas | 740 | 100 | 740 | ||||||||||||||
| Jasmin |
Kern Co., CA | 94.9 | Coal | 35 | 50 | 18 | ||||||||||||||
| Keystone |
Armstrong & Indiana Cos., PA | 74 | Coal | 1,711 | 21 | 359 | (f) | |||||||||||||
| Mystic 7 |
Charlestown, MA | 2 | Oil/Gas | 560 | 100 | 560 | ||||||||||||||
| Mystic 8 |
Charlestown, MA | 75.8 | Gas | 703 | 100 | 703 | ||||||||||||||
| Mystic 9 |
Charlestown, MA | 74.8 | Gas | 695 | 100 | 695 | ||||||||||||||
| Mystic Jet |
Charlestown, MA | 0.1 | Oil | 9 | 100 | 9 | ||||||||||||||
| Notch Cliff |
Baltimore Co., MD | 2.3 | Gas | 101 | 100 | 101 | ||||||||||||||
| Panther Creek |
Nesquehoning, PA | 98 | Waste Coal | 80 | 50 | 40 | ||||||||||||||
| Perryman |
Harford Co., MD | 2 | Oil/Gas | 347 | 100 | 347 | ||||||||||||||
| Philadelphia Road |
Baltimore Co., MD | 0.8 | Oil | 61 | 100 | 61 | ||||||||||||||
| POSO |
Kern Co., CA | 73.6 | Coal | 35 | 50 | 18 | ||||||||||||||
| Quail Run Energy Center |
Odessa, TX | 14.1 | Gas | 550 | 100 | 550 | ||||||||||||||
| Riverside |
Baltimore Co., MD | 1 | Oil/Gas | 228 | 100 | 228 | ||||||||||||||
| Sunnyside |
Sunnyside, UT | 93.6 | Waste Coal | 51 | 50 | 26 | ||||||||||||||
| West Valley |
Salt Lake City, UT | 10.3 | Gas | 200 | 100 | 200 | ||||||||||||||
| Westport |
Baltimore Co., MD | 0 | Gas | 116 | 100 | 116 | ||||||||||||||
|
|
|
|
|
|||||||||||||||||
| 12,481 | 9,351 | |||||||||||||||||||
32
Constellation Energy – Total Owned Generating Capacity (continued)
| Hydroelectric and Renewable |
||||||||||||||||||||
| Chinese Station |
Jamestown, CA | 70.7 | Biomass | 22 | 45 | 10 | ||||||||||||||
| Fresno |
Fresno, CA | 91.9 | Biomass | 24 | 50 | 12 | ||||||||||||||
| Rocklin |
Placer Co., CA | 86.7 | Biomass | 24 | 50 | 12 | ||||||||||||||
| Malacha |
Muck Valley, CA | 37.4 | Hydroelectric | 32 | 50 | 16 | ||||||||||||||
| Safe Harbor |
Safe Harbor, PA | 44.9 | Hydroelectric | 417 | 66.7 | 278 | ||||||||||||||
| Constellation Solar(g) |
Various | — | Solar | 69 | 100 | 69 | ||||||||||||||
| SEGS IV |
Kramer Junction, CA | 26 | Solar | 33 | 12.2 | 4 | ||||||||||||||
| SEGS V |
Kramer Junction, CA | 37.8 | Solar | 24 | 4.2 | 1 | ||||||||||||||
| SEGS VI |
Kramer Junction, CA | 28.1 | Solar | 34 | 8.8 | 3 | ||||||||||||||
| Criterion |
Oakland, MD | 32.4 | Wind | 70 | 100 | 70 | ||||||||||||||
|
|
|
|
|
|||||||||||||||||
| 749 | 475 | |||||||||||||||||||
|
|
|
|
|
|||||||||||||||||
| Total |
17,294 | 11,751 | ||||||||||||||||||
|
|
|
|
|
|||||||||||||||||
Note: The sums of the individual plant capacities may not equal the category or overall totals due to rounding.
| (a) | Capacity factors are based on installed capacity, which is temperature adjusted. Therefore, it is possible to generate more than 100% of the installed capacity. |
| (b) | Capacity figures represent summer seasonal claimed capacity amounts. For units with power purchase agreements, figures represent contract capacity. |
| (c) | Constellation has a 50.01% equity membership interest in CENG, the joint venture with EDF that holds these nuclear generating assets. |
| (d) | CENG owns 82% of Nine Mile Point Unit 2, the remaining interest in which is owned by Long Island Power Authority. CENG owns 100% of all other nuclear units listed. |
| (e) | Coal assets divested in 2012 as part of the merger agreement. |
| (f) | Reflects Constellation’s proportionate interest in and entitlement to capacity from Keystone and Conemaugh, which include 2 MW of diesel. Capacity for Keystone and 1 MW of diesel capacity for Conemaugh. |
| (g) | Constellation Solar is an operation that constructs, owns, and operates solar facilities at various customer locations. |
33
Constellation Energy – Nuclear Generating Capacity
CENG Fleet
Constellation Energy Nuclear Group (CENG) is a Maryland limited liability company whose members are Constellation Energy Group, Inc (50.01% interest) and EDF, Inc. (49.99% interest). CENG owns and operates five nuclear power reactors on three sites.
(At December 31, 2011)
| Station |
Location Water Body |
Plant Ownership |
Owned Net Capacity (MW)(a) |
2011 Generation (GWh)(a) |
Plant Type |
|||||||||||
| Calvert Cliffs |
Lusby, MD | 50.01% Constellation | 853 | 7,200 | PWR | |||||||||||
| 2 units |
Chesapeake Bay | 49.99% EDF | ||||||||||||||
| Nine Mile Point |
Scriba, NY | 44.20% Constellation(e) | 782 | 6,221 | BWR | |||||||||||
| 2 units |
Lake Erie | 44.19% EDF(e) | ||||||||||||||
| 11.61% LIPA(e) |
||||||||||||||||
| R.E. Ginna |
Ontario, NY | 50.01% Constellation | 291 | 2,148 | PWR | |||||||||||
| 1 unit |
Lake Erie | 49.99% EDF | ||||||||||||||
|
|
|
|
|
|||||||||||||
| Total |
1,925 | 15,569 | ||||||||||||||
|
|
|
|
|
|||||||||||||
| Note: | Amounts may not add due to rounding |
| PWR = Pressurized Water Reactor; BWR = Boiling Water Reactor |
| (a) | Owned Capacity and 2011 Generation are stated at Constellation Energy’s ownership portion. Summer unit rating is stated independent of ownership. |
| (b) | Open – a system that circulates water withdrawn from the environment, returning it to its source at a higher temperature. Closed – a system that recirculates cooling water with waste heat dissipated to the atmosphere through evaporation. |
| (c) | On-site Independent Spent Fuel Storage Installation (IFSI) will be in operation at all sites prior to the closing of spent fuel storage pools. |
| (d) | 24-month refueling cycle |
| (e) | CENG owns 100% of Nine Mile Point Unit 1 and 82% of Nine Mile Point Unit 2. The remaining interest in Nine Mile Point Unit 2 is owned by the Long Island Power Authority (LIPA) |
| (f) | 18-month refueling cycle. |
Nuclear Operating Data
| 2011 | 2010 | 2009 | ||||||||||
| Fleet capacity factor |
92.3 | % | 94.0 | % | 95.7 | % | ||||||
| Fleet production cost per MWh |
$ | 25.35 | $ | 21.33 | $ | 20.86 | ||||||
Refueling Outages in 2011
– Conducted 3 refueling outages
Planned Refueling Outages
| 2010: | 2 actual | 2013: 2 planned | ||
| 2011: | 3 actual | 2014: 3 planned | ||
| 2012: | 3 planned | 2015: 3 planned |
34
Constellation Energy Nuclear Group Fleet
| Cooling
Water System(b) |
Unit/CEG Ownership |
Summer Rating (MW)(a) |
Start of Commercial Operations |
Current License Expiration |
Last Refueling |
Spent Fuel Pool Capacity Reached(c) | ||||||||||||||||||
| Calvert Cliffs |
Open | 1/50.01 | % | 855 | 1975 | 2034 | Apr-12(d) | ISFSI in operation | ||||||||||||||||
| 2/50.01 | % | 850 | 1977 | 2036 | Mar-11(d) | |||||||||||||||||||
| Nine Mile |
Open/ | 1/50.01 | % | 628 | 1970 | 2029 | Apr-11(d) | Fuel pool not full; | ||||||||||||||||
| Point |
Closed | 2/41.01 | % | 1,141 | 1988 | 2046 | Jun-12(d) | ISFSI under | ||||||||||||||||
| R.E. Ginna |
Open | 1/50.01 | % | 581 | 1970 | 2029 | Jun-11(f) | ISFSI in operation | ||||||||||||||||
35
Constellation Energy – Fossil Emissions and Emission Reduction Technology Summary
Owned generation as of December 31, 2011. Table does not include station auxiliary equipment or plants comprised soley of peaking combustion turbines.
| Net Generation Available for Sale (GWh) | ||||||||||||||||
| Capacity(a) | ||||||||||||||||
| Fossil Station (Location) / Water Body |
(MW) | 2011 | 2010 | 2009 | ||||||||||||
| Brandon Shores(b) (Baltimore, MD) / Patapsco River |
1,273 | 5,868 | 6,032 | 6,614 | ||||||||||||
| Units: 2 coal units (baseload) |
||||||||||||||||
| C.P. Crane(b) (Baltimore, MD) / Seneca Creek |
399 | 970 | 845 | 1,063 | ||||||||||||
| Units: 2 coal units (intermediate) & 1 oil combustion turbine (peaking) |
||||||||||||||||
| Colorado Bend Energy Center (Wharton, TX) / Colorado River |
550 | 1,524 | 819 | |||||||||||||
| Units: 4 2x1 CCGTs & 2 steam generators (intermediate) |
||||||||||||||||
| Conemaugh (New Florence, PA) / Conemaugh River |
181 | 1,131 | 1,284 | 1,283 | ||||||||||||
| Units: 2 coal units (baseload) |
||||||||||||||||
| Data reflects Constellation’s 10.6% ownership |
||||||||||||||||
| Fore River (North Weymouth, MA) / Town River |
688 | 4,781 | ||||||||||||||
| Units: 4 2x1 CCGTs & 3 steam generators (intermediate) |
||||||||||||||||
| Gould Street (Baltimore MD) / Patapsco River |
97 | 21 | 22 | 7 | ||||||||||||
| Units: 1 gas steam unit (intermediate) |
||||||||||||||||
| H.A. Wagner(b) (Baltimore, MD) / Patapsco River |
976 | 1,538 | 1,644 | 2,293 | ||||||||||||
| Units: 1 oil/gas steam unit, 2 coal units, 1 oil steam unit, & 1 oil combustion turbine (intermediate) |
||||||||||||||||
| Hillabee Energy Center (Alexander City, AL) / Municipal Supply |
740 | 4,166 | 2,389 | |||||||||||||
| Units: 2 2x1 CCGTs & 1 steam generator (intermediate) |
||||||||||||||||
| (a) | Capacity reflects summer rating and is reported at ownership portion. |
| (b) | Constellation’s Baltimore coal plants were divested in 2012 according to the terms of the merger agreement with the state of Maryland. |
36
Constellation Energy – Fossil Emissions and Emission Reduction Technology Summary
| Emissions (thousand tons) |
Technology |
|||||||||||||||||
| Cooling | ||||||||||||||||||
| Water | ||||||||||||||||||
| Type |
2011 | 2010 | 2009 | Air Pollution Control |
System | |||||||||||||
| Brandon Shores |
||||||||||||||||||
| SO2 |
2.8 | 1.3 | 32.8 | SCR, ESP, activated carbon, injection, | ||||||||||||||
| NOx |
4.8 | 3.8 | 3.5 | baghouse, overfire air, low-NOx burners, | ||||||||||||||
| CO2 |
6,610 | 6,330 | 6,861 | FGD, hydrated lime injection | Closed | |||||||||||||
| C.P. Crane |
||||||||||||||||||
| SO2 |
5.7 | 5.6 | 12.5 | baghouse, overfire air, (natural gas | ||||||||||||||
| NOx |
2.5 | 2.5 | 2.1 | reburn capability), SNCR, activated | ||||||||||||||
| CO2 |
1,242 | 1,050 | 1,216 | carbon injection | Open | |||||||||||||
| Colorado Bend |
||||||||||||||||||
| SO2 |
* | * | ||||||||||||||||
| NOx |
0.1 | 3.1 | ||||||||||||||||
| CO2 |
759 | 513 | SCR, low-NOx burners | Closed | ||||||||||||||
| Conemaugh |
||||||||||||||||||
| SO2 |
0.8 | 0.7 | 0.8 | |||||||||||||||
| NOx |
1.9 | 2.0 | 2.0 | |||||||||||||||
| CO2 |
1,131 | 1,273 | 1,267 | ESP, FGD, low-NOx burners | Closed | |||||||||||||
| Fore River |
||||||||||||||||||
| SO2 |
* | |||||||||||||||||
| NOx |
0.1 | |||||||||||||||||
| CO2 |
2,018 | SCR, low-NOx burners | Open | |||||||||||||||
| Gould Street |
||||||||||||||||||
| SO2 |
* | * | * | |||||||||||||||
| NOx |
* | * | * | |||||||||||||||
| CO2 |
17 | 18 | 6 | low-NOx burners | Open | |||||||||||||
| H.A. Wagner |
||||||||||||||||||
| SO2 |
9.1 | 9.2 | 15.1 | |||||||||||||||
| NOx |
1.7 | 1.5 | 1.7 | ESP, SNCR, low-NOX burners, | ||||||||||||||
| CO2 |
1,760 | 1,820 | 2,401 | activated carbon injection, multicyclones | Open | |||||||||||||
| Hillabee Energy Ctr. |
||||||||||||||||||
| SO2 |
* | * | ||||||||||||||||
| NOx |
0.1 | 0.1 | ||||||||||||||||
| CO2 |
1,786 | 1,020 | SCR | Closed | ||||||||||||||
| * | Indicates emissions less than 50 tons. |
(Continued on next page)
37
Constellation Energy – Fossil Emissions and Emission Reduction Technology Summary (continued)
Owned generation as of December 31, 2011. Table does not include station auxiliary equipment or plants comprised soley of peaking combustion turbines.
| Net Generation Available for Sale (GWh) | ||||||||||||||||
| Fossil Station (Location) / Water Body |
Capacity(a) (MW) |
2011 | 2010 | 2009 | ||||||||||||
| Keystone (Shelocta, PA) / Keystone Lake |
359 | 2,329 | 2,845 | 2,213 | ||||||||||||
| Units: 2 coal units (baseload) |
||||||||||||||||
| Data reflects Constellation’s 21.0% ownership |
||||||||||||||||
| Mystic & Mystic Jet (Charlestown, MA) / Mystic River |
1,967 | 9,324 | ||||||||||||||
| Units: 4 2x1 CCGT, 3 steam generators |
||||||||||||||||
| Panther Creek (Nesquehoning, PA) |
40 | 343 | 338 | 338 | ||||||||||||
| 4th Hollow Reservoir & Lausanne Mine Pool |
||||||||||||||||
| Units: 1 waste coal unit (baseload) |
||||||||||||||||
| Data reflects Constellation’s 50.0% plant ownership |
||||||||||||||||
| Quail Run Energy Center (Odessa, TX) / Municipal |
550 | 681 | 736 | |||||||||||||
| Units: 4 2x1 CCGT & 2 steam generators (intermediate) |
||||||||||||||||
| Riverside (Baltimore, MD) / Patapsco River |
228 | 20 | 13 | 1 | ||||||||||||
| Units: 1 gas steam unit & 3 gas/oil combustion turbines (peaking) |
||||||||||||||||
| (a) | Capacity reflects summer rating and is reported at ownership portion. |
| (b) | Constellation’s Baltimore coal plants were divested in 2012 according to the terms of the merger agreement with the state of Maryland. |
38
Constellation Energy – Fossil Emissions and Emission Reduction Technology Summary (continued)
| Emissions (thousand tons) |
Technology | |||||||||||||||||
| Water | ||||||||||||||||||
| Type |
2011 | 2010 | 2009 | Air Pollution Control | System | |||||||||||||
| Keystone |
||||||||||||||||||
| SO2 |
9.8 | 8.2 | 23.7 | |||||||||||||||
| NOx |
4.4 | 1.2 | 0.8 | |||||||||||||||
| CO2 |
2,383 | 2,805 | 2,152 | ESP, SCR, FGD | Closed | |||||||||||||
| Mystic & Mystic Jet |
||||||||||||||||||
| SO2 |
* | |||||||||||||||||
| NOx |
0.3 | |||||||||||||||||
| CO2 |
4,102 | SCR, low-NOx burners | Open | |||||||||||||||
| Panther Creek |
||||||||||||||||||
| SO2 |
0.3 | 0.3 | 0.3 | |||||||||||||||
| NOx |
0.3 | 0.3 | 0.3 | SNCR, limestone and | ||||||||||||||
| CO2 |
568 | 474 | 453 | ammonia injection, baghouse | Closed | |||||||||||||
| Quail Run Energy Cnt. |
||||||||||||||||||
| SO2 |
* | * | ||||||||||||||||
| NOx |
0.1 | 0.1 | ||||||||||||||||
| CO2 |
398 | 360 | SCR, low-NOx burners | Closed | ||||||||||||||
| Riverside |
||||||||||||||||||
| SO2 |
* | * | * | |||||||||||||||
| NOx |
* | * | * | |||||||||||||||
| CO2 |
16 | 12 | 3 | low-NOx burners | Open | |||||||||||||
| * | Indicates emissions less than 50 tons. |
Exelon Corporation
10 South Dearborn Street, 52nd Floor
Chicago, IL 60603
www.exeloncorp.com
© Exelon Corporation, 2012
39